
A Multiple-instance Learning Approach for the Assessment of
Gallbladder Vascularity from Laparoscopic Images
Constantinos Loukas
1a
, Athanasios Gazis
1b
and Dimitrios Schizas
2c
1
Medical Physics Lab, Medical School, National and Kapodistrian University of Athens, Mikras Asias 75 str., Athens,
Greece
2
1
st
Department of Surgery, Laikon General Hospital, National and Kapodistrian University of Athens, Athens, Greece
Keywords: Surgery, Laparoscopic Cholecystectomy, Gallbladder, Vascularity, Classification, Multiple Instance Learning.
Abstract: An important task at the onset of a laparoscopic cholecystectomy (LC) operation is the inspection of
gallbladder (GB) to evaluate the thickness of its wall, presence of inflammation and extent of fat. Difficulty
in visualization of the GB wall vessels may be due to the previous factors, potentially as a result of chronic
inflammation or other diseases. In this paper we propose a multiple-instance learning (MIL) technique for
assessment of the GB wall vascularity via computer-vision analysis of images from LC operations. The bags
correspond to a labeled (low vs. high) vascularity dataset of 181 GB images, from 53 operations. The instances
correspond to unlabeled patches extracted from these images. Each patch is represented by a vector with color,
texture and statistical features. We compare various state-of-the-art MIL and single-instance learning
approaches, as well as a proposed MIL technique based on variational Bayesian inference. The methods were
compared for two experimental tasks: image-based and video-based (i.e. patient-based) classification. The
proposed approach presents the best performance with accuracy 92.1% and 90.3% for the first and second
task, respectively. A significant advantage of the proposed technique is that it does not require the time-
consuming task of manual labelling the instances.
1 INTRODUCTION
Laparoscopic surgery (LS), offers substantial benefits
for the patient such as minimized blood loss, rapid
recovery, better cosmetic results and lower risk of
infection. In addition, the laparoscopic camera allows
to record the video of the surgery, thus providing a
rich set of visual information that can be leveraged for
various computer vision applications. For example,
vision-based systems may provide context-aware
assistance to the surgeon during or after the operation
to facilitate improvements in the delivery of surgical
care. Artificial Intelligence (AI) in surgery has a key
role in this direction by training a computer to analyze
and understand images and ultimately enhance
surgical performance throughout the patient care
pathway (Ward et al., 2021).
To date, surgical video analysis has been
employed to provide key semantic information about
a
https://orcid.org/0000-0001-7879-7329
b
https://orcid.org/0000-0003-4965-5270
c
https://orcid.org/0000-0002-7046-0112
the status of an operation, such as its current phase
(Cheng et al., 2021), remaining duration (Marafioti et
al., 2021), instrument detection (Zhang et al., 2020),
and coagulation events (Loukas and Georgiou, 2015).
Post-operatively, the video recordings have been
employed for surgical performance analysis (Funke et
al., 2019), keyframe extraction (Loukas et al., 2018),
surgical gesture recognition (van Amsterdam et al.,
2021), and management of large-scale surgical data
repositories (Al Abbas et al., 2019). In addition, the
availability of annotated video datasets, such as
Cholec80 (Twinanda et al., 2017), has been a key
factor in recent AI applications, allowing the
employment of state-of-the-art machine learning
techniques such as deep learning.
Apart from recording the video of the operation,
the surgeon may also acquire still frames that reflect
certain visual features of the operated organ or the
outcome of a procedural task. Moreover, the acquired
Loukas, C., Gazis, A. and Schizas, D.
A Multiple-instance Learning Approach for the Assessment of Gallbladder Vascularity from Laparoscopic Images.
DOI: 10.5220/0010762500003123
In Proceedings of the 15th International Joint Conference on Biomedical Engineering Systems and Technologies (BIOSTEC 2022) - Volume 2: BIOIMAGING, pages 15-23
ISBN: 978-989-758-552-4; ISSN: 2184-4305
Copyright
c
2022 by SCITEPRESS – Science and Technology Publications, Lda. All rights reserved
15

images may be utilized post-operatively in the
patient’s formal report, for future reference about the
patient’s anatomy and for medical education or
research purposes (Loukas et al., 2011). Recently, a
few research works have been published on the
analysis of still frames extracted from the video of a
surgery. A framework for multi-label classification of
laparoscopic images into five anatomic classes was
proposed in (Loukas and Sgouros, 2020). In (Madad
Zadeh et al., 2020) a convolutional neural network
(CNN) was employed for semantic image
segmentation into surgical tools and gynecologic
anatomic structures. In (Baghdadi et al., 2019) a
computer vision technique was applied to surgical
images with the aim to assess surgical performance
on pelvic lympl node dissection. In (Derathé et al.,
2020), visual features extracted from manual
annotations of still video frames were employed to
assess surgical exposure, an important indicator of
surgical expertise. AI on surgical images has also
been applied recently for intraoperative guidance and
detection of adverse events (Madani et al., 2020,
Beyersdorffer et al., 2021).
In this paper we elaborate from a different
perspective on the image-based assessment of
gallbladder (GB) vascularity proposed recently in
(Loukas et al., 2021). In laparoscopic
cholecystectomy (LC), a common surgical technique
for the treatment of GB diseases, the surgeon initially
inspects the GB to assess certain features that are
important for the strategy to be performed. Some of
these features include thickness of the GB wall,
indications of inflammation and fat coverage. In
addition, difficulty in the visualization of the GB
vessels may result from fatty infiltration or increased
thickening of the GB wall (potentially as a result of
chronic inflammation or other diseases), conditions
that may suggest increased intraoperative difficulty
(Iwashita et al., 2016).
In (Loukas et al., 2021) the main focus was on the
vascularity assessment of GB images extracted from
LC videos. The employed method was based on a
CNN trained to classify the GB wall into vascularity
levels (e.g. low vs. high). Due to the small number of
GB images available for CNN training, 800 image
patches were manually annotated by surgical experts.
Although highly promising (91.7% accuracy), this
approach was based on the time consuming task of
patch annotation to create the ground truth dataset.
In the present work we propose an alternative
strategy that alleviates this limitation. In particular,
we employ a different machine learning approach
1
https://mpl-en.med.uoa.gr/as/datasets
based on multiple-instance learning (MIL).
Compared to single-instance learning (SIL), in MIL
the training examples correspond to bags of instances
and each bag is assigned a specific label. In the
present work, the bags correspond to the limited
dataset of GB images available, and the instances
correspond to sequential patches extracted from the
GB images. It is important to note that the MIL
approach does not require that the labels of the
instances are known, but rather the labels of the bags.
This is particularly suited in our case since the
number of GB images available is limited, whereas
from each GB image we can extract dozens of
patches, without the need to annotate them.
The rest of the paper is organized as follows. The
next section presents the employed dataset, the image
feature extraction process and various state-of-the-art
MIL techniques employed, as well as a proposed one
based on variational Bayesian inference.
Subsequently follow the comparative experiments
and presentation of the results for two experimental
tasks (image-based and video-based classification).
Finally, we conclude the paper with a discussion and
directions for future work.
2 METHODOLOGY
2.1 Dataset
For the purpose of this study we employed the
GBVasc181 dataset
1
(Loukas et al., 2021), which
includes 181 surgical images with manual contours
(regions of interest-ROIs) of the GB wall. The images
are extracted from 53 LC videos of the Cholec80
dataset (Twinanda et al., 2017) and the ROIs contain
the body and fundus of the GB. In addition, the
dataset provides labels with respect to the vascularity
level of the GB ROIs: low (L) and high (H)
vascularity. H denotes presence of prominent
superficial vessels whereas L denotes absence of
vessels or extensive fat coverage. The labelling was
performed by two expert surgeons (E1 and E2) via
visual inspection of the GB ROIs. According to
(Loukas, et al., 2021), the level of agreement between
the two experts was high (~92%), so we randomly
chose the annotations of expert E1 as the ground-truth
for algorithm training.
The GBVasc181 dataset also includes vascularity
annotation for 800 image patches extracted
selectively from the ROIs, but this information was
not used in this study. Instead, based on the MIL
BIOIMAGING 2022 - 9th International Conference on Bioimaging
16
formulation, each GB ROI was considered as a bag of
instances that correspond to image patches (64x64).
The patches were extracted from each ROI in a
sliding window fashion with 50% overlap. In total
3,272 patches were extracted from the 181 ROIs.
Table 1 provides a statistical overview of the
employed ROI/patch dataset and the ground-truth
annotations.
Table 1: Data statistics. Number (#) of GB images and
patches per vascularity class (L, H).
Vascularity class: L H
# annotated GB images (ROIs): 71 110
# patches extracted
from the GB ROIs:
Min 2 1
Max 51 70
Median 14 17
Total 1214 2058
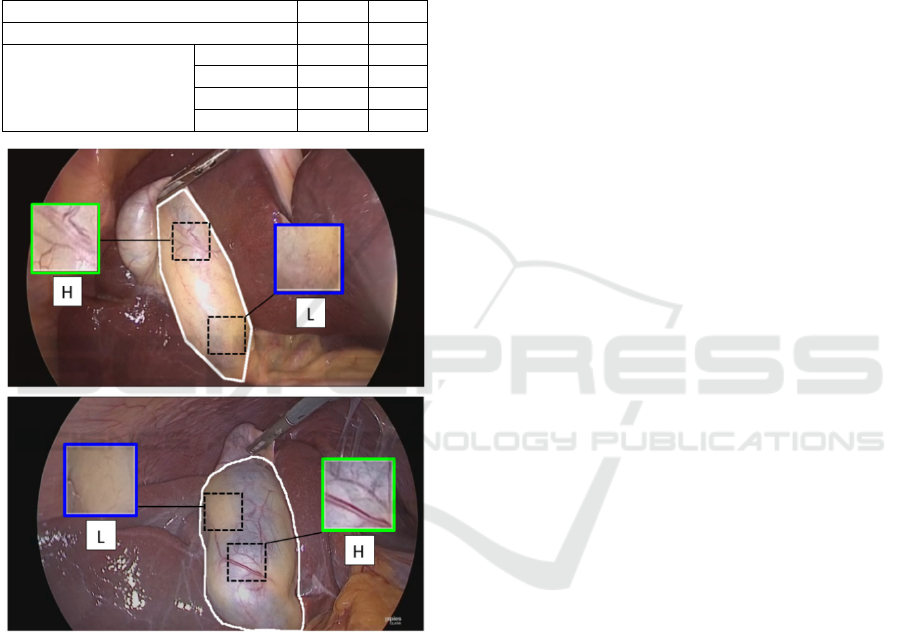
Figure 1: Examples of GB images from the GBVasc181
dataset. The manual outline of the ROI is shown in white.
The ground-truth vascularity label for the top and bottom
ROI is L and H, respectively. Insets show sample patches
with different vascularity.
It should be noted that the patch labels were
considered unknown. Indeed, the patches extracted
from a GB ROI may not necessarily inherit the label
of the ROI. A GB ROI with vascularity H may also
contain patches from the L class, and vice versa. As
shown in Figure 1 the GB wall presents a variable
vascularity pattern with regions from both classes.
Hence, the employed dataset is in essence weakly
labeled and the MIL paradigm is particularly suited:
only the labels of the bags (ROIs) is known, whereas
the label of the instances (patches) contained in each
bag is unknown.
2.2 Feature Extraction
Each patch was represented by a 707-long feature
vector that included 3 categories of features (Lux and
Marques, 2013). First, color and color-edge features
were extracted after the patches were quantized to 32
colors via k-means. Compared to uniform color
quantization, the previous approach was preferred
since the color values expanded over a limited region
in the RGB space. The number of color features was
259 and included: mean RGB color values, color
histogram, auto color correlogram, improved color
coherence, and color edge magnitude-direction
histograms. Color coherence considers the size and
locations of the regions with a particular quantized
color and the auto color correlogram measures how
often a quantized color finds itself in its immediate
neighborhood. The color edge magnitude-direction
histograms employs the Sobel gradient operator on
each quantized color image plane providing two
histograms for the edge magnitude and direction.
The second category included mostly information
about texture (405 features). The input was the
intensity component of the color image and the
extracted features were: histogram of oriented
gradients (HOG) with 7 bins and cell-size=16,
Tamura features (coarseness, contrast and
directionality), and the edge histogram descriptor.
The third category included 43 statistical features
extracted from the RGB image. In particular, we
extracted global features such as skewness and
kurtosis as well as statistical features using the
following higher-order matrix-based types: GLCM
(gray-level co-occurrence matrix), GLRLM (gray-
level run-length matrix), GLSZM (gray-level size
zone matrix) and NGTDM (neighborhood gray-tone
difference matrix). From each matrix various
statistical features were extracted such as: energy,
contrast, etc. (GLCM); short run emphasis, long run
emphasis, etc. (GLRLM); small zone emphasis, large
zone emphasis, etc. (GLSZM); complexity, strength,
etc. (NGTDM). It should be noted that compared to
the standard calculation of these matrices based on 8-
heignboors connectivity, in our case the RGB image
was considered a 3D volume. Thus, the matrices were
obtained using 26-neighboors connectivity (i.e. pixels
were considered to be neighbors in all 13 directions
in the three dimensions).
After feature extraction, all features were
concatenated into a patch-based feature vector with
A Multiple-instance Learning Approach for the Assessment of Gallbladder Vascularity from Laparoscopic Images
17

707 dimensions. To reduce the dimensionality of the
feature space, PCA was performed using the feature
vectors collected from all patches of the training set
of GB images. This process led to feature vectors with
211-223 dimensions (depending on the training fold),
that accounted for > 95% of the total variance.
2.3 MIL Methods
MIL is a form of supervised learning applicable to
problems where the training examples correspond to
bags of instances and each bag is assigned a specific
label but the labels of the instances are usually
unknown. Under the MIL formulation,
{
,
}
is a data set of N training bags
and each bag is
associated with label
. A bag contains a set of
instances:
=
, usually in form of a feature
vector, whereas the number of instances
may vary
among the bags.
The MIL formulation was first proposed to solve
the binary musk drug activity prediction problem
(Dietterich et al., 1997): a molecule (bag of instances)
is considered active (resp. inactive) if one (resp. none)
of its spatial confirmations (instances) is able to bind
to a certain target site. The solution to this problem
was approached via the standard MIL assumption,
which states that a positive bag contains at least one
positive instance, whereas negative bags contain only
negative instances:
=
+1,∃
:
=+1
−1,∀
:
=−1
(1)
where
={+1,−1} denotes the hidden class
label for an instance
that belongs to bag .
MIL algorithms may be categorized according to
their ability to perform instance-level or bag-level
predictions (Quellec et al., 2017). The first category
(primarily instance-level) targets instance prediction
but may easily be employed for bag prediction, as
required for the purpose of this study. After training
an instance-level detector, a bag is positive if it
contains at least one positive instance otherwise it is
negative. This category includes algorithms such as
the Axis-parallel hyper rectangle (APR), Diversity
Density (DD), its variant Expectation-Maximization
DD (EM-DD), and mi-SVM. The aforementioned
approaches follow the standard MIL assumption.
The second category includes bag-level
algorithms that are optimized for bag-level prediction
and can be further divided according to their ability
to also perform instance-level prediction (primary
bag-level) or not (exclusively bag-level). A well-
known primary bag-level algorithm is MI-SVM and
it follows the standard MIL assumption. From the
exclusively bag-level subcategory we employed the
Citation KNN (CKNN) and mi-Graph, both of which
follow alternative MI assumptions (nearest neighbor
and graph assumptions, respectively). For an
extensive review of MIL techniques the reader is
referred to (Quellec et al., 2017),(Amores, 2013). In
the following we summarize the aforementioned MIL
algorithms and a proposed method (MI-VBGMM)
that falls under the exclusively bag-level category.
All methods were employed for the GB vascularity
classification problem studied in this paper.
The APR (Dietterich et al., 1997) was the first
method that introduced the MIL paradigm, aiming to
find a hyper rectangle that contain at least one
instance from each positive bag while excluding all
the instances from negative bags. A bag is classified
as positive (resp. negative) if one (resp. none) of its
instances lies within the APR.
For the DD method (Maron and Lozano-Pérez,
1998), the goal is to find a discriminative point in the
feature space so that in its neighborhood all positive
bags have at least on instance, while instances from
negative bags are far away. The location of this point
and the feature weights defining the appropriate
neighborhood are found by maximizing a DD metric.
The EM-DD (Zhang and Goldman, 2001) is a widely
known variant that employs the EM algorithm.
The mi-SVM and MI-SVM (Andrews et al.,
2003) both employ the maximum margin concept of
the SVM algorithm. The mi-SVM method focuses on
instance-level prediction by maximizing the
separation between positive and negative instances.
The goal of MI-SVM is to maximize positive and
negative bags by focusing on the most ‘most positive’
and ‘least negative’ instances contained in the
positive and negative bags, respectively.
CKNN generalizes the k-nearest neighbors (k-
NN) idea using the Hausdorff distance as the bag-
level distance metric (Wang and Zucker, 2000). In
addition to the nearest neighbors of a bag, citers that
count the candidate bag as one of their neighbors are
also considered in the classification rule.
The mi-Graph relies on the assumption that the
spatial relationships among instances are important
for the label of the bag. This method employs SVM
classification at the bag-level using a kernel that is
based on the ɛ-graph representation of the bags (Zhu
et al., 2009).
The proposed method (MI-VBGMM) belongs to
the exclusively bag-level subcategory and employs
variational Bayesian Gaussian mixture models
(VBGMM) at its core. The overall process consists of
3 main steps. First, the instances from all bags of the
BIOIMAGING 2022 - 9th International Conference on Bioimaging
18

training set are clustered using VBGMM. Compared
to other techniques (k-means, k-medoids, GMM,
etc.), VBGMM does not require to predefine the
number of clusters. Starting with an initial (usually
high) number of clusters K, the optimum number of
clusters K* is estimated by excluding components
with small weights (<1%). The weights are computed
via a formula that provides the expected value of the
mixing coefficients involved in the GMM. In this
study K* was found about 24 (depending on the
training fold). A detailed implementation of the
algorithm with application to surgical images is
provided in (Loukas and Sgouros, 2020),(Bishop,
2006). Second, each instance
is represented by the
probability
that the instance is assigned to each
of the K clusters. The formula for
is omitted for
brevity. Finally, each bag
is represented by a novel
feature vector
that accumulates
of all
instances for the
∗
components:
=×
∑
,…,
∑
∗
(2)
where is a normalization factor so that
‖
‖
=
1.
Having obtained the VBGMM parameters, the
previous step is also employed to transform the test
bags into novel feature vectors
. Finally, after
having a vector representation for every bag, the MIL
problem is transformed into a standard classification
task which was addressed via the SVM algorithm.
After SVM training, a test bag is classified as positive
(resp. negative), if the corresponding SVM score is
positive (resp. negative).
2.4 Experimental Protocol
The 53 videos were randomly split into five-folds, so
that every fold included GB images (and their
corresponding patches), from different operations
(i.e. patients). Based on a five-fold cross-validation,
one of the five folds served as the test set (20%) and
the other four folds as the training set (80%).
We evaluated two experimental tasks. For the first
task (image level classification) each image is
considered as a bag, annotated with its vascularity
label (L or H), and the instances are the patches
extracted from the images. On average there are 3.4
images per video and 18 patches per image (i.e. a
single bag contains about 18 instances). For each
experimental run the training and test sets included
approximately 145 and 36 bags, respectively.
For the second task (video level classification),
we evaluated the algorithm’s performance at the
video level based on majority voting of the image
labels predicted from the first task. In particular, the
label with most votes was assigned to the video. In
case the label counts of the two classes were equal,
the label with the highest probability was considered.
For the ground truth video labels we did not
encountered such an issue. For every video the
majority of its image labels (annotated by the expert
surgeon) corresponded to a single class.
3 RESULTS
For both experimental tasks the performance of each
algorithm was evaluated via the metrics: accuracy
(Acc), precision (Pre), recall (Rec), and F1. The
results are presented as mean values across the five
experimental runs. The convention used was: the
label “positive” (resp. “negative”) refers to H (resp.
L) vascularity images.
Eleven methods, as described in Section 2.3, were
evaluated on the GBVasc181 dataset: APR, CKNN,
DD, EM-DD, mi-Graph, mi-SVM and MI-SVM and
MI-VBGMM (the last three with linear and RBF
kernels for the SVM classifier). For all methods,
except mi-Graph and MI-VBGMM, we used the
implementation reported in (Wang, 2008). The mi-
Graph was obtained from (Zhu et al., 2009) and the
reference website of the authors (LAMDA). The
proposed method MI-VBGMM was implemented
based on (Bishop, 2006) and our previous work
(Loukas and Sgouros, 2020). For each method the
hyper-parameters were optimized using grid search.
In the following we first present the result for the two
experimental tasks and then we assess the best MIL
method against various SIL methods.
3.1 Comparison of MIL Methods
In the first experimental task (image-level
classification), the goal was to predict the vascularity
label of the GB ROIs using the extracted patches.
Table 2 shows the performance of the examined
methods. As expected, APR, DD and EM-DD have
the lowest performance, probably because positive
instances do not form a single cluster in the feature
space. The mi-SVM approach has the highest
performance among the primarily instance-level
algorithms (87.5% Acc). However, the bag-level
algorithms (mi-Graph, MI-SVM, CKNN and MI-
VBGMM) outperform all instance-level algorithms
(88.2-92.1% Acc). CKNN and MI-SVM have similar
performance (88.2% and 88.9% Acc), whereas mi-
Graph shows slightly better performance (90.2%
Acc). For the SVM-based methods, the linear kernel
A Multiple-instance Learning Approach for the Assessment of Gallbladder Vascularity from Laparoscopic Images
19

seems to be slightly more suitable compared to the
RBF kernel. The proposed method shows the best
performance across most metrics: 92.1% Acc, 94.6%
Pre and 94.0% F1. As reported in (Loukas et al.,
2021), the agreement at the image-level between two
expert surgeons was close to 92%, which is similar to
the performance of MI-VBGMM linear.
Table 2: MIL performance comparison for image-level
classification. Best results column-wise are in bold.
Second-best results are underlined. Symbols
†
and
‡
denote
instance-level and bag-level algorithms, respectively.
Method
Acc
(%)
Pre
(%)
Rec
(%)
F1
(%)
APR
†
65.2 68.0 87.2 76.4
CKNN
‡
88.2 88.3 93.8 91.0
DD
†
41.3 93.3 9.7 17.6
EM-DD
†
66.9 67.1 95.0 78.6
mi-Graph
‡
90.2 93.0 91.8 92.4
mi-SVM linear
†
87.5 85.1 97.4 90.8
mi-SVM RBF
†
86.9 82.9
100.0
90.7
MI-SVM linear
‡
88.9 92.2 90.4 91.3
MI-SVM RBF
‡
88.5 93.0 88.9 90.9
MI-VBGMM
linear (proposed)
‡
92.1 94.6
93.4
94.0
MI-VBGMM
RBF (proposed)
‡
91.1 93.8 92.4 93.1
Table 3: MIL performance comparison for video-level
classification. Best results column-wise are in bold.
Second-best results are underlined. Symbols
†
and
‡
denote
instance-level and bag-level algorithms, respectively.
Method
Acc
(%)
Pre
(%)
Rec
(%)
F1
(%)
APR
†
68.2 71.6 90.3 79.9
CKNN
‡
86.9 87.7 94.6 91.0
DD
†
39.8 93.3 14.6 25.2
EM-DD
†
68.6 70.4 94.6 80.7
mi-Graph
‡
88.6 91.5 92.1 91.8
mi-SVM linear
†
85.3 84.3 96.8 90.1
mi-SVM RBF
†
85.8 83.1
100.0
90.8
MI-SVM linear
‡
88.1 91.4 91.5 91.4
MI-SVM RBF
‡
87.5 92.0 90.0 91.0
MI-VBGMM
linear (proposed)
‡
90.3 93.8
92.1
92.9
MI-VBGMM
RBF (proposed)
‡
89.7 92.9 92.3 92.6
The next goal was to predict the vascularity label
of the patient’s GB using the images extracted from
the video of the operation (video-level classification).
Table 3 shows the results for this experimental task.
As described before, a majority-voting approach was
employed using the image labels predicted from the
first task. Similarly to the previous results, APR, DD
and EM-DD have the lowest performance and mi-
SVM shows the highest performance (85.3% Acc)
among the four instance-level methods. The accuracy
of the four bag-level algorithms (mi-Graph, MI-
SVM, CKNN and MI-VBGMM) is again higher than
that of the instance-level ones (86.9-90.3% Acc). The
proposed method presents the best performance,
higher than 90%, across all metrics: 90.3% Acc,
93.8% Pre, 92.1% Rec and 92.9% F1. For all SVM-
based methods the linear kernel results in a slightly
better performance. Moreover, the accuracy of the
proposed method is the highest than all other
methods, independent to the SVM kernel employed.
3.2 MIL vs. SIL
Based on the same setup employed for the MIL
experiments (i.e. experimental tasks and training/test
folds), we compared the proposed method (MI-
VBGMM) against five SIL methods: SVM (with
linear kernel), k-nearest neighbors (kNN), naïve
Bayes (NB), random forest (RF), and AdaBoost.
Hyper-parameter optimization was again performed
via grid search. In contrast to MIL, SIL methods
consider as samples the instances from all bags. For
each instance, the ground-truth label was assigned to
that of the bag it belongs to. After training, the label
of a candidate bag is predicted via majority voting of
the predicted labels of its instances. Hence, for the
first task (image-level classification) the label of a GB
ROI is determined by majority voting of the patch
predicted labels. For the second task (video-level
classification), the label prediction approach was the
same to that followed for the MIL methods, as
described previously.
Tables 4 and 5 show the results for the first and
second experimental tasks, respectively. The
proposed MIL method outperforms all other SIL
methods across most metrics. In particular, for image-
level classification the accuracy and F1 metric of MI-
VBGMM is higher by 3.6% and 2.5% compared to
the second best method, respectively (92.1% vs.
88.5%-SVM and 94.0% vs. 91.5%-AdaBoost).
Moreover, MI-VBGMM outperforms the CNN-based
method reported in (Loukas et al., 2021). In terms of
accuracy, the performance is slightly higher (92.1%
vs. 91.2%) whereas for the other metrics the
performance difference is notably higher (4.2% for
Pre, 1.9% for Rec and 3.1% for F1). Note that the
single instance CNN method in (Loukas et al., 2021)
employs 800 manually labelled patches for CNN
BIOIMAGING 2022 - 9th International Conference on Bioimaging
20
training. In contrast, MI-VBGMM training is based
only on manual labelling of the GB ROIs (181
images; same dataset as in (Loukas et al., 2021)),
resulting in a significant reduction in the annotation
cost.
For the video-level classification (Table 5), the
proposed method presents again the best
performance. The accuracy and F1 metric of MI-
VBGMM is higher by 2.5% and 0.8% compared to
the second best method (AdaBoost), respectively
(90.3% vs. 87.8% and 92.9% vs. 92.1%).
Table 4: Comparison of MIL (MI-VBGMM) vs. SIL
methods for image-level classification. Best results
column-wise are in bold. Second-best results are
underlined.
Method
Acc
(%)
Pre
(%)
Rec
(%)
F1
(%)
MI-VBGMM
linear (proposed)
92.1 94.6
93.4
94.0
SVM 88.5 88.9 91.4 90.1
kNN 86.9 88.6 92.9 90.7
NB 80.3 77.8 96.9 86.3
RF 87.2 86.3 96.4 91.1
AdaBoost 86.9 86.0
97.7
91.5
CNN 91.2 90.4 91.5 90.9
Table 5: Comparison of MIL (MI-VBGMM) vs. SIL
methods for video-level classification. Best results column-
wise are in bold. Second-best results are underlined.
Method
Acc
(%)
Pre
(%)
Rec
(%)
F1
(%)
MI-VBGMM
linear (proposed)
90.3 93.8
92.1
92.9
SVM 80.0 84.0 87.5 85.7
kNN 81.1 83.3 92.6 87.7
NB 78.1 78.0 96.1 86.1
RF 86.4 87.1 95.3 91.0
AdaBoost 87.8 87.9
96.7
92.1
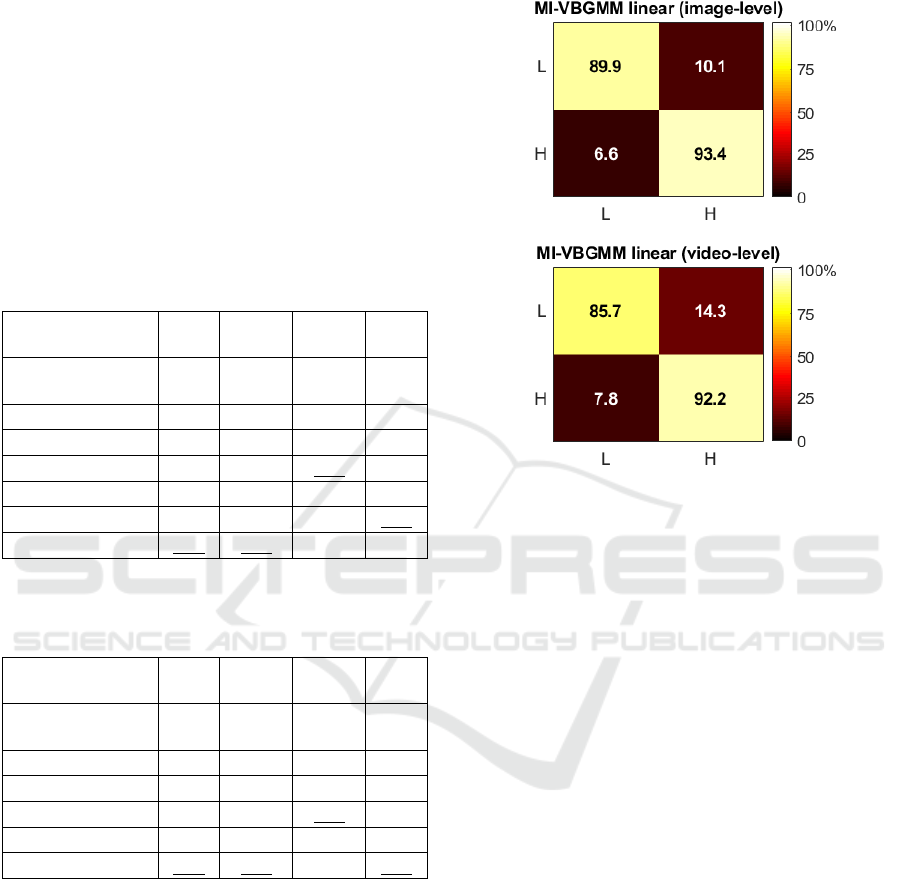
Figure 2 shows the normalized confusion
matrices for the best method (MI-VBGMM linear),
for the image- and video-level classification tasks.
The normalization was applied on the aggregation of
the confusion matrices across the five test-sets. It may
be seen that the H class is recognized better than the
L class in both experimental tasks (93.4 vs. 89.9 and
92.2 vs. 85.7). This may be due to the fact that the
presence of blood vessels in the H class images
provide a distinguishable pattern that is captured
more easily by the extracted features. In contrast, L
images are distinguishable only by their color
(yellowish due to great fat coverage), and they lack a
texture pattern due to the absence of blood vessels.
Figure 2: Color-coded confusion matrices of the proposed
method for the two experimental tasks (image-level and
video-level classification). The X and Y-axis represent
predicted and ground truth labels, respectively.
4 CONCLUSIONS
In this paper we investigate the potential of image-
based assessment of the GB wall vascularity from
intraoperative images using various state-of-the art
MIL techniques and a proposed bag-level approach
based on VBGMMs and SVM. In addition, we
compared the best MIL method with SIL techniques
in order to assess the significance of the multiple
instance concept over standard classification of single
instances.
Our results show that the MIL framework is
particularly suited to the problem of GB vascularity
classification. The GB image can be considered as a
bag, labelled with its vascularity level, whereas the
instances are patches extracted from the GB ROI. For
the image-level classification task, the proposed
approach presents the best performance with Acc
92.1%. For the video-level classification task the
accuracy was slightly lower, 90.3%. In terms of the
SIL methods, the best approach was based on a CNN
and provided slightly lower performance (91.2% Acc
for image-level classification). However, CNN
training requires manual annotation for a large
number of patches, which is tedious and time-
A Multiple-instance Learning Approach for the Assessment of Gallbladder Vascularity from Laparoscopic Images
21

consuming. In contrast, the proposed MIL technique
requires only manual annotation of the GB images,
the number of which is significantly lower. MIL can
thus leverage surgical image classification to improve
GB vascularity assessment, without the need of
labeling the patches extracted from every surgical
image.
A potential extension of the proposed work is to
apply the MIL concept directly at the patient-level. In
particular, in this study the video-level classification
was based simply on a majority voting of the image
labels from each video, mainly due to the small
number of operations available (only 53). Given a
larger video dataset, one could consider the patient as
the bag, along with its GB vascularity label, and the
patches extracted from the GB images of the video as
the instances. This way, the patient-level GB
classification could be improved, without the need of
labelling the images extracted from every video of the
operation.
As future work, we aim to expand the GBVasc181
dataset by performing more annotations upon the
Cholec80 video collection. Moreover, we aim to
combine the MIL concept with CNNs at the image-
level to improve further the classification
performance. In particular, we currently design a 3D
CNN architecture that takes as input a sequence of
patches extracted from a GB image and outputs the
vascularity label of the image. The generation of
spatial attention maps that allow visualization of GB
wall regions with a variable vascularity is also major
topic of interest for future research work.
ACKNOWLEDGEMENTS
The author thanks Special Account for Research
Grants and National and Kapodistrian University of
Athens for funding to attend the meeting
REFERENCES
Al Abbas, A.I. et al., 2019. Methodology for developing an
educational and research video library in minimally
invasive surgery, Journal of Surgical Education, 76(3),
pp. 745–755.
Amores, J., 2013. Multiple instance classification: Review,
taxonomy and comparative study, Artificial
Intelligence, 201, pp. 81–105.
van Amsterdam, B., Clarkson, M.J. and Stoyanov, D., 2021.
Gesture recognition in robotic surgery: A review, IEEE
Transactions on Biomedical Engineering, 68(6), pp.
2021–2035.
Andrews, S., Tsochantaridis, I. and Hofmann, T., 2003.
Support vector machines for multiple-instance learning,
In Advances in Neural Information Processing Systems,
pp. 1–8.
Baghdadi, A. et al., 2019. A computer vision technique for
automated assessment of surgical performance using
surgeons’ console-feed videos, International Journal of
Computer Assisted Radiology and Surgery, 14(4), pp.
697–707.
Beyersdorffer, P. et al., 2021. Detection of adverse events
leading to inadvertent injury during laparoscopic
cholecystectomy using convolutional neural networks,
Biomedizinische Technik/Biomedical Engineering,
66(4), pp. 413-421.
Bishop, C.M., 2006. Illustration: Variational Mixture of
Gaussians, in Pattern Recognition and Machine
Learning. New York: Springer-Verlag New York, Inc.,
pp. 474–481.
Cheng, K. et al., 2021. Artificial intelligence-based
automated laparoscopic cholecystectomy surgical
phase recognition and analysis’, Surgical Endoscopy,
(ahead of print).
Derathé, A. et al., 2020. Predicting the quality of surgical
exposure using spatial and procedural features from
laparoscopic videos, International Journal of Computer
Assisted Radiology and Surgery, 15(1), pp. 59–67.
Dietterich, T.G., Lathrop, R.H. and Lozano-Pérez, T., 1997.
Solving the multiple instance problem with axis-
parallel rectangles, Artificial Intelligence, 89(1–2), pp.
31–71.
Funke, I. et al., 2019. Video-based surgical skill assessment
using 3D convolutional neural networks, International
Journal of Computer Assisted Radiology and Surgery,
14(7), pp. 1217–1225.
Iwashita, Y. et al., 2016. What are the appropriate
indicators of surgical difficulty during laparoscopic
cholecystectomy? Results from a Japan-Korea-Taiwan
multinational survey, Journal of Hepato-Biliary-
Pancreatic Sciences, 23(9), pp. 533–547.
Loukas, C. et al., 2011. The contribution of simulation
training in enhancing key components of laparoscopic
competence, The American Surgeon, 77(6), pp. 708–
715.
Loukas, C. and Georgiou, E., 2015. Smoke detection in
endoscopic surgery videos: a first step towards retrieval
of semantic events, International Journal of Medical
Robotics and Computer Assisted Surgery, 11(1), pp.
80–94.
Loukas, C. et al., 2018. Keyframe extraction from
laparoscopic videos based on visual saliency detection,
Computer Methods and Programs in Biomedicine, 165,
pp. 13–23.
Loukas, C. and Sgouros, N.P., 2020. Multiinstance
multilabel learning for surgical image annotation, The
International Journal of Medical Robotics and
Computer Assisted Surgery, 16 (e2058), pp. 1–12.
Loukas, C., Frountzas, M. and Schizas, D., 2021. Patch-
based classification of gallbladder wall vascularity
from laparoscopic images using deep learning,
BIOIMAGING 2022 - 9th International Conference on Bioimaging
22

International Journal of Computer Assisted Radiology
and Surgery, 16(1), pp. 103–113.
Lux, M. and Marques, O., 2013. Visual information
retrieval using Java and LIRE, Synthesis Lectures on
Information Concepts, Retrieval, and Services. Edited
by G. Marchionini. Morgan & Claypool.
Madad Zadeh, S. et al., 2020. SurgAI: deep learning for
computerized laparoscopic image understanding in
gynaecology, Surgical Endoscopy, 34(12), pp. 5377–
5383.
Madani, A. et al., 2020. Artificial intelligence for
intraoperative guidance: using semantic segmentation
to identify surgical anatomy during laparoscopic
cholecystectomy, Annals of Surgery, (ahead of print).
Marafioti, A. et al., 2021. CataNet: Predicting remaining
cataract surgery duration, In MICCAI 2021, 24
th
International Conference on Medical Image Computing
and Computer-Assisted Intervention. Strasbourg,
France, Springer, pp. 426-435.
Maron, O. and Lozano-Pérez, T., 1998. A framework for
multiple-instance learning, In Proceedings of Advances
in Neural Information Processing Systems. Denver,
CO, USA. MIT Press, pp. 570–576.
Quellec, G. et al., 2017. Multiple-Instance Learning for
Medical Image and Video Analysis, IEEE Reviews in
Biomedical Engineering, 10, pp. 213–234.
Twinanda, A.P. et al., 2017. EndoNet: A deep architecture
for recognition tasks on laparoscopic videos, IEEE
Transactions on Medical Imaging, 36(1), pp. 86–97.
Wang, J., 2008. MILL: A Multiple Instance Learning
Library. Carnegie Mellon University. Available at:
http://www.cs.cmu.edu/~juny/MILL/.
Wang, J. and Zucker, J.-D., 2000. Solving the multiple-
instance problem: a lazy learning approach, In
Proceedings of the 17
th
International Conference on
Machine Learning. San Francisco, CA, USA, pp. 1119–
1126.
Ward, T.M. et al., 2021. Surgical data science and artificial
intelligence for surgical education, Journal of Surgical
Oncology. 124(2), pp. 221–230.
Zhang, B. et al., 2020. Surgical tools detection based on
modulated anchoring network in laparoscopic videos,
IEEE Access, 8, pp. 23748–23758.
Zhang, Q. and Goldman, S.A., 2001. EM-DD: An improved
multiple-instance learning technique, In Advances in
Neural Information Processing Systems, pp. 1073–
1080.
Zhu, Z.-H., Sun, Y.-Y. and Li, Y.-F., 2009. Multi-instance
learning by treating instances as non- I.I.D. samples, In
Proceedings of the 26
th
International Conference on
Machine Learning. Montreal, Canada, pp. 1249–1256.
A Multiple-instance Learning Approach for the Assessment of Gallbladder Vascularity from Laparoscopic Images
23
