
Animal Fiber Identification under the Open Set Condition
Oliver Rippel
1 a
, Sergen G
¨
ulc¸elik
1
, Khosrow Rahimi
2
, Juliana Kurniadi
2
, Andreas Herrmann
2
and Dorit Merhof
1 b
1
Institute of Imaging & Computer Vision, RWTH Aachen University, Aachen, Germany
2
DWI – Leibniz-Institut f
¨
ur Interaktive Materialien, Aachen, Germany
Keywords:
Out-of-Distribution Detection, Natural Fiber Identification, Classification, Open Set Recognition, Machine
Learning.
Abstract:
Animal fiber identification is an essential aspect of fabric production, since specialty fibers such as cashmere
are often targeted by adulteration attempts. Proposed, automated solutions can furthermore not be applied in
practice (i.e. under the open set condition), as they are trained on a small subset of all existing fiber types only
and simultaneously lack the ability to reject fiber types unseen during training at test time. In our work, we
overcome this limitation by applying out-of-distribution (OOD)-detection techniques to the natural fiber iden-
tification task. Specifically, we propose to jointly model the probability density function of in-distribution data
across feature levels of the trained classification network by means of Gaussian mixture models. Moreover,
we extend the open set F-measure to the so-called area under the open set precision-recall curve (AUPR
os
), a
threshold-independent measure of joint in-distribution classification & OOD-detection performance for OOD-
detection methods with continuous OOD scores. Exhaustive comparison to the state of the art reveals that our
proposed approach performs best overall, achieving highest area under the class-averaged, open set precision-
recall curve (AUPR
os,avg
). We thus show that the application of automated fiber identification solutions under
the open set condition is feasible via OOD detection.
1 INTRODUCTION
Animal fibers possess desirable characteristics such
as thermal insulation, moisture wicking and softness,
making them an important material for fabric pro-
duction (McGregor, 2018). Since specialty fibers
(e.g. cashmere) excel at one or more of the above
properties they achieve premium prices on the mar-
ket (International Wool Textile Organisation, 2018).
Said prices, however, render specialty fibers an at-
tractive target for adulteration, and adulteration rates
between 15-60% have been reported for cashmere
products (Waldron et al., 2014; Phan and Wortmann,
2001).
Various fiber identification methods have been
proposed to counteract adulteration (Rane and Barve,
2011; Kim et al., 2013; Zoccola et al., 2013; In-
ternational Wool Textile Organisation, 2000; Amer-
ican Society for Testing and Materials, 1993). Out
of those, optical identification methods are the
most widely applicable. Here, fibers are identi-
a
https://orcid.org/0000-0002-4556-5094
b
https://orcid.org/0000-0002-1672-2185
fied based on their surface morphology using ei-
ther optical microscopy (American Society for Test-
ing and Materials, 1993) or scanning electron mi-
croscopy (SEM) (International Wool Textile Organ-
isation, 2000). Despite being subjective in nature and
requiring extensively trained experts to achieve reli-
able results (Zhang and Ainsworth, 2005; Wortmann,
1991), optical identification methods are still the ones
predominantly used in industry.
In order to overcome the limitations of human ex-
perts, it has been proposed to automate the fiber iden-
tification by means of pattern recognition (Yildiz,
2020; Robson, 1997; Robson, 2000; Xing et al.,
2020a; Xing et al., 2020b; Rippel et al., 2021a).
While prior work has shown that accurate fiber iden-
tification is possible, the application of the developed
solutions in practice is hindered by the following two
facts: (I) Developed solutions train & evaluate their
algorithms only on a small subset of all existing fiber
types. Even though up to 11 fiber types (10 specialty
fibers + wool) can be identified by a human expert
(International Wool Textile Organisation, 2000), re-
search typically focusses on binary classification, e.g.
36
Rippel, O., Gülçelik, S., Rahimi, K., Kurniadi, J., Herrmann, A. and Merhof, D.
Animal Fiber Identification under the Open Set Condition.
DOI: 10.5220/0010769800003124
In Proceedings of the 17th International Joint Conference on Computer Vision, Imaging and Computer Graphics Theory and Applications (VISIGRAPP 2022) - Volume 5: VISAPP, pages
36-47
ISBN: 978-989-758-555-5; ISSN: 2184-4321
Copyright
c
2022 by SCITEPRESS – Science and Technology Publications, Lda. All rights reserved

distinguishing between cashmere and wool (Robson,
1997; Robson, 2000; Xing et al., 2020a; Xing et al.,
2020b) or mohair and wool (Yildiz, 2020). (II) De-
veloped solutions lack the ability to reject fiber types
unseen during training at test time. Such a rejection
can be achieved in principle by out-of-distribution
(OOD)-detection techniques (Geng et al., 2020), fa-
cilitating the application of algorithms under the open
set condition (i.e. when training and test data do not
originate from the same data distribution). However,
the applicability of OOD-detection techniques to the
task at hand has not yet been demonstrated, and is the
main goal of our work.
Our contributions are as follows:
• We set up an exhaustive dataset comprising SEM-
images of 4 animal fiber types from 10 different
sources. In total, the dataset contains 6500 images
and covers the major axes of variation in natural
fiber surface morphology.
• We expand the open set F-measure
(Mendes J
´
unior et al., 2017) to facilitate the
evaluation of joint in-distribution classification &
OOD-detection performance for OOD-detection
methods that output continuous OOD scores.
The proposed metric can be used to assess joint
performance across all possible OOD thresholds.
• We propose to perform OOD detection by mod-
eling the joint distribution of in-distribution data
across feature levels of converged, convolutional
neural network (CNN)-based classifiers via Gaus-
sian mixture models (GMMs). We compare this
approach to state-of-the-art OOD-detection algo-
rithms.
• We also investigate effects of outlier exposure
(OE) on animal fiber identification under the open
set condition.
2 RELATED WORK
So far, the performance of animal fiber identifica-
tion algorithms has not yet been investigated under
the open set condition. We will therefore give a
short definition of open set recognition (OSR) and re-
lated terminology first. This will be followed by a
brief overview of proposed OOD-detection methods
as well as OE. Last, we will also present the open set
F-measure, which can be used to evaluate algorithms
under the open set condition.
2.1 Open Set Recognition
In general, OSR is concerned with problems that
arise specifically when training and test data do
not originate from the same data distribution (Geng
et al., 2020). In context of classification, this means
one is first tasked with distinguishing between in-
distribution and OOD data followed by the sub-
sequent d-class classification of the presumed in-
distribution data. The in-distribution is furthermore
composed of the d target classes, which are re-
ferred to as known known classes (KKCs) (e.g. spe-
cialty fibers such as cashmere). Opposed to the in-
distribution, the OOD is composed of known un-
known classes (KUCs), i.e. negative OOD samples
available during training/validation, and unknown un-
known classes (UUCs), i.e. samples not available for
training/validation.
The task of OOD detection can now be formulated
as “developing a measure which achieves lower val-
ues for in-distribution data compared to OOD data,
allowing for their separation”.
2.2 Methods for OOD Detection
OOD-detection methods commonly make use either
of the classifier’s unnormalized predictions (also re-
ferred to as “logits” in literature) or of the underly-
ing feature representations to formulate their OOD
scores.
2.2.1 OOD Detection based on Unnormalized
Predictions
The most straightforward method is to take the maxi-
mum softmax probability (MSP) of the unnormalized
predictions as the OOD score (Hendrycks and Gim-
pel, 2017). Specifically, let φ : R
c×h×w
→ R
d
be a
pre-trained CNN classifying into d classes. Then, for
a given input x, the softmax probability s
i
for class i
with i ∈
{
1, . . . , d
}
is calculated as
s
i
(x) =
e
φ
i
(x)
∑
d
e
φ
d
(x)
. (1)
The probability that a given input sample belongs
to class i is given by s
i
(x). The MSP now takes
−max
i
s
i
(x) as the OOD score, since the classifier
should be uncertain for samples not originating from
the in-distribution. Since it has been shown that clas-
sifiers suffer from so-called overconfident predictions
(Nguyen et al., 2015), i.e. from assigning high prob-
abilities to UUCs, modifications have been devel-
oped. For example, temperature scaling and input-
preprocessing have been proposed to improve MSP
Animal Fiber Identification under the Open Set Condition
37

performance in outlier detection using in-degree num-
ber (ODIN) (Liang et al., 2018). Additionally, the
classifier’s output has been used to define the energy-
based score (EBS)
EBS = − log
∑
i
e
φ
i
(x)
(2)
based on the ties between energy-based modeling and
machine learning (Liu et al., 2020). Alternatively, it
has been proposed to use the maximum of the un-
normalized predictions (MaxLogit) as OOD score, ar-
guing that putting the class-predictions in relation to
each other via the softmax operator may be detrimen-
tal when semantically similar classes are present in
the in-distribution (Hendrycks et al., 2019a).
2.2.2 OOD Detection based on Intermediate
Features
Complementary to the classifier’s predictions, the in-
termediate feature representations of a CNN can also
be used for OOD detection. Here, algorithms com-
monly try to estimate the probability density function
(PDF) of the in-distribution, often using the Gaus-
sian assumption (Rippel et al., 2021b; Kamoi and
Kobayashi, 2020) and its mixture models (Lee et al.,
2018b; Ahuja et al., 2019). Alternatively, deep gener-
ative models have also been used to fit unconstrained
PDFs to in-distribution data in intermediate features
(Kirichenko et al., 2020; Zisselman and Tamar, 2020;
Zhang et al., 2020; Blum et al., 2021). The OOD
score is then defined as the negative log-likelihood
(NLL) of a given input image x under the estimated
PDF.
Apart from the PDF-estimation, it has also been
proposed to use the distance of an input image x to
a fixed reference UUC point inside the intermediate
features, resulting in the feature space singularity dis-
tance (FSSD) (Huang et al., 2020). Here, it is pro-
posed to use uniformly distributed noise samples as
the reference UUC point, arguing that uniform noise
possesses the highest degree of OOD-ness.
OOD detection has also been performed by au-
toencoders (AEs), where the encoder’s features are
simultaneously used to classify images into d KKCs
and to reconstruct the input images via the decoder
(Oza and Patel, 2019; Sun et al., 2020; Neal et al.,
2018). The OOD score is then defined based on the
residual of the image reconstruction, which arguably
should be higher for OOD than in-distribution data.
It should be noted that these approaches roughly dou-
ble the computational complexity of the CNN and fail
to consistently achieve state-of-the-art results, and are
therefore not further regarded in this work.
2.3 Outlier Exposure
The OOD-detection methods from subsection 2.2 can
be applied to any converged CNN and require no
knowledge about OOD data. To now include avail-
able information about OOD data, it has been pro-
posed to use KUCs during training by means of OE
(Hendrycks et al., 2019c). In principle, an additional
loss term is introduced for the proposed OOD score
that is maximized for OOD samples (and optionally
minimized for in-distribution samples), e.g. Equa-
tion 2. While it has been shown that sampling the
OOD introduces a bias in the resulting OOD detector,
i.e. OE may actually hurt OOD detection for some
UUCs (Ye et al., 2021), OE has also been shown to
work for most UUCs (Hendrycks et al., 2019c). As an
alternative to real OOD images, approaches facilitat-
ing OE by means of synthetic OOD images have also
been proposed (Neal et al., 2018; Lee et al., 2018a;
Grci
´
c. et al., 2021).
2.4 Open Set F-measure
In order to jointly assess OOD-detection and in-
distribution classification performance, the open set
F-measure has been proposed (Mendes J
´
unior et al.,
2017). Specifically, for a d-class classification prob-
lem, the open set F-measure for class i is defined as
the harmonic mean between its open set precision and
recall, defined as
P
i
=
T P
i
T P
i
+ FP
i
, FP
i
=
d
∑
j=1
FP
i, j
+ FP
i,UUC
(3)
and
R
i
=
T P
i
T P
i
+ FN
i
, FN
i
=
d
∑
j=1
FN
i, j
+ FN
i,UUC
(4)
respectively. Compared to the closed set precision
and recall variants, it can be seen that false posi-
tives may now also be incurred by failing to reject an
OOD image followed by its misclassification to class i
Equation 3, and false negatives may be incurred by in-
correctly labeling in-distribution data as OOD Equa-
tion 4 (refer also Figure 1a).
As can be inferred from Equation 3 and Equa-
tion 4, the open set F-measure requires that every im-
age is labeled either as OOD and rejected or labeled as
in-distribution & subsequently classified. It is there-
fore ill-suited for OOD-detection methods that yield
continuous OOD scores and thus require thresholding
to achieve the aforementioned partitioning of images
into in-distribution and OOD.
VISAPP 2022 - 17th International Conference on Computer Vision Theory and Applications
38

3 NATURAL FIBER
IDENTIFICATION UNDER THE
OPEN SET CONDITION
We specify both our proposed OOD-detection method
as well as the threshold-independent evaluation of
joint in-distribution classification & OOD-detection
performance in the following.
3.1 OOD Detection via Modeling the
Joint PDF Across Feature Levels
Similar to (Ahuja et al., 2019), we model the PDF
of in-distribution data of a converged CNN by means
of GMMs. However, as a significant extension, we
propose to model the joint PDF of in-distribution data
across feature levels instead of modeling PDFs layer-
wise and summing their individual OOD scores. We
motivate this by the fact that consistency of an in-
put image x across feature levels of a network has
been shown to be an indicator of model generaliza-
tion, i.e. models with consistent representations gen-
eralize well (Natekar and Sharma, 2020). We argue
that inconsistent representations may be an indicator
of OOD, and show that joint PDF-estimation is ben-
eficial for OOD detection empirically in subsubsec-
tion 4.3.2.
Specifically, let φ : R
c×h×w
→ R
d
again be a pre-
trained CNN classifying into d classes. Each inter-
mediate layer’s output ψ
m
:= φ
m
(ψ
m−1
) for an input
image ψ
0
:= x
i
has c
m
features and spatial dimension
h
m
by w
m
. We now reduce over the spatial dimen-
sions h
w
and w
m
by means of averaging, resulting in
a feature vector c extracted per intermediate layer m.
By concatenating c of all intermediate layers, a larger
feature vector c
cat
is generated. To model the PDF of
in-distribution data in c
cat
, we make use of GMMs,
defined as
p(x) =
k
∑
i=1
θ
i
N (x|µ
i
, Σ
i
), (5)
with
∑
k
i=1
θ
i
= 1, k being the number of Gaussian mix-
ture components and µ
i
and Σ
i
denoting the mean
vector and covariance matrix of mixture component
i. We approximate the parameters of the GMM by
using the expectation maximization (EM) algorithm,
and determine the number of Gaussians k by means
of the Bayesian information criterion (BIC) (Bishop,
2006). Similar to other PDF-estimation approaches,
we use the NLL of an input image x under the esti-
mated PDF as the OOD score.
3.2 Threshold-independent Evaluation
of Joint In-distribution
Classification & OOD-detection
Performance
When looking at recent work on OOD detection,
it becomes apparent that OOD-detection and in-
distribution classification performances are reported
individually (Liu et al., 2020; Lee et al., 2018b;
Hendrycks and Gimpel, 2017; Liang et al., 2018).
We argue that reporting OOD-detection and in-
distribution classification performances separately
oversimplifies the open set classification problem,
and verify this claim experimentally in subsubsec-
tion 4.3.1.
Since most OOD-detection approaches proposed
in literature yield continous OOD scores, we extend
the open set F-measure (refer subsection 2.4) to be
threshold-independent. Specifically, we propose to
generate open set precision-recall curves (Davis and
Goadrich, 2006) by plotting the open set precision
& recall values (Equation 3 and Equation 4) across
all potential OOD thresholds t (refer Figure 1). Such
curves are generated for each class individually, and
the area under the open set precision-recall curve
(AUPR
os
) can now be used to measure the joint in-
distribution classification & OOD-detection perfor-
mance of a single class.
As we want to quantify the overall performance
across all classes, we furthermore propose to com-
pute the average of the class-wise open set preci-
sion & recall values for each threshold t. The re-
sulting values can then again be plotted for all t
to yield a class-averaged, open set precision-recall
curve (refer the yellow curve in Figure 1c). The area
under the class-averaged, open set precision-recall
curve (AUPR
os,avg
) can now be used to jointly as-
sess the overall in-distribution classification & OOD-
detection performance for multi-class classification
problems. Similar to the macro-averaged F1-score,
AUPR
os,avg
regards all KKCs as equally important.
Since not all OOD-detection methods provide contin-
uous OOD scores, we also report the Euclidean dis-
tance of the class-averaged, open set precision-recall
curve to the optimal point (1, 1), yielding PR
dist
for
comparison.
4 EXPERIMENTS
In the following, we conduct experiments to assess
the applicability of natural fiber identification algo-
rithms under the open set condition.
Animal Fiber Identification under the Open Set Condition
39
C
1
C
2
C
3
OOD
C
1
C
2
C
3
OOD
TP
1
TP
2
TP
3
FP
OOD
TU
FN
OOD
Predicted label
True label
C
1
C
2
C
3
OOD
t
OOD score
0.0 0.2 0.4 0.6 0.8 1.0
0.0
0.2
0.4
0.6
0.8
1.0
t
(R
avg,opt
, P
avg,opt
)
Recall
Precision
C
1
C
2
C
3
PR
os,avg
(a)
(b)
(c)
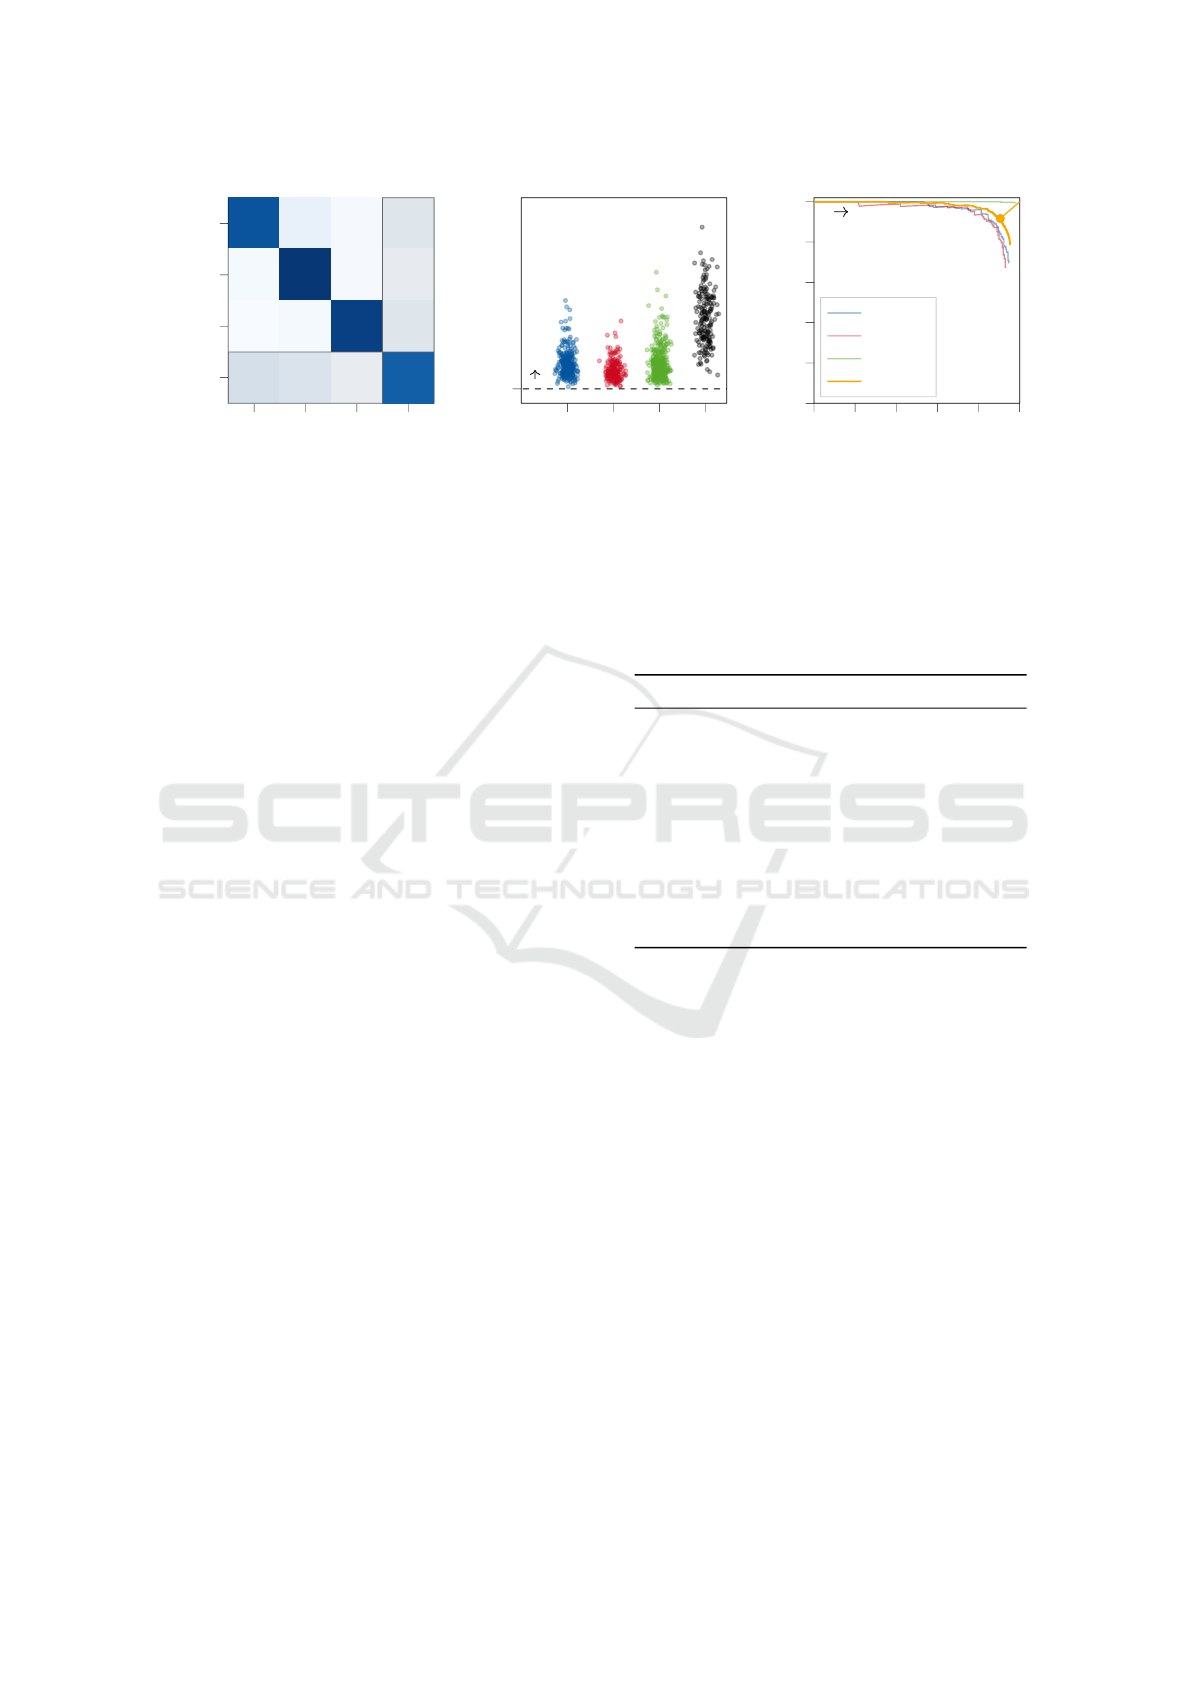
Figure 1: Threshold-independent evaluation of joint OOD-detection and in-distribution classification performance for multi-
class classification problems. The open set confusion matrix at a single OOD threshold t is shown in (a), whereas (b) shows
a scatter plot of OOD scores for a hypothetical 3-class open set classifier. By iterating over all possible OOD thresholds t,
class-wise as well as a class-averaged open set precision-recall curves can be computed, shown in (c). The areas under the
open set precision-recall curves can now be used to assess joint OOD-detection and in-distribution classification performance.
4.1 Dataset
We set up an exhaustive dataset to facilitate the per-
formed experiments. We employ SEM-imaging over
optical microscopy as it provides higher-resolution
images of the fiber surface morphology, and is the
only imaging technique shown to be reliable in com-
bination with human operators (Wortmann and Wort-
mann, 1992). Our dataset contains 4 animal fiber
types from 10 different sources, and 6500 images
in total. Furthermore, all specimen samples were
checked for purity & identity by a certified laboratory
prior to image acquisition.
When composing the dataset, focus was put on
sampling the three major axes of variation in natural
fiber surface morphology:
1. Inter-species variation. These are variations
present between different species, e.g. cashmere
& yak.
2. Intra-species variation. These are variations
present between different races of the same
species, e.g. merino wool and typical wool.
3. Treatment status variation. These are variations
introduced by the mechanical & chemical pro-
cesses applied to the fibers during fabric produc-
tion (e.g. they are dyed & bleached (d&b)). Vari-
ations incurred by treatment status are important
for the industrial application of animal fiber iden-
tification since adulteration attempts often involve
treatment of non-specialty fibers to make their
surface morphology more similar to the one of
specialty fibers.
Reference images for all three axes of variation
are shown in Figure 2.
Table 1: Characteristics of the animal fiber dataset used in
this work.
Fiber Type #Samples Use
Cashmere, Iranian 500 KKC
Cashmere, Chinese 500 KKC
Cashmere, brown 500 KKC
Yak, type 1 500 KKC
Yak, type 2 500 KKC
Wool, Suedwolle 1000 KKC
Wool, Interwool 1000 KKC
Wool, Suedwolle d&b 1000 UUC/KUC
Wool, merino 500 UUC/KUC
Silk 500 UUC/KUC
4.2 Experimental Setup
In the following, we describe the experimental setup
required to assess the applicability of natural fiber
identification algorithms under the open set condition.
4.2.1 Dataset Composition & Splits
In all experiments, the KKCs are cashmere, yak and
wool (refer Table 1). We pool all sources for the three
KKCs as it is not necessary to distinguish between
subtypes of animal fibers under current regulations
(Council of European Union, 2011; Freer, 1946). In
order to represent all three possible axes of varia-
tion the UUCs/KUCs are: silk (inter-species), merino
wool (intra-species) and d&b wool (treatment status).
Since all axes are equally important, we will report
the evaluation scores per axis and give their mean and
standard deviation to denote overall algorithmic per-
formance.
VISAPP 2022 - 17th International Conference on Computer Vision Theory and Applications
40
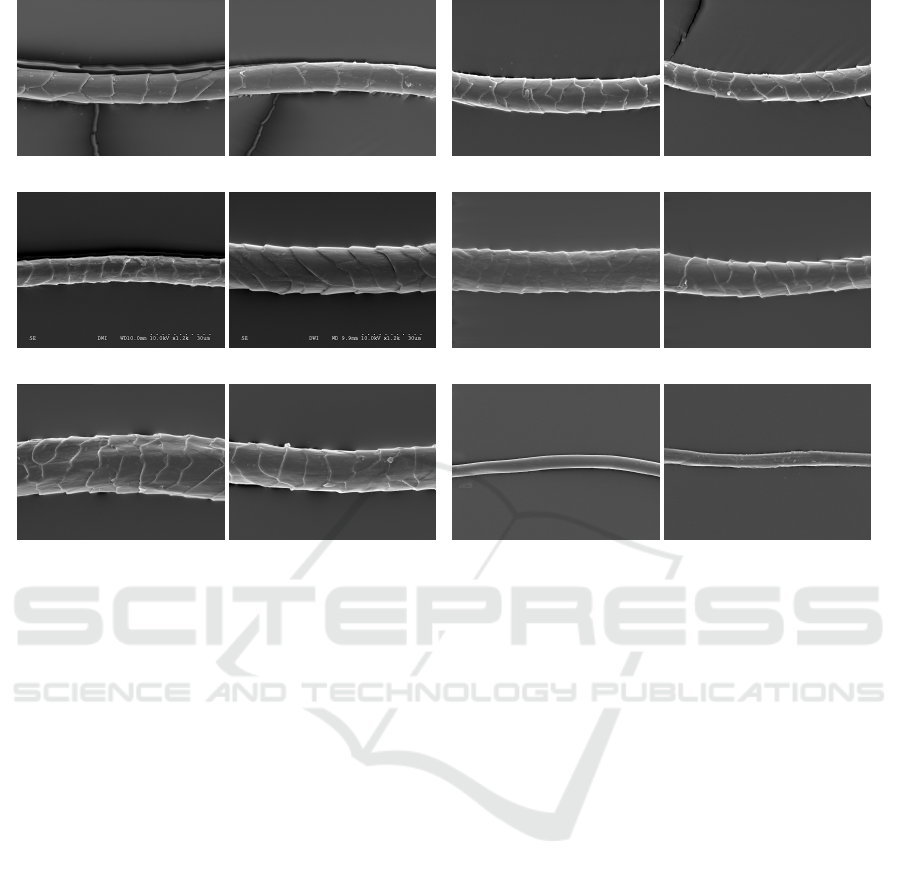
(a) Cashmere, Chinese (b) Yak, type 1
(c) Wool, Suedwolle (d) Wool, Suedwolle d&b
(e) Wool, merino (f) Silk
Figure 2: Reference sample images from the animal fiber dataset.
Following good scientific practice, we split our
dataset into training, validation and test splits. Since
KKCs, UUCs and KUCs serve different purposes dur-
ing model training, validation and testing, they are
split independently.
The KKCs are used to train the in-distribution
classifier for classifying into d = 3 classes. Since the
dataset is rather small, we perform a 5-fold cross-
validation to improve the robustness of our evalua-
tions. To this end, the data is split in a 3-1-1 split,
meaning that in each fold 60% of the data is used for
training, and 20% is used each for validation and test-
ing. Splits are furthermore stratified according to the
prevalence of the KKCs.
Assessing algorithmic performance under the
open set condition requires UUCs. Since UUCs
are per-definition unknown during model train-
ing/evaluation, they are only used at test time. As
is common in literature, the size of the UUC dataset
is set to a fifth of the KKCs’ testing set (Hendrycks
et al., 2019c; Liu et al., 2020). In order to cover most
of the variation of the UUC data, the model is tested
with a randomly sampled UUC set for each fold.
For the experiments on OE (subsubsection 4.3.3),
KUCs are also used during training. Identical to the
UUCs, KUCs also compose a fifth of the KKCs’ train-
ing set and are also sampled randomly for each fold.
In addition to the performance on the KUC class, we
will also report the OOD-detection performance on
the two remaining UUCs to assess whether potential
gains on the KUC also generalize to the UUCs.
4.2.2 Evaluation Details
Apart from the proposed joint-performance metric
(subsection 3.2), we also report OOD-detection per-
formance and in-distribution classification perfor-
mance individually. For the OOD-detection per-
formance, we compute the area under the receiver
operating characteristic (ROC) curve (AUROC) of
the binary in-distribution/OOD classification prob-
lem, where in-distribution data is the positive and
OOD data is the negative class. For the in-distribution
classification performance, we compute the macro-
averaged F1-score of the in-distribution test set.
4.2.3 Model Architecture & Evaluated
OOD-detection Methods
For all our experiments, we employ the EfficientNet-
B0 (Tan and Le, 2019) model architecture, which con-
sists of nine levels. Furthermore, we perform trans-
fer learning with an ImageNet(Deng et al., 2009)-
pretrained EfficientNet-B0, as pre-training on large-
Animal Fiber Identification under the Open Set Condition
41

(a) (b)
Figure 3: Iranian cashmere sample before (a) and after (b)
the application of CLAHE.
scale datasets improves model robustness and uncer-
tainty (Hendrycks et al., 2019b). For our proposed
method, we extract features from levels 2, 3, 4, 6 and
9.
We compare our proposed method with the Ma-
halanobis (Maha) score (Lee et al., 2018b), MSP,
ODIN, EBS, MaxLogit and the FSSD. Note that for
Maha, we extract features from the same levels as for
our approach, and give the unweighted mean of level-
wise scores as the overall OOD score.
4.2.4 Image Preprocessing & Training Details
To compensate for inhomogeneities in image contrast
caused by the image acquisition procedure, contrast
limited adaptive histogram equalization (CLAHE)
(Pizer et al., 1987) is applied (refer Figure 3 for a ref-
erence image). Further, the images are normalized
and scaled down to the expected input resolution of
the pre-trained classifier (224 ×224 pixels).
We fine-tune the pre-trained EfficientNet-B0 us-
ing the cross-entropy loss (Goodfellow et al., 2016)
in combination with the Adam optimizer (Kingma
and Ba, 2015), a learning rate of 0.0001 and batch-
size of 16. The training set is used to train the 3-
class classifier, and the validation set is used to de-
tect the best model by calculating the macro-averaged
F1-score over in-distribution data only. Model train-
ing is furthermore stopped when no improvement of
at least 2% is achieved within 10 epochs for the in-
distribution F1-score. Moreover, the validation set is
used to parametrize the OOD-detection methods after
the model has converged (i.e. estimate the joint in-
distribution PDF by means of GMM). The test set is
subsequently used to test model performance.
For experiments that employ OE, we use samples
from the KUC to minimize
L
OE
(φ(x
KUC
)) =log
d
∑
i=1
e
φ
i
(x
KUC
)
−
1
d
d
∑
i=1
φ
i
(x
KUC
)
(6)
in addition to the supervised cross-entropy loss,
which is similar to (Hendrycks et al., 2019c). The
Fold F-score
0.0 96.2
1.0 95.5
2.0 96.4
3.0 95.3
4.0 96.4
µ 96.0
σ 0.5
(a)
C
Y W
C
Y
W
0.95 0.05 0.00
0.05 0.94 0.01
0.02 0.00 0.98
(b)
Figure 4: In-distribution classification performance without
application of OE. (a) shows per-fold F1-scores whereas (b)
shows the corresponding confusion matrix of fold 1.
overall loss for training with OE is thus given as
L = L
CE
(φ(x
KKC
)) +λL
OE
(φ(x
KUC
)). (7)
Based on preliminary experiments, we set λ to 0.5.
4.3 Results
We first compare with state-of-the-art OOD-detection
methods in subsubsection 4.3.1. Afterwards, we per-
form an ablation study to investigate the influence of
the proposed PDF-modeling across feature levels on
joint performance in subsubsection 4.3.2. Next, we
assess influence of OE on open set classification per-
formance in subsubsection 4.3.3.
4.3.1 Natural Fiber Identification Performance
under the Open Set
Table 2 shows that joint performance of the individual
algorithms varies with the axes of biological variation
that needs to be detected as OOD. Here, it can be seen
that our proposed method is best-suited for detecting
modifications incurred by chemical treatments (wool
d&b), making it especially suitable for detecting adul-
teration attempts. Furthermore, our proposed method
performs best and most consistent over all axes of
variation, achieving an AUPR
os,avg
of 91.9 ± 2.1.
Regarding in-distribution classification perfor-
mance, it can be seen that classification rates com-
parable to human raters are achieved with a macro-
averaged in-distribution F1-score of 96.0 ± 0.5. Note
that all methods share the same F1-scores given in
Figure 4a.
Assessing pure OOD-detection performance, it
can be seen that our method again performs the
most consistent across all axes of biological variation,
achieving an AUROC of 84.8 ± 8.4 (Table 3). More-
over, Maha surprisingly performs best with respect
to OOD detection for two of the three UUCs while
VISAPP 2022 - 17th International Conference on Computer Vision Theory and Applications
42
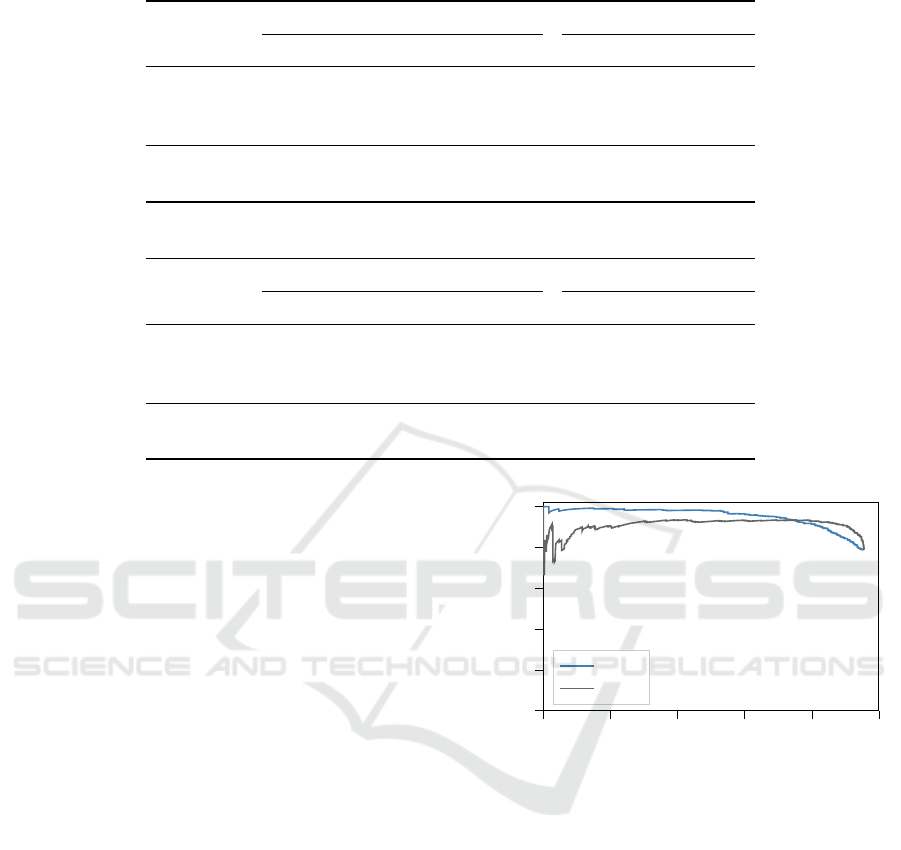
Table 2: AUPR
os,avg
(%) for different UUCs. Best value per row is boldfaced.
prediction-based feature-based
UUC MSP ODIN EBS MaxLogit Maha FSSD Ours
Wool d&b 86.6 85.5 85.5 85.5 90.5 79.9 93.8
Merino 93.0 93.0 93.0 93.1 74.5 74.3 89.7
Silk 93.5 92.2 91.6 91.8 90.3 80.7 92.1
µ 91.0 90.3 90.0 90.1 85.1 78.3 91.9
σ 3.9 4.1 4.0 4.1 9.2 3.5 2.1
Table 3: AUROC (%) for different UUCs. Best value per row is boldfaced.
prediction-based feature-based
UUC MSP ODIN EBS MaxLogit Maha FSSD Ours
Wool d&b 32.4 31.6 31.8 31.8 94.7 35.2 92.8
Merino 82.6 83.4 84.1 84.0 38.6 32.4 76.0
Silk 89.9 84.9 83.4 84.1 96.2 59.1 85.5
µ 68.3 66.6 66.4 66.6 76.5 42.2 84.8
σ 31.3 30.4 30.0 30.2 32.8 14.7 8.4
achieving subpar AUPR
os,avg
values for them (refer
Table 2).
We investigate the reasons behind this next by as-
sessing the class-averaged, open set precision-recall
curve for both Maha and our method on the UUC silk
in Figure 5. Here, it can be seen that the curve of
our proposed method possesses desirable characteris-
tics, as no major dips in precision can be observed for
low recall values, indicating that correctly classified
in-distribution samples of all classes achieve lowest
OOD scores. Conversely, Maha achieves higher pre-
cision & recall values later on, but exhibits dips in
precision for low recall values. In combination with
high OOD-detection performance, this indicates that
lowest OOD scores are assigned to misclassified in-
distribution data. Therefore, it is important to as-
sess the joint-performance of OOD-detection & in-
distribution classification when evaluating classifiers
under the open set condition.
4.3.2 Ablation Study
We perform an ablation experiment to assess the im-
portance of modeling the joint PDF of in-distribution
data across feature levels of a classifier. To this end,
we compare our approach to fitting GMMs to the in-
distribution data in every feature level individually,
giving their average NLL as the overall OOD score.
Assessing results in Table 4, it can be seen that
the proposed joint-modeling boosts OOD-detection
performance measured by AUROC as well as joint
performance as measured by AUPR
os,avg
for all eval-
0.0 0.2 0.4 0.6 0.8 1.0
0.0
0.2
0.4
0.6
0.8
1.0
Recall
Precision
Ours
Maha
Figure 5: PR
os,avg
curve of the proposed OOD-method as
well as Maha. UUC is silk.
uated UUCs. While lower standard deviations are
achieved for the level-wise PDF-estimation, this is ex-
plained by the fact that the improvement of joint PDF-
estimation varies with respect to the chosen UUC
class.
4.3.3 Influence of OE
We assess the influence of OE on natural fiber identi-
fication under the open set condition next. To this end,
we iterate over the three UUCs, using them as KUC
for OE. In addition to OE, we also evaluate a simple
k+1 classifier trained with the KUC as the reject class.
The results in Table 5 show that OE on average
decreases joint performance, as indicated by larger
PR
dist
-values for all methods. In fact, OE does im-
Animal Fiber Identification under the Open Set Condition
43

Table 4: AUROC (%) and AUPR
os,avg
(%) for joint
PDF-estimation across feature levels vs. level-wise PDF-
estimation followed by averaging of level-wise OOD
scores. Best values per metric and row are boldfaced.
UUC
AUROC AUPR
os,avg
level-wise joint level-wise joint
Wool d&b 91.9 92.8 93.3 93.8
Merino 75.4 76.0 89.5 89.7
Silk 83.6 85.5 91.6 92.1
µ 83.6 84.8 91.5 91.9
σ 8.3 8.4 1.9 2.1
Class µ σ
Wool d&b 93.0 1.4
Merino 95.5 1.0
Silk 92.6 1.7
no OE 96.0 0.5
(a)
C
Y W
C
Y
W
0.84 0.16 0.00
0.09 0.90 0.01
0.01 0.02 0.96
(b)
Figure 6: In-distribution classification performance under
application of OE. (a) shows per-fold F1-scores whereas (b)
shows the corresponding confusion matrix of fold 1 with
KUC = Wool d&b.
prove joint performance only for the KUC, and sig-
nificantly reduces the performance for the UUCs not
used for OE. The aforementioned effect is further-
more strongest for the k+1 classifier, and its inverse
can be observed for FSSD.
When investigating the mechanisms underlying
this phenomenon by assessing OOD detection and
in-distribution classification individually, it can be
seen that OE does improve OOD-detection perfor-
mance on average (Table 6) at the cost of a reduced
in-distribution classification performance (Figure 6a).
Moreover, the OOD-detection results improve sub-
stantially only for the KUC class. In fact, they ac-
tually degrade for the UUCs across all assessed al-
gorithms with the exception of Maha. Thus, OOD-
detection improvements achieved by OE for KUCs
do not propagate to UUCs. Coupled with an over-
all decrease in in-distribution classification perfor-
mance, this translates to overall benefits as measured
by PR
dist
only for the KUCs.
5 DISCUSSION
In our work, we have investigated the performance of
natural fiber identification algorithms under the open
set condition. To this end, we identified the three
main axes of variation that classifiers need to be ro-
bust against & set up a dataset that reflects these vari-
ations.
Experiments revealed that the proposed joint
PDF-modeling across feature levels of a CNN per-
forms best overall. Moreover, the obtained in-
distribution classification rates were high enough to
warrant a potential model deployment (>96% agree-
ment with the nominal value is required for human
operators (Zhang and Ainsworth, 2005)). The ab-
lation study in subsubsection 4.3.2 further showed
that the joint PDF-modeling was beneficial for all
UUCs. This shows that consistency of model rep-
resentations is not only predictive of model general-
ization (Natekar and Sharma, 2020), but can further-
more be used to boost OOD-detection performance of
feature-based OOD-detection methods. Note that the
joint modeling across feature levels was also shown to
be beneficial for transfer-learning anomaly detection
(AD), which is concerned with performing OOD de-
tection under the one-class-classification setting (De-
fard et al., 2020).
Moreover, the importance of assessing joint OOD-
detection & in-distribution classification performance
became evident in subsubsection 4.3.1, where Maha
achieved subpar joint performance as measured by
AUPR
os,avg
despite achieving strong OOD-detection
and in-distribution classification results. Therefore,
we argue that one should report joint performance in
future when evaluating algorithms under the open set
condition rather than assessing in-distribution perfor-
mance and OOD-detection performance separately, as
was best practice so far (Liu et al., 2020; Lee et al.,
2018b; Hendrycks and Gimpel, 2017; Liang et al.,
2018). Here, the next step is to expand the proposed
AUPR
os,avg
to the binary classification as well as to
the object detection task.
We also assessed the influence of OE on natural
fiber identification under the open set condition. In-
terestingly, it was found that performance improve-
ments for the KUC used for OE did not propagate to
the UUCs. These results are in line with the find-
ing that a bias is introduced by sampling OOD data
for OE, which may negatively impact OOD-detection
performance of UUCs(Ye et al., 2021). Furthermore,
OE reduced in-distribution classification performance
in our experiments. Therefore, natural fiber identifi-
cation under the open set condition does not benefit
from OE, especially since many UUCs, e.g. adulter-
ation procedures, are present.
VISAPP 2022 - 17th International Conference on Computer Vision Theory and Applications
44

Table 5: PR
dist
(%) for open set classification with OE. µ and σ are calculated over all possible UUC – KUC combinations
(All), over all combinations where UUC ̸= KUC, over all combinations where UUC = KUC and, for comparison, when no
OE is applied.
prediction-based feature-based
MSP ODIN EBS MaxLogit Maha FSSD Ours k+1
OE
All
µ 17.1 17.9 17.9 17.6 15.5 20.0 15.6 14.7
σ 2.1 2.6 3.1 2.9 4.3 3.9 3.6 6.5
UUC = KUC
µ 16.5 17.3 17.0 16.9 15.2 21.4 13.8 6.5
σ 2.4 3.2 3.4 3.2 3.3 1.8 3.5 0.3
UUC ̸= KUC
µ 17.3 18.1 18.3 18.0 15.6 19.2 16.5 18.8
σ 1.8 2.5 2.7 2.6 4.8 4.5 3.6 2.8
No OE
µ 14.5 15.7 16.2 15.9 13.8 17.9 15.0 —
σ 0.5 1.9 3.0 2.6 4.7 3.1 2.9 —
Table 6: AUROC (%) for OOD-detection with OE. µ and σ are calculated over all possible UUC – KUC combinations (All),
over all combinations where UUC ̸= KUC, over all combinations where UUC = KUC and, for comparison, when no OE is
applied.
prediction-based feature-based
MSP ODIN EBS MaxLogit Maha FSSD Ours
OE
All
µ 70.7 69.9 69.8 70.4 82.5 43.5 87.1
σ 21.4 20.7 20.9 20.8 24.3 21.8 13.3
UUC = KUC
µ 79.0 80.5 82.2 81.7 90.8 50.1 94.0
σ 17.8 14.9 14.3 14.9 8.7 25.2 5.5
UUC ̸= KUC
µ 66.5 64.6 63.7 64.7 78.4 40.2 83.7
σ 22.0 21.2 21.0 21.1 29.0 18.4 15.1
No OE
µ 68.3 66.6 66.4 66.6 76.5 42.2 84.8
σ 31.3 30.4 30.0 30.2 32.8 14.7 8.4
5.1 Limitations
While, to the best of our knowledge, we have used
the largest and most diverse dataset so far, human op-
erators are capable of distinguishing between at least
11 fiber types (10 specialty fibers + wool) (Interna-
tional Wool Textile Organisation, 2000). We will
therefore expand the dataset, focussing on covering as
many fiber types from as diverse sources as possible.
Moreover, while our proposed method performed best
overall, it did not achieve highest values for every sin-
gle UUC. In fact, the best performance for two of the
three UUCs was achieved by methods that are based
on the classifier’s unnormalized predictions (refer Ta-
ble 2). In our future work, we will therefore develop
OOD-detection methods that leverage both interme-
diate feature representations as well as the classifier’s
output. Last, we did not assess the performance of the
model when distribution shifts occur for the KKCs.
Ideally, the classifier would be robust to this under
the open set condition, i.e. it would accept & cor-
rectly classify KKCs which have undergone input-
distribution shifts rather than rejecting them. This
would require the OOD-detection method to assign
lower OOD scores to KKCs that have undergone dis-
tribution shifts compared to UUCs. Advances from
the field of domain adaptation can be used as a start-
ing point here (Saito and Saenko, 2021; Bashkirova
et al., 2021).
6 CONCLUSION
In our work, we have thoroughly investigated the per-
formance of natural fiber identification algorithms un-
der the open set condition. To this end, we identified
the three main axes of variation that natural fiber iden-
tification algorithms need to be robust against, and
have created a dataset that is able to reflect them. Our
experiments revealed that the proposed joint PDF-
modeling across feature levels of a CNN performs
best, achieving highest AUPR
os,avg
amongst all eval-
uated methods. Furthermore, we demonstrated that
metrics of joint performance are necessary to fully re-
Animal Fiber Identification under the Open Set Condition
45

capitulate the behavior of a classifier under the open
set condition. Our work thus shows that natural fiber
identification algorithms provide promising results in
real-world scenarios, i.e. under the open set condition.
Our future work will focus on improving the OOD-
detection performance and investigating the behav-
ior of the classifier when simultaneously challenged
with distribution shifts of KKCs and OOD-detection
of UUCs.
ACKNOWLEDGEMENTS
This work was supported by the German Federation
of Industrial Research Associations (AiF) under the
grant number 21376 N.
REFERENCES
Ahuja, N. A., Ndiour, I., Kalyanpur, T., and Tickoo, O.
(2019). Probabilistic modeling of deep features for
out-of-distribution and adversarial detection. arXiv
preprint arXiv:1909.11786.
American Society for Testing and Materials (1993). Stan-
dard methods for quantitative analysis of textiles,
method d629-88.
Bashkirova, D., Hendrycks, D., Kim, D., Mishra, S.,
Saenko, K., Saito, K., Teterwak, P., and Usman,
B. (2021). Visda-2021 competition universal do-
main adaptation to improve performance on out-of-
distribution data. arXiv preprint arXiv:2107.11011.
Bishop, C. (2006). Pattern Recognition and Machine
Learning. Springer.
Blum, H., Sarlin, P.-E., Nieto, J., Siegwart, R., and Cadena,
C. (2021). The fishyscapes benchmark: Measuring
blind spots in semantic segmentation. International
Journal of Computer Vision, 129(11):3119–3135.
Council of European Union (2011). Council regulation
(EU) no 1007/2011.
Davis, J. and Goadrich, M. (2006). The relationship be-
tween precision-recall and roc curves. In Proceed-
ings of the 23rd international conference on Machine
learning, pages 233–240.
Defard, T., Setkov, A., Loesch, A., and Audigier, R. (2020).
Padim: a patch distribution modeling framework for
anomaly detection and localization. arXiv preprint
arXiv:2011.08785.
Deng, J., Dong, W., Socher, R., Li, L., Li, K., and Fei-Fei,
L. (2009). ImageNet: A large-scale hierarchical im-
age database. In 2009 IEEE Conference on Computer
Vision and Pattern Recognition, pages 248–255.
Freer, R. E. (1946). The wool products labeling act of 1939.
Temp. LQ, 20:42.
Geng, C., Huang, S.-J., and Chen, S. (2020). Recent ad-
vances in open set recognition: A survey. IEEE Trans-
actions on Pattern Analysis and Machine Intelligence,
pages 1–1.
Goodfellow, I., Bengio, Y., and Courville, A. (2016). Deep
learning. MIT press.
Grci
´
c., M., Bevandi
´
c., P., and Segvi
´
c., S. (2021). Dense
open-set recognition with synthetic outliers generated
by real nvp. In Proceedings of the 16th Interna-
tional Joint Conference on Computer Vision, Imag-
ing and Computer Graphics Theory and Applications
- Volume 4: VISAPP,, pages 133–143. INSTICC,
SciTePress.
Hendrycks, D., Basart, S., Mazeika, M., Mostajabi, M.,
Steinhardt, J., and Song, D. (2019a). Scaling out-of-
distribution detection for real-world settings. arXiv
preprint arXiv:1911.11132.
Hendrycks, D. and Gimpel, K. (2017). A baseline for de-
tecting misclassified and out-of-distribution examples
in neural networks. In 5th International Conference
on Learning Representations, ICLR 2017, Toulon,
France, April 24-26, 2017, Conference Track Pro-
ceedings. OpenReview.net.
Hendrycks, D., Lee, K., and Mazeika, M. (2019b). Us-
ing pre-training can improve model robustness and
uncertainty. In International Conference on Machine
Learning, pages 2712–2721. PMLR.
Hendrycks, D., Mazeika, M., and Dietterich, T. (2019c).
Deep anomaly detection with outlier exposure. In In-
ternational Conference on Learning Representations.
Huang, H., Li, Z., Wang, L., Chen, S., Dong, B.,
and Zhou, X. (2020). Feature space singular-
ity for out-of-distribution detection. arXiv preprint
arXiv:2011.14654.
International Wool Textile Organisation (2000). Test
method no. iwto-58-00: Scanning electron micro-
scopic analysis of speciality fibres and sheep’s wool
and their blends.
International Wool Textile Organisation (2018). Statistics
for the global wool production and textile industry,.
Kamoi, R. and Kobayashi, K. (2020). Why is the ma-
halanobis distance effective for anomaly detection?
arXiv preprint arXiv:2003.00402.
Kim, Y., Kim, T., and Choi, H.-M. (2013). Qualita-
tive identification of cashmere and yak fibers by pro-
tein fingerprint analysis using matrix-assisted laser
desorption/ionization time-of-flight mass spectrome-
try. Industrial & Engineering Chemistry Research,
52(16):5563–5571.
Kingma, D. P. and Ba, J. (2015). Adam: A method for
stochastic optimization. In Bengio, Y. and LeCun,
Y., editors, 3rd International Conference on Learn-
ing Representations, ICLR 2015, San Diego, CA, USA,
May 7-9, 2015, Conference Track Proceedings.
Kirichenko, P., Izmailov, P., and Wilson, A. G. (2020). Why
normalizing flows fail to detect out-of-distribution
data. In Larochelle, H., Ranzato, M., Hadsell, R.,
Balcan, M. F., and Lin, H., editors, Advances in Neu-
ral Information Processing Systems, volume 33, pages
20578–20589. Curran Associates, Inc.
Lee, K., Lee, H., Lee, K., and Shin, J. (2018a). Training
confidence-calibrated classifiers for detecting out-of-
distribution samples. In International Conference on
Learning Representations.
Lee, K., Lee, K., Lee, H., and Shin, J. (2018b). A simple
unified framework for detecting out-of-distribution
samples and adversarial attacks. In Advances in
VISAPP 2022 - 17th International Conference on Computer Vision Theory and Applications
46

Neural Information Processing Systems, pages 7167–
7177.
Liang, S., Li, Y., and Srikant, R. (2018). Enhancing the reli-
ability of out-of-distribution image detection in neural
networks. In International Conference on Learning
Representations.
Liu, W., Wang, X., Owens, J., and Li, S. Y. (2020). Energy-
based out-of-distribution detection. Advances in Neu-
ral Information Processing Systems, 33.
McGregor, B. A. (2018). 4 - physical, chemical, and tensile
properties of cashmere, mohair, alpaca, and other rare
animal fibers. In Bunsell, A. R., editor, Handbook
of Properties of Textile and Technical Fibres (Second
Edition), The Textile Institute Book Series, pages 105
– 136. Woodhead Publishing, second edition edition.
Mendes J
´
unior, P. R., de Souza, R. M., Werneck, R. d. O.,
Stein, B. V., Pazinato, D. V., de Almeida, W. R., Pe-
natti, O. A. B., Torres, R. d. S., and Rocha, A. (2017).
Nearest neighbors distance ratio open-set classifier.
Machine Learning, 106(3):359–386.
Natekar, P. and Sharma, M. (2020). Representation based
complexity measures for predicting generalization in
deep learning. arXiv preprint arXiv:2012.02775.
Neal, L., Olson, M., Fern, X., Wong, W.-K., and Li, F.
(2018). Open set learning with counterfactual images.
In Proceedings of the European Conference on Com-
puter Vision (ECCV).
Nguyen, A., Yosinski, J., and Clune, J. (2015). Deep neural
networks are easily fooled: High confidence predic-
tions for unrecognizable images. In Proceedings of
the IEEE conference on computer vision and pattern
recognition, pages 427–436.
Oza, P. and Patel, V. M. (2019). C2ae: Class conditioned
auto-encoder for open-set recognition. In Proceedings
of the IEEE/CVF Conference on Computer Vision and
Pattern Recognition (CVPR).
Phan, K.-H. and Wortmann, F. (2001). Quality assessment
of goat hair for textile use. In Silk, Mohair, Cashmere
and Other Luxury Fibres, pages 227–233. Elsevier.
Pizer, S. M., Amburn, E. P., Austin, J. D., Cromartie, R.,
Geselowitz, A., Greer, T., ter Haar Romeny, B., Zim-
merman, J. B., and Zuiderveld, K. (1987). Adaptive
histogram equalization and its variations. Computer
vision, graphics, and image processing, 39(3):355–
368.
Rane, P. P. and Barve, S. (2011). Standardization and op-
timization of mtdna isolation and molecular genetic
analysis of d-loop region in animal natural fibres. In-
ternational Journal of Zoological Research, 7(2):190.
Rippel, O., Bilitewski, N., Rahimi, K., Kurniadi, J., Her-
rmann, A., and Merhof, D. (2021a). Identifying pris-
tine and processed animal fibers using machine learn-
ing. In 2021 IEEE International Instrumentation and
Measurement Technology Conference (I2MTC), pages
1–6.
Rippel, O., Mertens, P., and Merhof, D. (2021b). Model-
ing the distribution of normal data in pre-trained deep
features for anomaly detection. In 2020 25th Inter-
national Conference on Pattern Recognition (ICPR),
pages 6726–6733.
Robson, D. (1997). Animal fiber analysis using imaging
techniques: Part i: Scale pattern data. Textile Research
Journal, 67(10):747–752.
Robson, D. (2000). Animal fiber analysis using imaging
techniques: Part ii: Addition of scale height data. Tex-
tile Research Journal, 70(2):116–120.
Saito, K. and Saenko, K. (2021). Ovanet: One-vs-all net-
work for universal domain adaptation. arXiv preprint
arXiv:2104.03344.
Sun, X., Yang, Z., Zhang, C., Ling, K.-V., and Peng, G.
(2020). Conditional gaussian distribution learning for
open set recognition. In Proceedings of the IEEE/CVF
Conference on Computer Vision and Pattern Recogni-
tion (CVPR).
Tan, M. and Le, Q. V. (2019). EfficientNet: Rethinking
model scaling for convolutional neural networks. In
Chaudhuri, K. and Salakhutdinov, R., editors, Pro-
ceedings of the 36th International Conference on Ma-
chine Learning, ICML 2019, 9-15 June 2019, Long
Beach, California, USA, volume 97 of Proceedings
of Machine Learning Research, pages 6105–6114.
PMLR.
Waldron, S., Brown, C., and Komarek, A. M. (2014). The
chinese cashmere industry: a global value chain anal-
ysis. Development Policy Review, 32(5):589–610.
Wortmann, F.-J. (1991). Quantitative fiber mixture analy-
sis by scanning electron microscopy: Part iii: Round
trial results on mohair / wool blends. Textile Research
Journal, 61(7):371–374.
Wortmann, F.-J. and Wortmann, G. (1992). Quantita-
tive fiber mixture analysis by scanning electron mi-
croscopy: Part iv: Assessment of light microscopy as
an alternative tool for analyzing wool/specialty fiber
blends. Textile Research Journal, 62(7):423–431.
Xing, W., Liu, Y., Deng, N., Xin, B., Wang, W., and Chen,
Y. (2020a). Automatic identification of cashmere and
wool fibers based on the morphological features anal-
ysis. Micron, 128:102768.
Xing, W., Liu, Y., Xin, B., Zang, L., and Deng, N. (2020b).
The application of deep and transfer learning for iden-
tifying cashmere and wool fibers. Journal of Natural
Fibers, 0(0):1–17.
Ye, Z., Chen, Y., and Zheng, H. (2021). Understanding
the effect of bias in deep anomaly detection. arXiv
preprint arXiv:2105.07346.
Yildiz, K. (2020). Identification of wool and mohair fibres
with texture feature extraction and deep learning. IET
Image Processing, 14(2):348–353.
Zhang, H., Li, A., Guo, J., and Guo, Y. (2020). Hybrid mod-
els for open set recognition. In Vedaldi, A., Bischof,
H., Brox, T., and Frahm, J.-M., editors, Computer Vi-
sion - ECCV 2020, pages 102–117, Cham. Springer
International Publishing.
Zhang, L. and Ainsworth, W. (2005). Microscope analysis
of animal fiber blends - training of operators. Techni-
cal report.
Zisselman, E. and Tamar, A. (2020). Deep residual flow
for out of distribution detection. In Proceedings of
the IEEE/CVF Conference on Computer Vision and
Pattern Recognition (CVPR).
Zoccola, M., Lu, N., Mossotti, R., Innocenti, R., and Mon-
tarsolo, A. (2013). Identification of wool, cashmere,
yak, and angora rabbit fibers and quantitative deter-
mination of wool and cashmere in blend: a near
infrared spectroscopy study. Fibers and Polymers,
14(8):1283–1289.
Animal Fiber Identification under the Open Set Condition
47
