
Generative Adversarial Network for the Segmentation of
Ground Glass Opacities and Consolidations from Lung CT Images
Xiaochen Wang and Natalia Khuri
a
Department of Computer Science, Wake Forest University, 1834 Wake Forest Road, Winston-Salem, U.S.A.
Keywords:
COVID-19, Deep Learning, Generative Adversarial Network, Image Segmentation.
Abstract:
The coronavirus disease 2019 is a global pandemic that threatens lives of many people and poses a significant
burden for healthcare systems worldwide. Computerized Tomography can detect lung infections, especially
in asymptomatic cases, and the detection process can be aided by deep learning. Most of the recent research
focused on the segmentation of the entire infected region in a lung. To automate a more fine-grained analy-
sis, a generative adversarial network, comprising two convolutional neural networks, was developed for the
segmentation of ground glass opacities and consolidations from tomographic images. The first convolutional
neural network acts as a generator of segmented masks, and the second as a discriminator of real and artificially
segmented objects, respectively. Experimental results demonstrate that the proposed network outperforms the
baseline U-Net segmentation model on the benchmark data set of 929 publicly available images. The dice
similarity coefficients of segmenting ground glass opacities and consolidations are 0.664 and 0.625, respec-
tively.
1 INTRODUCTION
In December 2019, a novel coronavirus, named coro-
navirus disease 2019 (COVID-19), was first reported
in Wuhan, China, rapidly spreading to other countries.
COVID-19 is a contagious respiratory disease that can
cause severe illness, death or long-term health com-
plications. Therefore, it is important to accurately
detect the disease at an early stage, and immediately
isolate the infected person from the healthy popula-
tion (Ai et al., 2020).
Among the diagnostic methods of COVID-19,
Computerized Tomography (CT) has a high sensi-
tivity (97%) in diagnosing COVID-19 pneumonia (Ai
et al., 2020). In addition to disease detection, lung CT
can identify specific radiological features in most pa-
tients with COVID-19 (Zhou et al., 2020). These fea-
tures can be divided into two main categories: ground
glass opacity (GGO), which is the hazy area that does
not obscure the underlying structures of a lung, and
consolidation, which is the opacity that obscures the
bronchial and vascular structure of a lung (Kobayashi
and Mitsudomi, 2013). These features are also visible
in CT images of COVID-19 patients with negative
RT-PCR results. Remarkably, as COVID-19 disease
a
https://orcid.org/0000-0001-9031-8124
progresses, GGOs become more diffused and often
turn into consolidations (Zhou et al., 2020). On the
other hand, as patients recover, consolidation areas re-
solve.
From the early days of COVID-19 outbreak,
computer vision algorithms, including deep learning
(DL), have been extensively tested for the detection
of COVID-19 infection in CT images. While some
methods achieved reasonably high accuracy in cross-
validation experiments, most of them focused on the
segmentation of the entire infection region. This li-
mits their utility for the assessment of the severity of
pneumonia and for the monitoring of the recovery.
Given the detectable radiological features of
COVID-19 infection, we aimed to design, imple-
ment and train a neural network to segment GGOs
and consolidations from lung CT scans, separately.
That means that we aimed to partition CT scan im-
ages into four distinct regions, namely, background,
GGOs, consolidations and other lung tissues. Specif-
ically, we proposed a generative adversarial network,
based on the U-Net backbone architecture, and dif-
ferent from previously reported DL models. We com-
pared it with four other segmentation models. In com-
putational experiments, the proposed network outper-
formed less complex DL models, justifying its com-
plexity and increased training time. Additionally, the
Wang, X. and Khuri, N.
Generative Adversarial Network for the Segmentation of Ground Glass Opacities and Consolidations from Lung CT Images.
DOI: 10.5220/0010776800003123
In Proceedings of the 15th International Joint Conference on Biomedical Engineering Systems and Technologies (BIOSTEC 2022) - Volume 3: BIOINFORMATICS, pages 27-37
ISBN: 978-989-758-552-4; ISSN: 2184-4305
Copyright
c
2022 by SCITEPRESS – Science and Technology Publications, Lda. All rights reserved
27

proposed network had a better performance than the
baseline U-Net model, on the benchmark of 929 CT
images, and performed on par with the state-of-the
art, albeit a more complex, segmentation model.
In an effort to generate reproducible results, and
unlike prior works, we partitioned the benchmark data
set of 929 CT scans into training, validation and test
subsets by taking into consideration distributions of
the GGOs and consolidations in CT images. Thus,
we established a more domain-specific and realistic
benchmark for the assessment of future classification
models.
Finally, our research has broader application in
medical image processing than the segmentation of
GGOs and consolidations. The proposed model can
be repurposed to other application domains, where re-
gions of interest have hazy boundaries and undergo
temporal changes.
The remainder of the article is organized as fol-
lows. Section 2 reviews relevant prior work. Our
proposed model and data set are described in Sec-
tion 3. Section 4 presents results of computational
validation of the proposed model and of its compari-
son with other DL architectures, including a recently
published state-of-the art model. We conclude the pa-
per and propose a direction for future work in Sec-
tion 5.
2 PRIOR AND RELEVANT WORK
Due to the great importance to public health, an abun-
dant volume of computer vision works has been pub-
lished since the beginning of the COVID-19 out-
break. At the time of writing, in the year 2021 alone,
over 183 research publications devoted to medical
imaging in COVID-19 disease, were deposited in the
PubMed database at the United States National Li-
brary of Medicine, varying in their application do-
main, methods and validation. Likewise, the num-
ber of preprint articles deposited to an open-access
arXiv server was 338. Because preprints are not peer-
reviewed, we limited our discussion of prior and rele-
vant works to published manuscripts only.
Overall, relevant publications about applications
of computer vision for COVID-19 can be divided
into three broad categories, namely medical image ac-
quisition, image segmentation and classification (Shi
et al., 2021). Our work falls into the category of ima-
ge segmentation. Its purpose is to extract critical in-
formation about the shapes and volumes of regions
of interest, which helps in the diagnosis, monitoring
and treatment of diseases. An important step of medi-
cal image segmentation is the selection of informa-
tive, discriminating, and independent features (i.e.,
measurable properties or characteristics of an image).
Features can be manually extracted (O’Mahony et al.,
2019) or they can be automatically discovered using
neural networks by processing images via several dif-
ferent layers (Hesamian et al., 2019).
Applications of medical image segmentation can
be further subdivided into two subtasks. The most
common application is COVID-19 diagnosis, such as
the detection of infection in lung CT scans (Wang
et al., 2021). A more challenging segmentation task
involves not only the detection of infections in the
lungs but also their separation into COVID-19 and
influenza disease, for example (Li et al., 2020). Fi-
nally, segmented regions of interest can be used in
the quantification task, which provides valuable infor-
mation for the monitoring of disease progression over
time (Cao et al., 2020; Yue et al., 2020; Shan et al.,
2021).
Image segmentation tasks differ in the regions of
interest. Some applications aim to segment from CT
scans, the whole lung, while others aim to segment
the infected regions only. In this work, we extend the
latter task into the segmentation of two types of in-
fected regions separately. Specifically, we aim to seg-
ment GGOs and consolidations as two different infec-
tion regions, with an overarching aim of incorporating
the proposed model into future quantification applica-
tions.
On the technology side, due to their prior success
in medical image segmentation, DL methods domnate
prior works. DL networks do not require human in-
tervention to guide the segmentation process. Instead,
these technologies process images via several dif-
ferent layers, automatically extracting latent features
from images (Hesamian et al., 2019). The vast ma-
jority of available DL models used in COVID-19 ap-
plications adopt the U-Net architecture as their start-
ing backbone (Zheng et al., 2020; Cao et al., 2020;
Huang et al., 2020; Yue et al., 2020). The U-Net ar-
chitecture builds upon a fully convolutional network
(FCN), which in turn, is based on a convolutional neu-
ral network (CNN).
CNN is a classical type of a DL architecture,
where convolutional layers are the major building
blocks (LeCun et al., 2015). Convolution is a li-
near operation that multiplies a filter (i.e., a matrix
of weights) and the input data. Application of con-
volution operations over the pixels of an input image
results in the extraction of low-level features. Con-
volutions that operate on the outputs of the preceding
convolutional layers can combine these low-level fea-
tures into new ones. Therefore, stacking the layers in
a deep CNN architecture, decomposes an image hier-
BIOINFORMATICS 2022 - 13th International Conference on Bioinformatics Models, Methods and Algorithms
28

archically and generates its new representation (Zeiler
and Fergus, 2014).
FCN performs a feed-forward computation and
a back-propagation over the full-sized image (Long
et al., 2015). This architecture replaces the last fully
connected layer of a CNN classifier with a convolu-
tional layer. It then adds three deconvolution layers
to rebuild the original image. In the deconvolution
operation, each neuron in the input layer is a scalar
value. It gives weights to each element in the filters,
and thus, the output layers are the weighted copies
of the filters. Thus, the deconvolution layers enlarge
the output of the CNN to the same size as the input
image. However, the predicted output may be coarse
and may lose the detailed structures of the region of
interest (Noh et al., 2015).
This shortcoming of the FCN is addressed in the
U-Net architecture (Ronneberger et al., 2015). U-Net
consists of a contracting path and an expansive path,
forming a U-shaped topology. The contracting path
is a CNN that consists of repeated convolution lay-
ers, which reduce the spatial dimensions of the image
while increasing the channel sizes. Therefore, a com-
pressed representation of the original image is pro-
duced along this path of the network. The expansive
path, more or less symmetric to the contracting path,
is used to enlarge the compressed representation of
the input image to its original size through a sequence
of deconvolutions. This network concatenates layers
in the expansive path with the layers of an equal re-
solution in the contracting path. The concatenations
help with the improvement of the segmentation for
two reasons. First, they recover the spatial informa-
tion that was lost during down-sampling in the con-
tracting path, thus providing essential high-resolution
features to the deconvolution layers (Drozdzal et al.,
2016). Second, they allow faster convergence during
the training process, reducing the time needed to train
the model (Szegedy et al., 2017).
Among prior works, those most relevant to ours,
address the following three challenges of image seg-
mentation. The challenges are (1) the extraction of
most relevant features of two infected regions (GGOs
and consolidations), (2) training of the models with
images that are noisy or of poor quality and (3) train-
ing with small data sets.
Using U-Net as a starting point, a multi-scale dis-
criminative network (MSD-Net) was proposed, which
uses an encoder-decoder framework and the pre-
trained ResNet-101 (Zheng et al., 2020). The net-
work has four stages of convolutions, i.e., it performs
max pooling three times. The output layers of each
stage are inputted into a sequence of blocks, replacing
the original concatenations between the encoder and
decoder parts in the U-Net. The sequence of blocks
include a pyramid convolution block (PCB), a chan-
nel attention block (CAB), and a residual refinement
block (RRB). PCB applies filters of various sizes to
the input activation maps and concatenates the out-
put layers. Jointly, these blocks help detect regions
of interest of different sizes. CAB concatenates the
output of two adjacent PCBs and applies an average
pooling to the concatenated layers. Its purpose is to
make the model learn and better focus on the im-
portant information, rather than on learning nonuse-
ful background. RRB uses the concept of the resi-
dual learning (Szegedy et al., 2017). It concatenates
the convolutional layers with the input layers at each
stage to retain information while aiming to refine the
boundary of segmented regions. MSD-Net was vali-
dated on the data set of 2,506 COVID-19 CT images
and 2,274 normal CT images. The dice similarity co-
efficient (DSC) of segmenting GGOs and consolida-
tions were 0.742 and 0.877, respectively. Unfortu-
nately, neither the data set nor the trained model have
been released, thus, making direct comparison with
other methods impossible.
Noting that not all latent features derived by the U-
Net encoders may be useful for the segmentation task,
an attention mechanism was added to U-Net, to better
capture features and improve the segmentation per-
formance (Zhou et al., 2021). The attention mecha-
nism updates network weights to account for spatial
and channel dependencies of image features, resulting
in better segmentation of smaller regions of infected
lungs. Further improvements of an attention-based
U-Net were also reported for models with a dual at-
tention strategy and dilated convolutions (Zhao et al.,
2021; Xie et al., 2021; Rajamani et al., 2021).
To address image quality issues, such as the inten-
sity in-homogeneity, presence of artifacts, and close-
ness in the gray levels of different soft tissues, two
image contrast enhancement functions were devel-
oped, an exponential function and a logarithmic func-
tion. These functions control the proper luminance
level, thus enhancing local contrast within the CT im-
ages (Oulefki et al., 2020). Additionally, noting that
the accuracy of image segmentation is hindered by the
poorly defined boundaries of GGOs and consolida-
tions, in particular as they undergo temporal changes,
the U-Net backbone was enhanced with a receptive-
field-aware module. The module includes convolu-
tional layers to extract features, dilated convolutional
layers to enlarge the receptive field, and an attention
mechanism to capture features that are most relevant
to COVID-19 infection (Kumar Singh et al., 2021).
In addition to relevant features, accuracy of DL
models depends on the size of the data set of anno-
Generative Adversarial Network for the Segmentation of Ground Glass Opacities and Consolidations from Lung CT Images
29
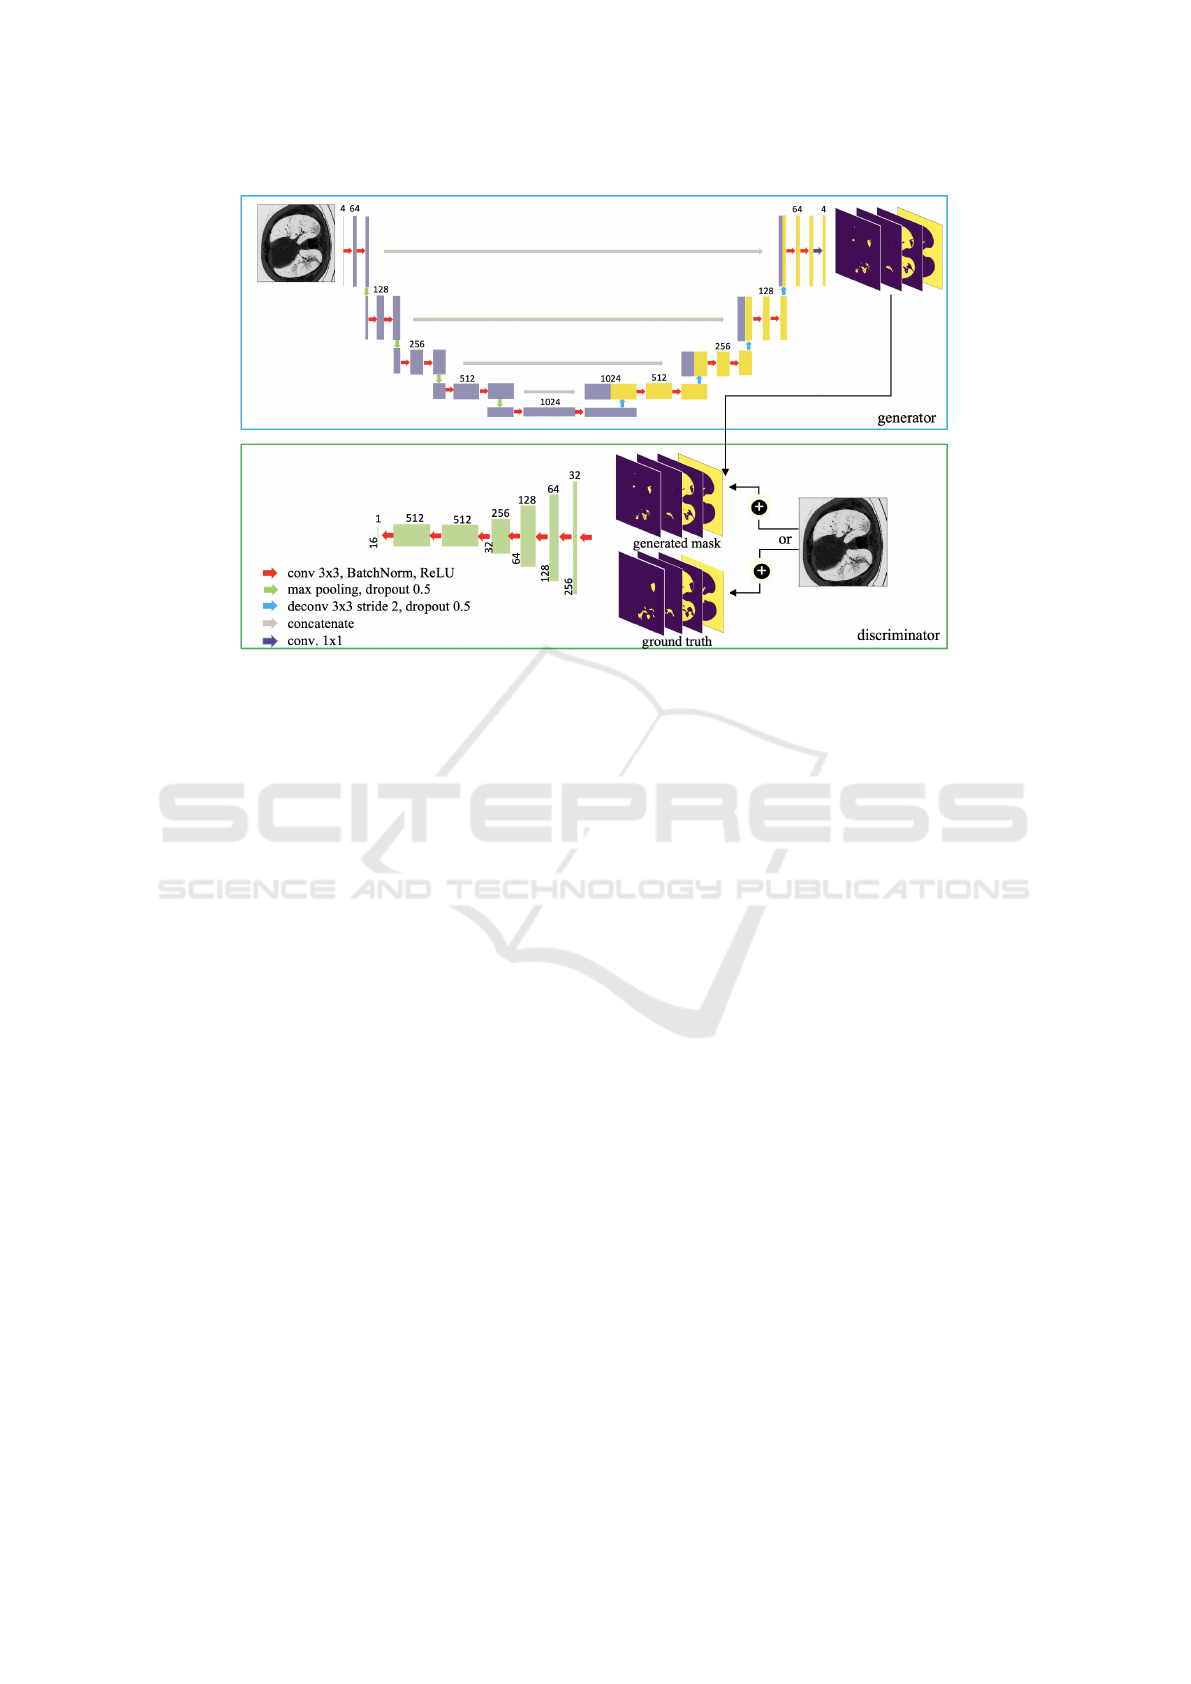
Figure 1: Overall architecture of the proposed generative adversarial network. The generator (top) is an encoder-decoder
architecture, and the discriminator (bottom) is a CNN that distinguishes artificially generated masks from the original image
masks.
tated medical images. Despite several efforts to col-
lect and annotate public data sets of COVID-19 CT
images (Trivizakis et al., 2020), most of the avail-
able data sets remain small in size. To ameliorate
the problem of insufficient training data, a few-shot
U-Net was developed (Wu et al., 2021). The few-
shot learning in the U-Net architecture allows to dy-
namically tune network weights upon the presentation
of new input images, resulting in the improvements
of the segmentation accuracy. A different approach
to overcome issues of training with limited data, in-
volves the synthesis of artificial images, which can
be used for data augmentation. For example, a gen-
erative model, called CoSinGAN, was tested in the
synthesis of high-resolution radiological images that
match real lung and infected regions (Zhang et al.,
2020). The model synthesizes new data using a single
real image as an input, and it is derived from a class of
neural networks, known as the Generative Adversarial
Networks (GANs), inspired by a two-player min-max
game (Goodfellow et al., 2014).
Several shortcomings still remain in prior works.
First, prior research mostly focused on the segmen-
tation of an entire infected region rather than distin-
guishing between GGOs and consolidations. This
limits the applicability of such models in the assess-
ment of COVID-19 progression and recovery. Sec-
ond, several prior methods incorporated specialized
feature extraction and image enhancements to im-
prove the performance and to overcome the problem
of low intensity contrast between infected and healthy
lung tissues. This, in turn, increases the complexity of
the segmentation networks and can reduce their ge-
neralizability to new data because functions for im-
age enhancement are derived from a very small sam-
ple of CT images. Lastly, direct comparison between
published methods remains difficult due to the lack of
annotated and publicly available benchmark data sets,
trained models and the software code.
In this work, we aimed to address the problems
of training with the small data set and feature ex-
traction, by incorporating the U-Net backbone into
a GAN framework, differently from prior models.
GAN models have been mostly used for data augmen-
tation in COVID-19 imaging (Goel et al., 2021; Zhu
et al., 2021; Jiang et al., 2020) rather than for im-
age segmentation. A typical GAN architecture con-
sists of two parts, a generator producing the output
that is close to the real samples, and a discrimina-
tor attempting to distinguish between real and gener-
ated data samples. Our GAN model performs seg-
mentation tasks via adjustments to the output of a
generator. Instead of producing new, synthetic data
that imitate the original images, the generator outputs
segmentation masks of four different types, namely
GGOs, consolidations, background and other lung tis-
sues. The discriminative network plays an adversar-
ial role in distinguishing the generated segmentation
masks from the ground truth, smoothing the boundary
curves of segmented objects (Luc et al., 2016).
BIOINFORMATICS 2022 - 13th International Conference on Bioinformatics Models, Methods and Algorithms
30

Table 1: Summary of the parameters and blocks of the encoder, corresponding to the contracting path of the generator model.
Block Layer description Number of filters Dimension Size
Convolutional + ReLU + BN 64 512 3 × 3
B1 Convolutional + ReLU + BN 64 512 3 × 3
Max pooling + Dropout - 256 2 × 2
Convolutional + ReLU + BN 128 256 3 × 3
B2 Convolutional + ReLU + BN 128 256 3 × 3
Max pooling + Dropout - 128 2 × 2
Convolutional + ReLU + BN 256 128 3 × 3
B3 Convolutional + ReLU + BN 256 128 3 × 3
Max pooling + Dropout - 64 2 × 2
Convolutional + ReLU + BN 512 64 3 × 3
B4 Convolutional + ReLU + BN 512 64 3 × 3
Max pooling + Dropout - 32 2 × 2
Convolutional + ReLU + BN 1024 32 3 × 3
B5 Convolutional + ReLU + BN 1024 32 3 × 3
3 DATA AND METHODS
Our proposed segmentation network takes CT images
as input, and classifies their pixels into four mutually
exclusive labels: GGOs, consolidations, other lung
tissues, and background. More specifically, the seg-
mentation network outputs a 512 × 512 layer with 4
channels. The channels indicate the probability of ev-
ery label, and the label with highest probability is as-
signed to that pixel.
To compare and evaluate the improvements due to
the increased complexity of the proposed model, we
also implemented two simpler DL networks, namely,
a feed-forward neural network (FFNN) and a FCN.
The architectures and parameters of these FFNN and
FCN models were determined experimentally. Addi-
tionally, we experimentally compared our proposed
model to the baseline U-Net model. All models were
trained and tested in the same computing environment
using the same training, validation and test data sets.
3.1 Proposed Segmentation Model
The proposed network comprises two integrated end-
to-end modules (Figure 1). We implemented a net-
work that generates image masks representative of the
four exclusive classes, and a discriminative network
for the correction of the wrong predictions made by
the encoder-decoder network.
The generator has a fully convolutional structure
with symmetric contracting and expansive paths, si-
milar to the U-Net architecture (Ronneberger et al.,
2015). In the contracting path of the generator struc-
ture (Table 1), our encoder comprises five convolu-
tional blocks, where each block consists of two con-
volutional layers with a 3 × 3 kernel size. Except for
the last block, every block also includes a max pool-
ing layer of size 2 × 2, to reduce image dimension by
half, and a dropout layer with a rate of 0.5 to avoid
over-fitting. The rectified linear unit (ReLU) layers
and batch normalization (BN) layers are used in all
convolutional layers to prevent vanishing gradients.
In the expansive path of the generator (Table 2),
the decoder reconstructs the output of the encoder
to the same size as the input image. We use four
3× 3 deconvolutional layers with stride 2, which dou-
ble the dimensions of layers each time. We also use
U-Net’s skip connections to concatenate the corre-
sponding layers in the encoder and the decoder, and
to recover the information loss that occurs during max
pooling. The concatenated results are inputted into
two consecutive convolutional layers, as well as into
an ReLU layer and a BN layer.
The discriminative network is a CNN model that
outputs an N × N × 1 patch (Table 3). We use convo-
lutional layers with kernel sizes of k × k and a stride
of 2, to reduce the dimensions of input layers by half.
The patch (N) and kernel (k) sizes were determined
by experimentation (Section 4). Each convolutional
layer is followed by a BN layer and a leaky ReLU
layer. The sigmoid function labels each neuron in the
output layer as either real (1) or artificial (0).
To train the discriminator, either a predicted mask
or a ground truth mask is randomly chosen and con-
catenated with the original image. Then, the concate-
nated result is inputted to the discriminator’s CNN,
which determines whether it is a predicted mask or a
ground truth mask.
Generative Adversarial Network for the Segmentation of Ground Glass Opacities and Consolidations from Lung CT Images
31
Table 2: Summary of parameters and blocks of the decoder, corresponding to the expansive path of the generator.
Block Layer description Number of filters Dimension Kernel size Stride
Deconvolution 512 64 3 × 3 2
Concatenate with output of B4 - 64 - -
B6 Dropout - 64 - -
Convolutional + ReLU + BN 512 64 3 × 3 1
Convolutional + ReLU + BN 512 64 3 × 3 1
Deconvolution 256 128 3 × 3 2
Concatenate with output of B3 - 128 - -
B7 Dropout - 128 - -
Convolutional + ReLU + BN 256 128 3 × 3 1
Convolutional + ReLU + BN 256 128 3 × 3 1
Deconvolution 128 256 3 × 3 2
Concatenate with output of B2 - 256 - -
B8 Dropout - 256 - -
Convolutional + ReLU + BN 128 256 3 × 3 1
Convolutional + ReLU + BN 128 256 3 × 3 1
Deconvolution 64 512 3 × 3 2
Concatenate with output of B1 - 512 - -
B9 Dropout - 512 - -
Convolutional + ReLU + BN 64 512 3 × 3 1
Convolutional + ReLU + BN 64 512 3 × 3 1
Convolutional + ReLU + BN 4 512 3 × 3 1
All experiments were performed on a High-
Performance Computing cluster, using a single
CUDA-enabled graphics processing unit and 750 Gi-
gabytes of memory. We used Python 3.7, Keras
2.3.1 and TensorFlow 2.3.1 in all experiments. To
train the proposed GAN model, Adam optimizer was
used for both, the generator and discriminator. Kull-
back–Leibler divergence and binary cross-entropy
were used as the loss functions for the generator and
discriminator, respectively. Finally, we used the fol-
lowing parameters in training: learning rate = 0.0002,
beta1 = 0.5, beta2 = 0.999, epsilon = 1e-8.
3.2 Data Set
We evaluated the proposed model, the alternative
models and the U-Net model, on an annotated
data set of 929 CT images and the corresponding
segmentation masks, which came from two public
sources (MedSeg, 2020). First, 100 CT images of
more than 40 patients were collected from the Ita-
lian Society of Medical and Interventional Radiology.
A radiologist manually segmented the CT images
and assigned labels. Second, 829 CT images came
from an online collaborative radiology resource. In
this data set, 373 out of the total of 829 slices were
COVID-19 positive, and these images were manu-
ally segmented and annotated by the radiologist. No
new image preprocessing was done in our work, and
downloaded images and their masks were used di-
rectly. However, we note that GGOs and consolida-
tions occupy a very small portion of the entire CT
image. For example, around 700 CT images in our
data set contain less than 1% of GGOs, and about 790
CT images have less than 2% of consolidations (Fig-
ure 2). Therefore, we constructed a benchmark data
set to realistically represent the distribution of the pix-
els. More specifically, we split the data into a test set
of 155 images, a validation set of 156 images, and a
training set of 618 images. The original data set was
partitioned based on the percentage of GGOs and con-
solidations in each CT image, such that each subset
had similar distributions of infected regions.
4 EXPERIMENTAL RESULTS
We implemented four different models, namely,
FFNN, FCN, U-Net and GAN, and tested them as fol-
lows. Each model was trained using 618 images and
their corresponding masks. The parameters of each
model were tuned using a validation set of 156 im-
BIOINFORMATICS 2022 - 13th International Conference on Bioinformatics Models, Methods and Algorithms
32
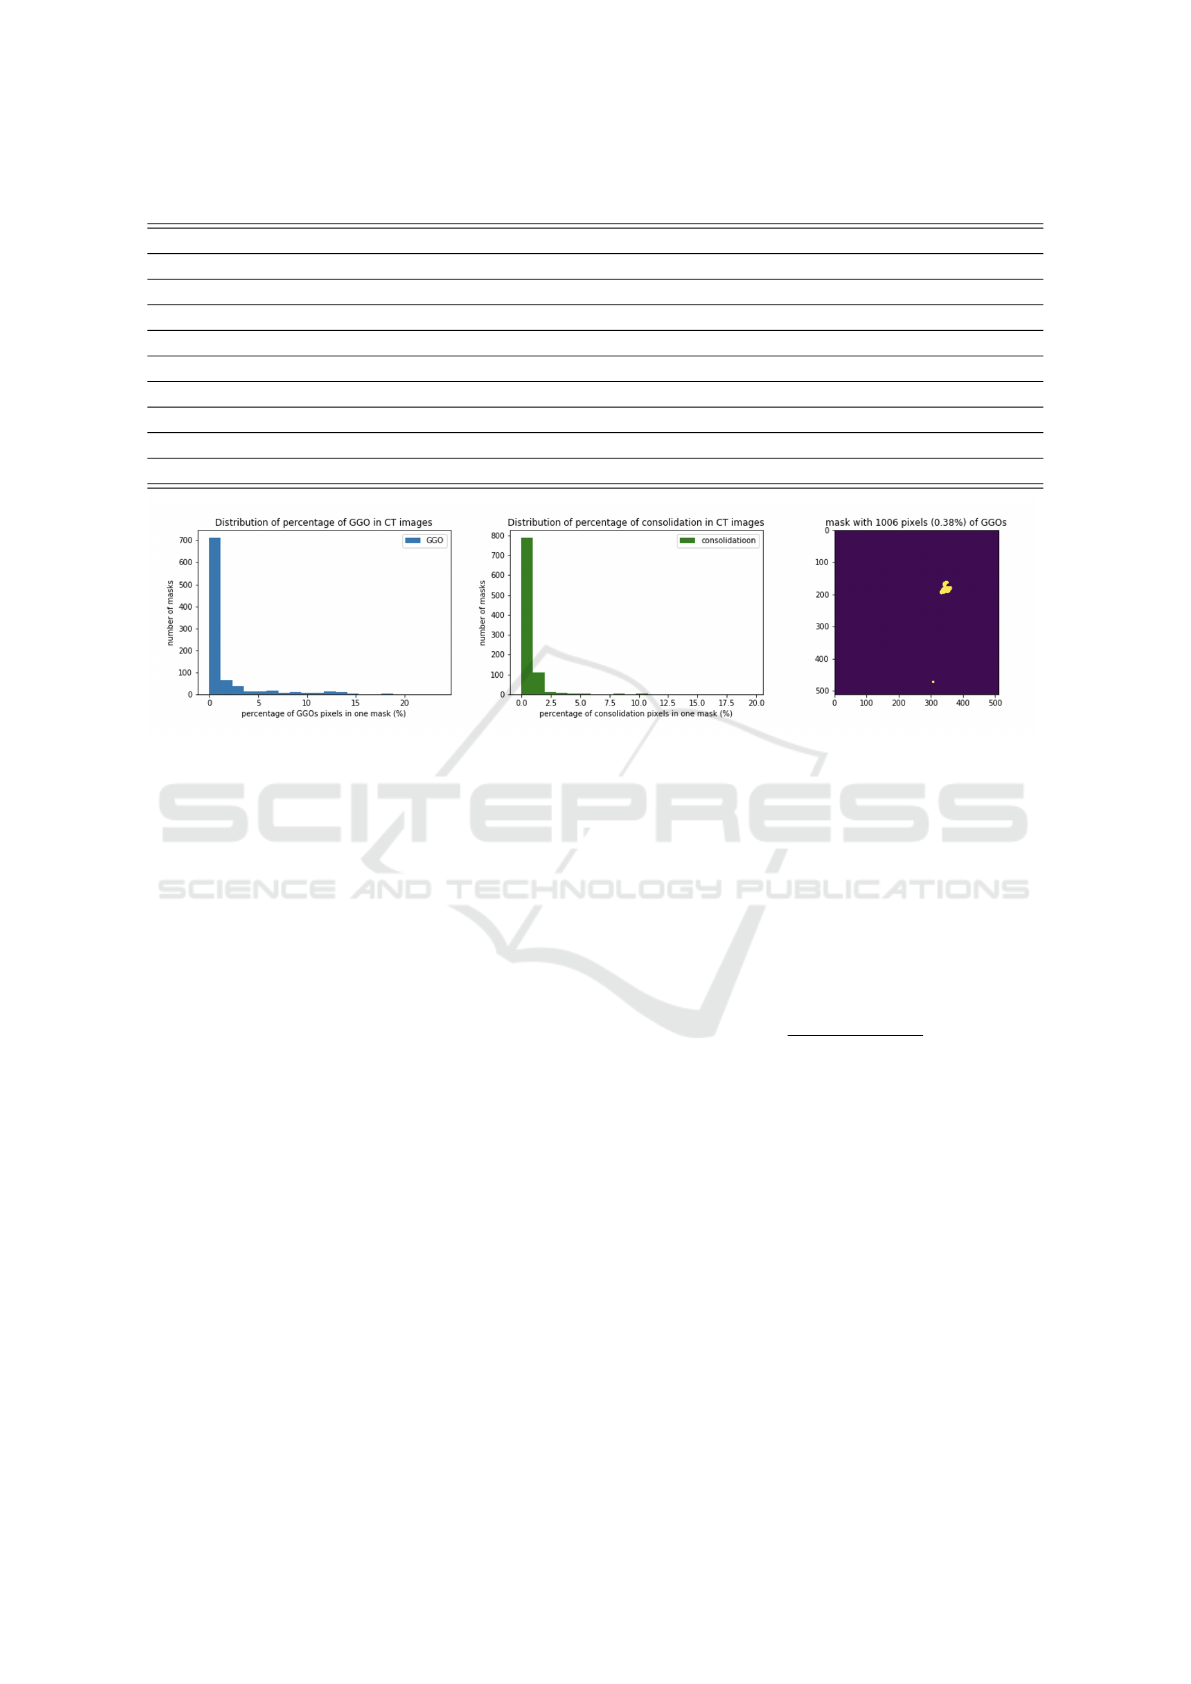
Table 3: Summary of parameters and blocks of the discriminator.
Stage Layer description Number of filters Dimension Kernel size Stride
1 Convolutional + LeakyReLU 8 256 4 × 4 2
2 Convolutional + BN + LeakyReLU 16 128 4 × 4 2
3 Convolutional + BN + LeakyReLU 32 64 4 × 4 2
4 Convolutional + BN + LeakyReLU 64 32 4 × 4 2
5 Convolutional + BN + LeakyReLU 128 16 4 × 4 2
6 Convolutional + BN + LeakyReLU 256 8 4 × 4 2
7 Convolutional + BN + LeakyReLU 512 4 4 × 4 2
8 Convolutional + BN + LeakyReLU 512 4 4 × 4 1
9 Convolutional + BN + LeakyReLU 1 4 4 × 4 1
Figure 2: Distribution of percentage of GGOs/consolidation in CT images and an example of mask with 0.38% GGOs.
ages and their masks. Finally, all models were tested
using 155 test images.
The FFNN model performs patch-based image
segmentation. Specifically, each 512 × 512 CT ima-
ge is first divided into 1024 nonoverlapping patches
of size 16 × 16, and each patch serves as the input to
the FFNN. The FFNN architecture comprises two 16-
neuron hidden layers, each of which is followed by
a BN layer. The output layer uses a softmax activa-
tion function and outputs four probabilities, one for
each class. The class with the largest probability is
assigned to all pixels of a given patch.
The FCN mode comprises five convolutional
blocks and three deconvolutional layers. This model
performs pixel-wise segmentation. Specifically, each
convolutional block consists of two 3 × 3 convolu-
tions and a 2× 2 max pooling layer, thus, reducing the
dimension of the preceding layer by half. The three
deconvolutional layers use stride 4, 2, and 1, respec-
tively, and concatenate their outputs with the outputs
from the corresponding layers in the encoder. The
FCN outputs a 512 × 512× 4 layer, with each channel
indicating the probability of one class.
Finally, we also compared our proposed model
with a U-Net, which builds upon the FCN and uses
a deep deconvolutional structure for the segmentation
of finer details from CT images (Ronneberger et al.,
2015). U-Net consists of a contracting path and an ex-
pansive path, with the same architecture as the paths
of the proposed GAN model (Table 1 and Table 2).
The contracting path consists of repeated convolution
layers, which reduce the spatial dimensions of an ima-
ge, while increasing the channel size. The expansive
path is used to enlarge the compressed representa-
tion of the input image to its original size through a
sequence of deconvolutions. The network’s output
is 512 × 512 × 4. The output is compared with the
ground truth masks directly. To evaluate the perfor-
mance of the models, we used the standard perfor-
mance metric, namely, the dice similarity coefficient
(DSC), computed as
2×T P
(T P+FP)+(T P+FN)
.
The main advantage of DSC is that it takes into ac-
count class imbalance, by measuring the overlap be-
tween the predicted mask and the ground truth mask
for a specific class label.
4.1 Quantitative Evaluation
The experimental results with a test data set of 155
images, demonstrate that our proposed GAN model
achieves DSC of 0.664 in classifying GGOs and 0.625
in classifying consolidations, outperforming the other
models (Table 4). DSC of classifying GGOs and con-
solidations were 0.384 and 0.071 for the best per-
forming FFNN model, and 0.233 and 0.274 for the
best performing FCN model. Moreover, our pro-
posed model outperformed the U-Net model, which
had DSC of 0.532 and 0.450 in classifying GGOs and
Generative Adversarial Network for the Segmentation of Ground Glass Opacities and Consolidations from Lung CT Images
33
Table 4: Performance of the proposed GAN model on the test data set of 155 images (N: patch size; k: kernel size). Shown are
DSCs of segmenting GGOs and consolidations, as well as the GPU training time and memory requirements. Performances of
the baseline models on the same data sets are included for comparison.
Models GGOs consolidation Time (hh:mm:ss) Memory (GB)
FFNN 0.384 0.071 00:16:29 14.28
FCN 0.233 0.274 00:09:13 14.72
U-Net 0.532 0.450 00:49:01 14.91
GAN (N = 4, k = 4) 0.664 0.477 01:38:32 12.68
GAN (N = 32, k = 3) 0.428 0.625 01:30:32 12.24
Table 5: Performance of GAN model with varied hyperparameters. DSC for segmenting GGOs, consolidations, other lung
tissues and background are shown for different patch and kernel sizes (k: kernel size).
patch=2 patch=4 patch=8 patch=16 patch=32
Region k=2 k=3 k=4 k=5 k=2 k=3 k=4 k=5 k=2 k=3 k=4 k=5 k=2 k=3 k=4 k=5 k=2 k=3 k=4 k=5
GGOs 0.169 0.566 0.606 0.602 0.579 0.498 0.664 0.580 0.546 0.624 0.640 0.462 0.647 0.616 0.661 0.632 0.631 0.428 0.648 0.449
consolidation 0.169 0.508 0.491 0.526 0.496 0.518 0.477 0.618 0.518 0.483 0.474 0.283 0.565 0.549 0.483 0.478 0.436 0.625 0.468 0.607
lung other tissues 0.568 0.792 0.758 0.790 0.812 0.746 0.789 0.706 0.758 0.798 0.794 0.672 0.802 0.830 0.797 0.816 0.789 0.696 0.788 0.728
background 0.933 0.991 0.989 0.991 0.992 0.990 0.995 0.986 0.989 0.994 0.992 0.978 0.994 0.992 0.994 0.993 0.994 0.992 0.995 0.991
consolidations, respectively.
The sizes of the kernel and the output patch in the
discriminator influenced the performance of the pro-
posed GAN model (Table 5). For example, decreasing
the kernel size from 4 to 3, and increasing the patch
size from 4 to 32, improved the segmentation of con-
solidations, and their DSC increased from 0.477 to
0.625. On the other hand, the DSC of segmenting
GGOs dropped from 0.664 to 0.428, when kernel size
was reduced to 3 and patch size was increased to 32.
We analyzed GAN’s sensitivity to these two hy-
perparameters further. Overall, the most stable per-
formance for the segmentation of GGOs was with the
patch size of 16, and DSCs ranged from 0.616 for the
kernel size of 3 to 0.661 for the kernel size of 4. Con-
solidations were more difficult to segment. The best
performing GAN model also had the patch size of 16,
and model’s performance varied from 0.478 to 0.565
for kernel sizes of 5 and 2, respectively. Finally, the
most balanced performance was observed for patch
size 16 and kernel size of 2. The DSCs were 0.647
for GGOs and 0.565 for consolidations.
Segmentation of noninfected regions or other lung
tissues was accurate, and the DSCs of their segmenta-
tion ranged from 0.568 when path size of 2 and kernel
size of 2 were used, to 0.830 for patch size of 16 and
kernel size of 3.
Segmentation of background regions from CT
scans was the most accurate, and DSC was greater
than 0.9, with the highest DSC recorded for kernel
sizes of 4.
We analyzed computational resources used for
training of each of the segmentation models and found
that training of GAN models required longer times but
less memory than other models (Table 4). The GAN
training time on a single graphics processing unit was
almost twice that of the U-Net’s training time. This
result was expected because there are two networks
in our GAN model that required parameter tuning.
Although direct comparison with the state-of-the
art models is not feasible due to the differences in data
sets and the lack of publicly available software code,
we compared our findings with the recently reported
results of a study that used the same benchmark data
set (Rajamani et al., 2021). The prior state-of-the art
model, DDANet, achieved DSC of 0.734 in the seg-
mentation of GGOs and DSC of 0.613 in the segmen-
tation of consolidations, reporting an improvement
over the baseline U-Net of about 5%. Our results are
similar, and our proposed segmentation network out-
performs U-Net by about 13% for GGOs and 18% for
consolidations. Moreover, we report DSC of 0.664
for the segmentation of GGOs and 0.625 for the seg-
mentation of consolidations.
4.2 Qualitative Evaluation
A closer examination of the predicted masks shows
that regions segmented by our GAN model have more
precise boundaries than other models, including U-
Net (Figure 3). However, the segmentation of consol-
idation regions appears to be more challenging for all
four models, including the state-of-the art model, and
DSCs ranged from 0.071 in the FFNN model to 0.625
in the GAN model, respectively. The trade-offs bet-
ween the kernel and the patch sizes of the discrimina-
tor were also qualitatively observable in the predicted
segmentation masks (Figure 4). These results may
be due to the temporal changes of COVID-19 infec-
tion, where the infection begins as the GGO and then
progresses to the consolidation followed by the clear-
ance. Thus, consolidation regions present in the data
BIOINFORMATICS 2022 - 13th International Conference on Bioinformatics Models, Methods and Algorithms
34
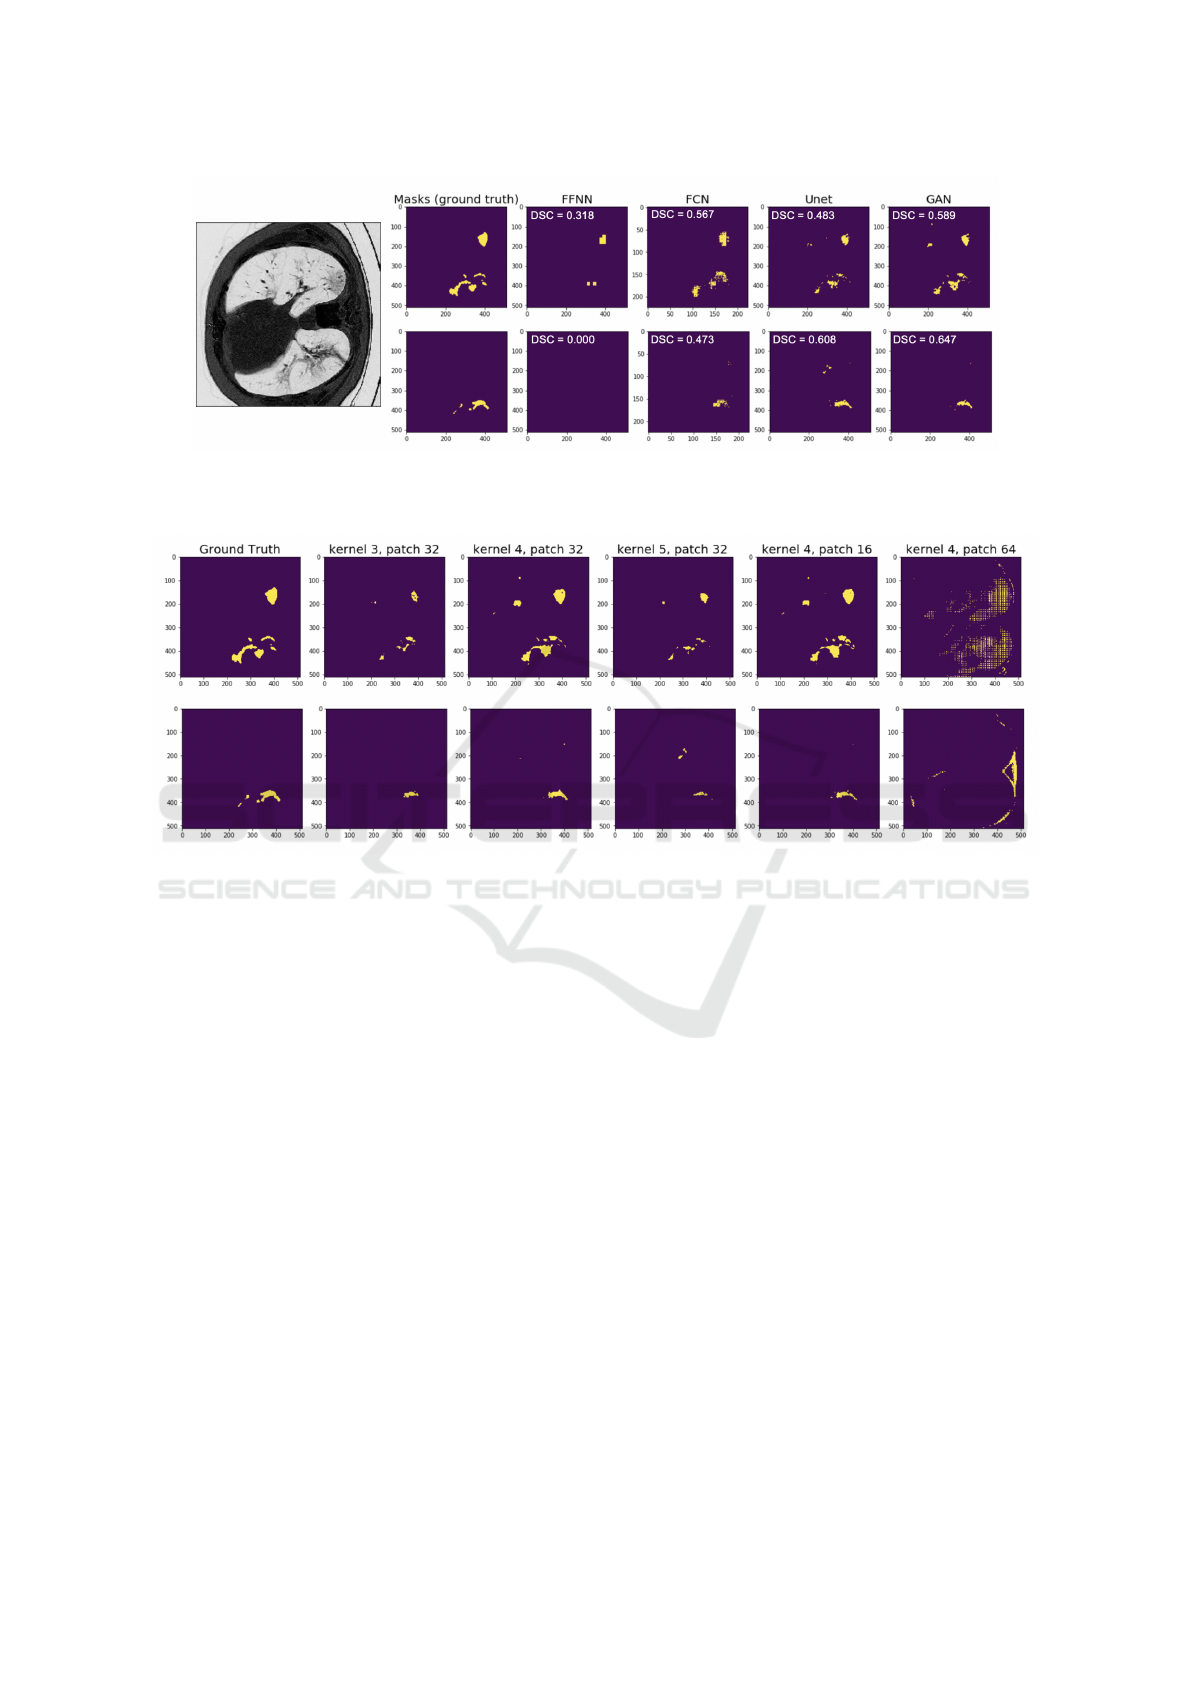
Figure 3: Comparison of the masks predicted by four models. The first and second row corresponds to the predicted masks of
GGOs and consolidation, respectively. DSC scores are shown in the upper left corner. Grayscale original image is shown on
the left, and the first column shows the corresponding ground truth masks of GGOs and consolidations.
Figure 4: Predicted masks of a CT scan example using the proposed GAN model with varying kernel sizes and varying
patch sizes of discriminator. Showed are predicted masks of the same CT scan example with varying kernel sizes and patch
sizes. Discriminator with patch size 16 clearly performs best, while discriminator with patch size 64 fails to capture infection
objects. Moreover, a discriminator with a kernel size of 4, provides the most refined boundary of correct GGOs areas but
mistakenly classifies some background pixels as GGOs.
set of CT images may be in different disease stages,
impacting the segmentation performance.
Although the proposed model aims to overcome
the limited size of the training data set, image qual-
ity and noise do influence its performance. Therefore,
denoising techniques, including a recently proposed
Shapley data valuation (Tang et al., 2021), may help
to remove noise and improve model’s performance.
We also note that the size of our labeled data set is
small and around 400 out of 929 images have neither
GGOs nor consolidations. Thus, both of these limita-
tions need to be addressed in future studies, using data
augmentation, for example. We also expect that with
the growing number of publicly available COVID-19
imaging data sets, new CT images will become avail-
able, allowing us to retrain our GAN model and ad-
dress these limitations. For these new data to be use-
ful for the comparison of different DL models, im-
age preprocessing and annotation must be done in the
similar way to avoid preprocessing biases. Finally, to
evaluate the practical utility of the proposed DL mod-
els, data sets should be collected from diverse pop-
ulations of patients, and models should be tested in
prospective rather retrospective validation studies.
5 CONCLUSION
We presented a GAN model for the segmentation
of two types of COVID-19 infections from CT im-
ages, namely, ground glass opacities and consolida-
tions. The proposed model outperformed two sim-
pler segmentation networks and the baseline U-Net.
The proposed model is also on par with a state-of-the
art model in the task of GGOs’ segmentation, and it
performs better in the segmentation of consolidations.
Sensitivity analyses, performed as part of this work,
indicate that patch and kernel sizes influence model’s
performance and vary for the two infection types. A
patch size of 16 resulted in the best performance for
Generative Adversarial Network for the Segmentation of Ground Glass Opacities and Consolidations from Lung CT Images
35

the segmentation of GGOs, whereas a larger patch
size of 32 was needed to accurately segment consol-
idations. Taken together, our findings suggest that
GAN models may be useful not only in data aug-
mentation tasks but also in image segmentation. Be-
yond COVID-19 imaging, our model can be adapted
to other medical applications, where the region of in-
terest is poorly defined and is very small compared
to other objects in the image. Future work will focus
on the experimental studies of denoising techniques
with the aim of improving the quality of the training
data sets and on the identification of most informative
training images.
ACKNOWLEDGMENT
The authors thank Cody Stevens for the assistance
with the execution of computational experiments and
the anonymous reviewers for comments that im-
proved this manuscript. The authors acknowledge
the Distributed Environment for Academic Comput-
ing (DEAC) at Wake Forest University for provid-
ing HPC resources that have contributed to the re-
search results reported within this paper. URL:
https://is.wfu.edu/deac
REFERENCES
Ai, T., Yang, Z., Hou, H., Zhan, C., Chen, C., Lv, W., Tao,
Q., Sun, Z., and Xia, L. (2020). Correlation of chest
CT and RT-PCR testing for coronavirus disease 2019
(COVID-19) in China: a report of 1014 cases. Radi-
ology, 296(2):E32–E40.
Cao, Y., Xu, Z., Feng, J., Jin, C., Han, X., Wu, H., and Shi,
H. (2020). Longitudinal assessment of COVID-19 us-
ing a deep learning–based quantitative CT pipeline:
illustration of two cases. Radiology: Cardiothoracic
Imaging, 2(2):e200082.
Drozdzal, M., Vorontsov, E., Chartrand, G., Kadoury, S.,
and Pal, C. (2016). The importance of skip connec-
tions in biomedical image segmentation. In Deep
Learning and Data Labeling for Medical Applica-
tions, pages 179–187. Springer.
Goel, T., Murugan, R., Mirjalili, S., and Chakrabartty, D. K.
(2021). Automatic screening of Covid-19 using an
optimized generative adversarial network. Cognitive
computation, pages 1–16.
Goodfellow, I., Pouget-Abadie, J., Mirza, M., Xu, B.,
Warde-Farley, D., Ozair, S., Courville, A., and Ben-
gio, Y. (2014). Generative adversarial nets. In
Advances in neural information processing systems,
pages 2672–2680.
Hesamian, M., Jia, W., He, X., and Kennedy, P. (2019).
Deep learning techniques for medical image segmen-
tation: Achievements and challenges. Journal of dig-
ital imaging, 32(4):582–596.
Huang, L., Han, R., Ai, T., Yu, P., Kang, H., Tao, Q., and
Xia, L. (2020). Serial quantitative chest CT assess-
ment of COVID-19: a deep learning approach. Radi-
ology: Cardiothoracic Imaging, 2(2):e200075.
Jiang, Y., Chen, H., Loew, M., and Ko, H. (2020). Covid-
19 CT image synthesis with a conditional generative
adversarial network. IEEE Journal of Biomedical and
Health Informatics, 25(2):441–452.
Kobayashi, Y. and Mitsudomi, T. (2013). Management
of ground-glass opacities: should all pulmonary le-
sions with ground-glass opacity be surgically re-
sected? Translational lung cancer research, 2(5):354.
Kumar Singh, V., Abdel-Nasser, M., Pandey, N., and Puig,
D. (2021). Lunginfseg: Segmenting COVID-19 in-
fected regions in lung CT images based on a receptive-
field-aware deep learning framework. Diagnostics,
11(2):158.
LeCun, Y., Bengio, Y., and Hinton, G. (2015). Deep learn-
ing. Nature, 521(7553):436–444.
Li, L., Qin, L., Xu, Z., Yin, Y., Wang, X., Kong, B., Bai, J.,
Lu, Y., Fang, Z., Song, Q., et al. (2020). Artificial in-
telligence distinguishes COVID-19 from community
acquired pneumonia on chest CT. Radiology.
Long, J., Shelhamer, E., and Darrell, T. (2015). Fully con-
volutional networks for semantic segmentation. In
Proceedings of the IEEE conference on computer vi-
sion and pattern recognition, pages 3431–3440.
Luc, P., Couprie, C., Chintala, S., and Verbeek, J. (2016).
Semantic segmentation using adversarial networks. In
NIPS Workshop on Adversarial Training.
MedSeg (2020). COVID-19 CT segmentation dataset.
https://medicalsegmentation.com/covid19/.
accessed on December 21, 2020.
Noh, H., Hong, S., and Han, B. (2015). Learning de-
convolution network for semantic segmentation. In
Proceedings of the IEEE international conference on
computer vision, pages 1520–1528.
O’Mahony, N., Campbell, S., Carvalho, A., Harapanahalli,
S., Hernandez, G. V., Krpalkova, L., Riordan, D., and
Walsh, J. (2019). Deep learning vs. traditional com-
puter vision. In Science and Information Conference,
pages 128–144. Springer.
Oulefki, A., Agaian, S., Trongtirakul, T., and Laouar, A.
(2020). Automatic COVID-19 lung infected region
segmentation and measurement using CT-scans im-
ages. Pattern Recognition, page 107747.
Rajamani, K. T., Siebert, H., and Heinrich, M. P. (2021).
Dynamic deformable attention network (DDANet) for
COVID-19 lesions semantic segmentation. Journal of
biomedical informatics, 119:103816.
Ronneberger, O., Fischer, P., and Brox, T. (2015). U-
Net: Convolutional networks for biomedical image
segmentation. In International Conference on Medi-
cal image computing and computer-assisted interven-
tion, pages 234–241. Springer.
Shan, F., Gao, Y., Wang, J., Shi, W., Shi, N., Han, M., Xue,
Z., Shen, D., and Shi, Y. (2021). Abnormal lung quan-
tification in chest CT images of COVID-19 patients
BIOINFORMATICS 2022 - 13th International Conference on Bioinformatics Models, Methods and Algorithms
36

with deep learning and its application to severity pre-
diction. Medical physics, 48(4):1633–1645.
Shi, F., Wang, J., Shi, J., Wu, Z., Wang, Q., Tang, Z., He, K.,
Shi, Y., and Shen, D. (2021). Review of artificial in-
telligence techniques in imaging data acquisition, seg-
mentation, and diagnosis for COVID-19. IEEE Re-
views in Biomedical Engineering, 14:4–15.
Szegedy, C., Ioffe, S., Vanhoucke, V., and Alemi, A. A.
(2017). Inception-v4, Inception-ResNet and the im-
pact of residual connections on learning. In Thirty-
first AAAI conference on artificial intelligence.
Tang, S., Ghorbani, A., Yamashita, R., Rehman, S., Dun-
nmon, J. A., Zou, J., and Rubin, D. L. (2021). Data
valuation for medical imaging using shapley value and
application to a large-scale chest x-ray dataset. Scien-
tific reports, 11(1):1–9.
Trivizakis, E., Tsiknakis, N., Vassalou, E. E., Papadakis,
G. Z., Spandidos, D. A., Sarigiannis, D., Tsat-
sakis, A., Papanikolaou, N., Karantanas, A. H., and
Marias, K. (2020). Advancing COVID-19 differenti-
ation with a robust preprocessing and integration of
multi-institutional open-repository computer tomog-
raphy datasets for deep learning analysis. Experimen-
tal and therapeutic medicine, 20(5):1–1.
Wang, B., Jin, S., Yan, Q., Xu, H., Luo, C., Wei, L., Zhao,
W., Hou, X., Ma, W., Xu, Z., et al. (2021). AI-assisted
CT imaging analysis for COVID-19 screening: Build-
ing and deploying a medical AI system. Applied Soft
Computing, 98:106897.
Wu, X., Chen, C., Zhong, M., Wang, J., and Shi, J. (2021).
COVID-AL: The diagnosis of COVID-19 with deep
active learning. Medical Image Analysis, 68:101913.
Xie, F., Huang, Z., Shi, Z., Wang, T., Song, G., Wang, B.,
and Liu, Z. (2021). DUDA-Net: a double U-shaped
dilated attention network for automatic infection area
segmentation in COVID-19 lung CT images. Inter-
national Journal of Computer Assisted Radiology and
Surgery, pages 1–10.
Yue, H., Yu, Q., Liu, C., Huang, Y., Jiang, Z., Shao, C.,
Zhang, H., Ma, B., Wang, Y., Xie, G., et al. (2020).
Machine learning-based CT radiomics method for
predicting hospital stay in patients with pneumonia as-
sociated with SARS-CoV-2 infection: a multicenter
study. Annals of translational medicine, 8(14).
Zeiler, M. and Fergus, R. (2014). Visualizing and under-
standing convolutional networks. In European con-
ference on computer vision, pages 818–833. Springer.
Zhang, P., Zhong, Y., Deng, Y., Tang, X., and Li, X. (2020).
CoSinGAN: learning COVID-19 infection segmenta-
tion from a single radiological image. Diagnostics,
10(11):901.
Zhao, X., Zhang, P., Song, F., Fan, G., Sun, Y., Wang, Y.,
Tian, Z., Zhang, L., and Zhang, G. (2021). D2A
U-Net: Automatic segmentation of COVID-19 CT
slices based on dual attention and hybrid dilated con-
volution. Computers in biology and medicine, page
104526.
Zheng, B. et al. (2020). MSD-Net: Multi-scale discrimina-
tive network for COVID-19 lung infection segmenta-
tion on CT. IEEE Access, 8:185786–185795.
Zhou, S., Zhu, T., Wang, Y., and Xia, L. (2020). Imag-
ing features and evolution on CT in 100 COVID-19
pneumonia patients in Wuhan, China. European Ra-
diology, pages 1–9.
Zhou, T., Canu, S., and Ruan, S. (2021). Automatic
COVID-19 CT segmentation using U-Net integrated
spatial and channel attention mechanism. Interna-
tional Journal of Imaging Systems and Technology,
31(1):16–27.
Zhu, Q., Ye, H., Sun, L., Li, Z., Wang, R., Shi, F., Shen,
D., and Zhang, D. (2021). GACDN: generative adver-
sarial feature completion and diagnosis network for
COVID-19. BMC Medical Imaging, 21(1):1–13.
Generative Adversarial Network for the Segmentation of Ground Glass Opacities and Consolidations from Lung CT Images
37
