
Lifting the Fog on Word Clouds: An Evaluation of Interpretability in 234
Individuals
M. P. Maurits
1
, M. Boers
2
and R. Knevel
1
1
Leiden University Medical Center, Rheumatology Department, Leiden, The Netherlands
2
Amsterdam University Medical Center, Department of Epidemiology and Data Science, Amsterdam, The Netherlands
Keywords:
Word Clouds, Scaling, Survey, Surface Area, Font Size.
Abstract:
Word clouds are a popular tool for text summary visualisation. By scaling words based on relative frequency,
readers should be capable of quickly deducing some of the text semantics. We raise the question whether
word clouds truly aid visualisation or rather mislead readers by scaling the wrong text aspect. We evaluated
the magnitude of misinterpretation of word clouds using both a traditional font-scaling approach and a novel
surface-area-scaling approach. Using an online survey we involved 234 participants, whom we tasked with
guesstimating the frequency of 2 words either side of a word with a fixed frequency. We defined an error
margin based on the regression slope of the guesstimations with the true frequencies. Clouds were constructed
using the font-size or the word-area scaling method, a doubling or a linearly increasing frequency scheme and
either words with a constant or increasing length. Errors were compared between settings using Wilcoxon
tests. Both word size scaling methods resulted in poor performance of the participants and highlighted great
inter-participant variation. Guesstimation accuracy was clearly dependent on the objective complexity of
the visualisation. Our survey supports the hypothesis that word clouds are a fickle measure to convey word
frequencies in a corpus of text.
1 INTRODUCTION
With the increasing popularity of natural language
processing comes the question how to visualise the
results. Word clouds (also called tag clouds) are fre-
quently used to display relative frequencies of words
in a body of text. These visualisations are attrac-
tive as infographics, as they summarise textual in-
formation using a playful design. There are many
free, online tools and functions (in R for example)
to construct word clouds.(Fellows, 2018)(Mueller,
2015)(Wang et al., 2017) While there are many exam-
ples of publications where word clouds are promoted
for data visualisation(Sellars et al., 2018)(Stott et al.,
2018)(Bayrak et al., 2019)(Chi et al., 2015)(Vanstone
et al., 2016)(Hearst et al., 2020), many hold the opin-
ion that word clouds give grossly inaccurate quantifi-
cations of word frequencies, leading to misinterpreta-
tion by the readers.(Temple, 2019)(Medelyan, 2016)
The main reason for this concern is the proportional
scaling of the size of individual words and the po-
tential influence of arbitrary factors on the percep-
tion thereof (Alexander et al., 2018). The human
mind tries to assess and compare the surface areas
of the words displayed, but this value is not an ac-
curate representation of the frequency of the word;
most, if not all, algorithms use the vertical dimension
of the letter (the ‘font size’) to depict differences in
frequency. This means that a word which is twice as
frequent, will have twice the font size of the compara-
tor. By doubling the font size in this way, one actually
quadruples the area covered by the word. In addition,
longer words by definition take up more space, and
in proportional fonts some letters (e.g. ‘m’) take up
more space than others (e.g. ‘i’). In order to mitigate
these distortions, we created word clouds where the
relative frequency of words was reflected by their sur-
face area. We investigated the extent to which peo-
ple’s ability to judge inter-word differences differed
between the font-size clouds and our word-area ver-
sion.
Maurits, M., Boers, M. and Knevel, R.
Lifting the Fog on Word Clouds: An Evaluation of Interpretability in 234 Individuals.
DOI: 10.5220/0010778700003124
In Proceedings of the 17th International Joint Conference on Computer Vision, Imaging and Computer Graphics Theory and Applications (VISIGRAPP 2022) - Volume 3: IVAPP, pages
123-128
ISBN: 978-989-758-555-5; ISSN: 2184-4321
Copyright
c
2022 by SCITEPRESS – Science and Technology Publications, Lda. All rights reserved
123

2 METHODS
2.1 Cloud Construction Methods
We created eight clouds, each containing five com-
mon (Dutch) words, using two methods; the “old”
method which scales words by font size, and the
“new” method which scales them by surface area (de-
fined as the area taken up by the word bounding box)
(Figure 1). The four clouds of a single method dif-
fered on two parameters: 1. frequency sequence;
word frequency either doubled (15,30,60,120,240) or
increased linearly (18,39,60,81,102); and 2. word
length; words were either constant in length (5 let-
ters) or increased alongside their frequency from 2
to 10 letters (2,4,6,8,10). This resulted in a total
of eight unique clouds, four across each of the two
methods. For all clouds we used a non-proportional
(monospaced) font in all caps and sorted the words in
vertical direction by frequency (and thus size). Hor-
izontal alignment was randomly shifted, as was font
colour to simulate a natural word cloud to some de-
gree. We created the clouds by writing 2 R func-
tions, one for each method. Details on both algo-
rithms as well as supplementary files are supplied at
www.github.com/MarcMaurits/CloudCover.
2.2 Survey
We assessed how well people from different profes-
sional backgrounds estimated word frequencies when
exposed to word clouds created in the traditional
(“font-size”) way and in our alternative surface area
way (“word-area”). Respondents completed a survey
made in Survey Monkey® where the first two clouds
were always the same; both used words containing 5
letters, doubling in frequency; participants were ran-
domly allocated (1:1) to receive either the font-size or
the word-area method first. The remaining six clouds
were offered in completely random order for all par-
ticipants. In the survey, the frequency of the mid-
dle word was always given as 60, so the respondents
had to guesstimate the frequency of the remaining 4
words, 2 on each side of 60. Input was collected via
free written numerical input boxes, without any re-
striction on the range of values. The survey could be
completed using any platform supported by the Sur-
vey Monkey® software and could be saved and re-
sumed partway through if so desired. In The Nether-
lands, survey research such as this is exempt from eth-
ical assessment. The GitHub page contains the com-
plete (Dutch) survey as it was presented to the partic-
ipants.
2.3 Error Calculation
To estimate the error in guesstimation, we calculated
a regression coefficient (beta) of the relationship be-
tween the true frequencies and the frequencies as es-
timated, per individual, per cloud. For the doubling
sequences we log-transformed both the guesstimation
and the true values, to ensure a linear result for both
sequence types, thus facilitating comparison. As flaw-
less guesstimation would result in a beta of 1, we cal-
culated the assessment error as log10(beta). We thus
fix a perfect score at 0, with a negative error-score
reflecting an underestimation of the trend in word fre-
quency and a positive score an overestimation. This
error calculation means that a slope of 0.5 (mean-
ing the participant underestimated the effect by 50%)
gives an error of -0.33 (=log10(0.5)) and an over-
estimation of twice the slope gives an error of 0.33
(=log10(2)). Since zero and negative slopes (meaning
the participant respectively guesstimated stable word
frequencies or a decrease in frequency) indicate com-
plete dissociation with the survey and cannot be log-
transformed, we set those slopes to 1.0x10-99 in the
sensitivity analysis and excluded them from the main
analysis.
2.4 Statistical Analysis
We compared the error of the font-size method ver-
sus the word-area method using Wilcoxon paired rank
tests. Next, we analysed whether particular aspects
of the cloud (frequency difference between words
and word lengths) explained the errors. We used R
(v.3.5.1) packages “magick”, “ggplot2”, “gridExtra”,
“colorRamps” and “reshape2” for the analyses and
plots.
3 RESULTS
3.1 Main Analyses
We found 234 people willing to participate in our sur-
vey. Most respondents were rheumatologists, aca-
demic lawyers or epidemiologists, with minor con-
tributions from other professions. Mean (SD) age
was 39 (12), 69% were women, 84% were familiar
with word clouds and 25% used them themselves.
The survey was fully completed by 82% of the par-
ticipants. Seven sets of responses were classified as
outliers, being several magnitudes away from the cor-
rect answer, or supplying answers in reverse (e.g. de-
creasing frequency while actual word frequency in-
creased). We identified 52 answers which resulted in
IVAPP 2022 - 13th International Conference on Information Visualization Theory and Applications
124
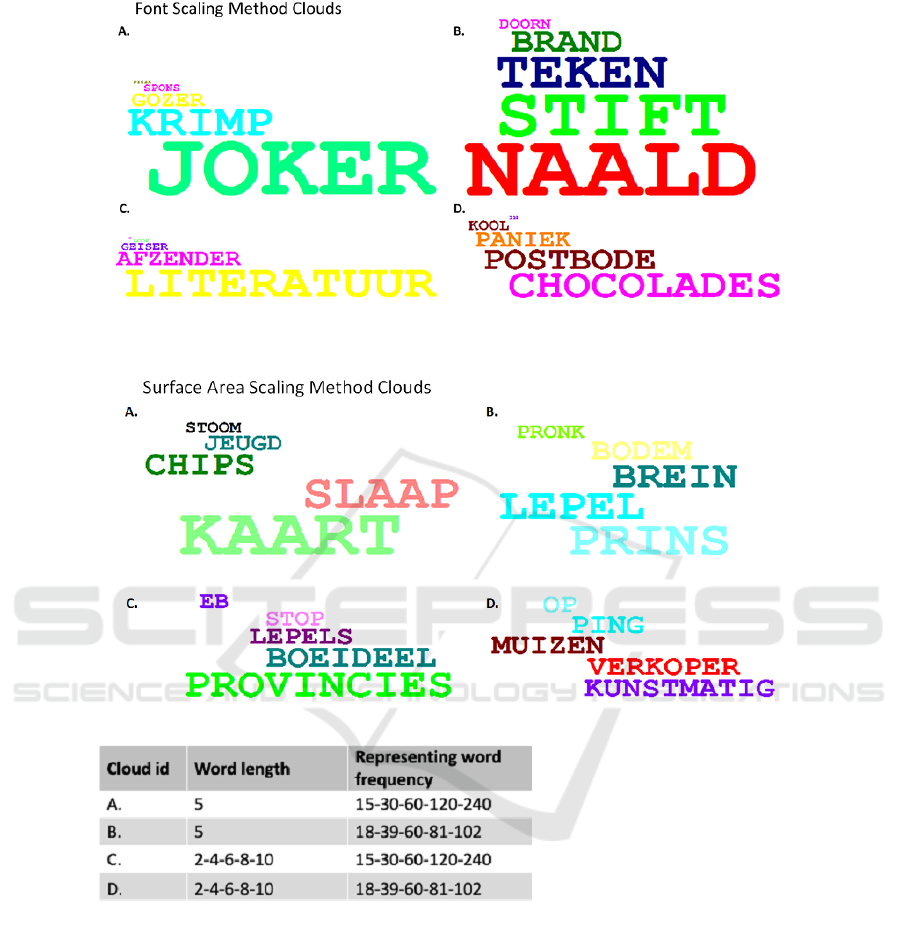
Figure 1: Word clouds as presented to the participants. The table describes the input with regard to number of characters per
word (word length) and the word frequency that the cloud should depict. The “old” method depicts the frequency by scaling
the words by font size, while the “new” method scales the surface area. The participants were tasked with guesstimating the
depicted words frequency based on a frequency of 60 for the middle word, while being unaware of the applied methods.
a negative slope and fourteen with a slope of zero.
The decidedly most challenging cloud was number 4
created with the word-area method. This cloud was
based on words with a frequency of 18, 39, 60, 81
and 102. Here 142 respondents reported no frequency
difference between the depicted words, 23 respon-
dents only a modest increase and 20 did not answer
this question at all. We excluded extreme answers
(error <= -4), participants who did not complete the
survey, reversed guesstimate answers (decreasing fre-
quency) and flatline 0/1 answers. The mean error
(± standard error) of participants’ estimates was 0.08
(± 0.01) and -0.46 (±0.01) for clouds created with
the font-size and word-area method respectively (P
<.001) (Figure 2). Overall the estimations were
worse in the clouds with increasing word length (-
0.21±0.02) versus clouds with constant word length
(-0.12±0.01, P = .09) and worse for clouds with dou-
bling increase in word frequency (-0.20±0.01) ver-
sus linear (-0.11±0.01, P = .002) (Figure 3). When
Lifting the Fog on Word Clouds: An Evaluation of Interpretability in 234 Individuals
125
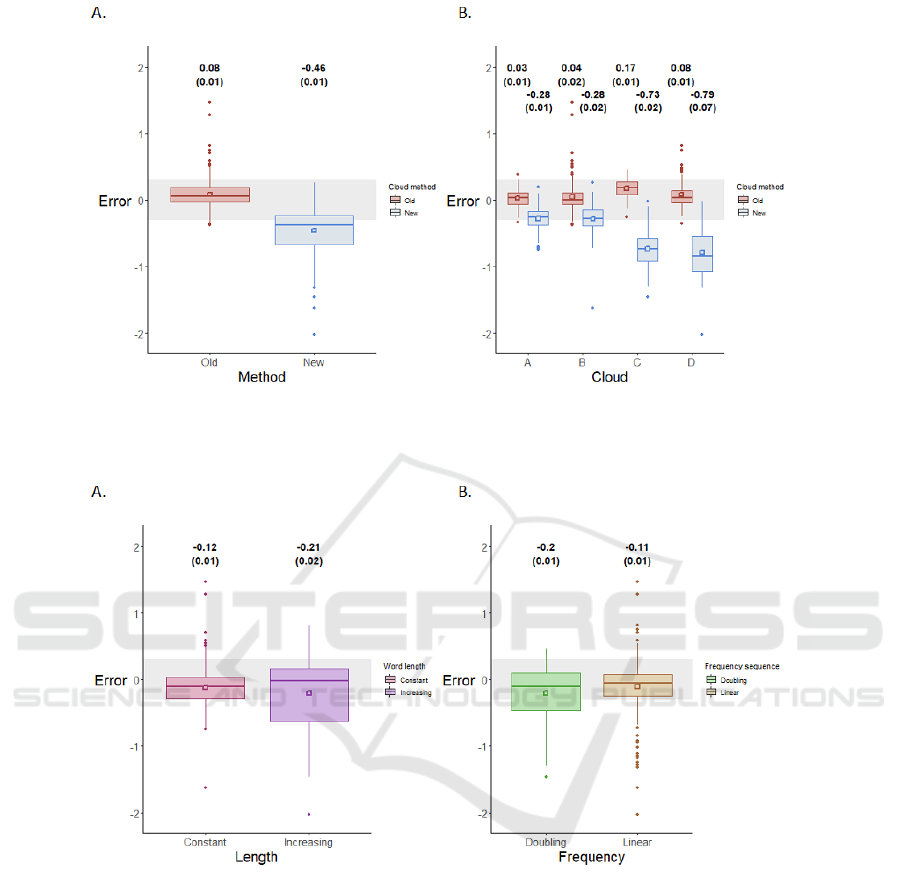
Figure 2: Error score for the word-area versus the font-size method. Figure A depict the boxplot of participants’ guesstimation
errors for the font-size and word-area method. Part B depicts the results at the level of the individual clouds. The numbers are
mean (standard error), also depicted as an open square.
Figure 3: Error score for A) clouds consisting of words with equal character count (cloud A&B) and clouds with words with
an increasing word count (cloud C&D) and B) clouds consisting of words with a doubling word frequency (cloud A&C)
versus clouds with words with a linearly increasing frequency (cloud B&D). The numbers are mean (standard error), also
depicted as an open square.
we split the analyses of Figure 3 by method (font-
size or word-area) we find that the word-area method
led to higher errors for both equal word and increas-
ing word length clouds (P <.001). Both the font-
size method and the word-area method gave worse
estimates for increasing length compared to constant
(font-size: 0.13±0.01 and 0.04±0.01, P <.001, word-
area: -0.75±0.02 versus -0.28±0.01, P <.001) (Figure
4). We observed similar patterns when comparing the
clouds with doubling and linear sequences; the word-
area method led to higher errors (P <.001). With
the font-size method participants performed slightly
worse on the doubling sequences compared to the lin-
ear (0.10±0.01 and 0.06±0.01, P <.001). The word-
area method exaggerated this difference, with partici-
pants again providing better guesstimates in the dou-
bling sequence clouds versus the linear (-0.51±0.02
versus -0.38±0.02, P <.001) (Figure 4).
3.2 Sensitivity Analyses
We investigated the effect of excluding outlier an-
swers and participants by rerunning the analyses with
the entire dataset. The results of these analyses can
IVAPP 2022 - 13th International Conference on Information Visualization Theory and Applications
126
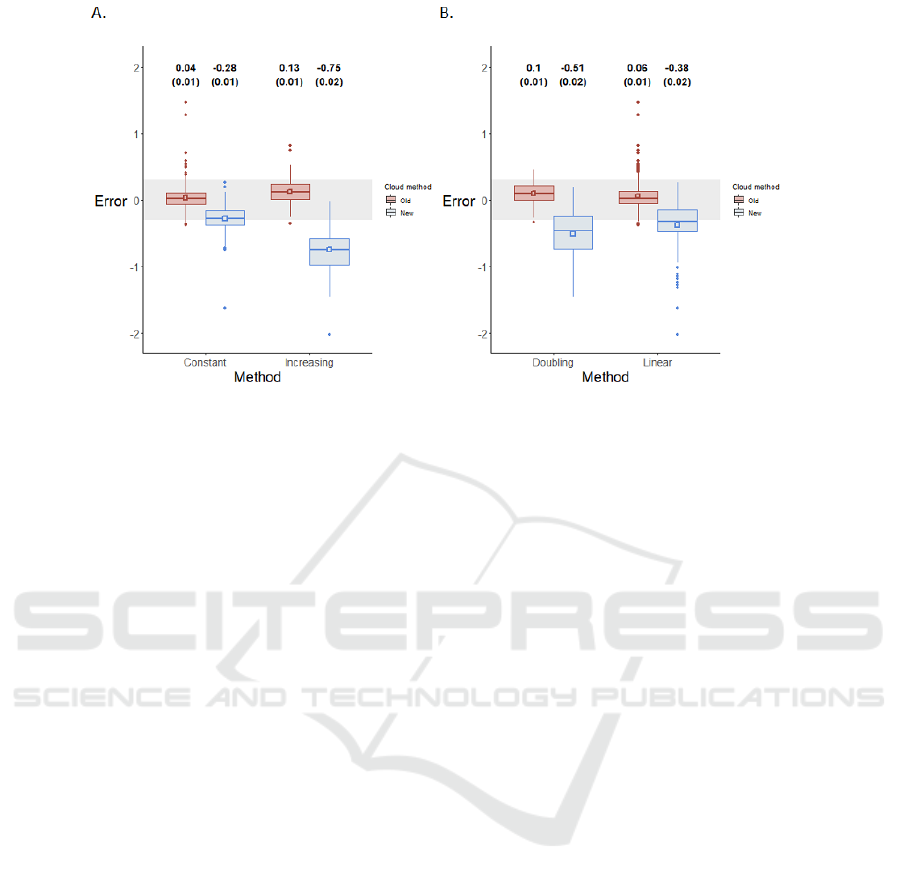
Figure 4: Error score for A) clouds consisting of words with equal character count (cloud A&B) and clouds with words with
an increasing word count (cloud C&D) and B) clouds consisting of words with a doubling word frequency (cloud A&C)
versus clouds with words with a linearly increasing frequency (cloud B&D) separated by word cloud method. The numbers
are mean (standard error), also depicted as an open square.
be found on the GitHub page. Including the extreme
answers and participants who did not finish the com-
plete survey did not substantially change the results.
4 DISCUSSION
4.1 Principal Results
We quantified the error of word frequency estimates
in word clouds constructed in several ways. On aver-
age, the participants performed well when estimating
word frequencies of the clouds created with the con-
ventional (font-size) method. However, the standard
error was high in all analyses, demonstrating that a
substantial proportion of the participants gave gross
over- and underestimations. Our new method, where
the word visualisation was based on the surface area
rather than the letter height, led to a more consistent
frequency guesstimation amongst participants, and to
less overestimation. However, the word frequencies
were frequently underestimated with this word-area
method. Our word clouds did not contain any fea-
tures that could mislead the readers beyond the actual
size of words. Most likely, estimation errors in ‘real’
word clouds are larger than our calculations, because
they contain additional sources of error such as pro-
portional fonts, variable direction of words, different
choices of colours etc. It may be that our horizon-
tal presentation of all words allowed participants to
overcome the ‘surface estimation error’ because the
words all faced the same direction, leading the partici-
pants to (correctly) use the letter height rather than the
word size to estimate the underlying frequency. Even
if this problem is corrected, interpretation is still diffi-
cult because people have trouble comparing surfaces.
Judgement is further impaired by the lack of spatial
structure applied to word clouds, with words running
at different angles, without a common reference line,
placed quasi-randomly in the plotting space. In a
sense, word clouds are similar to a line graph with
axes lacking a legend; misinterpretation is inevitable.
4.2 Limitations
We note that we did not compare the misinterpretation
of word clouds with other graphical methods. How-
ever, most other visualisation methods (e.g. token
frequency bar charts) provide exact numbers in ad-
dition to the graphical depiction, which makes these
methods less susceptible to misinterpretation. A fur-
ther objection one might raise against our methodol-
ogy is the lack of control for confounding by alter-
native variables, in particular word colour. While it
is abundantly clear that these are likely to affect sub-
jects’ ability to accurately estimate size (and there-
fore frequency) differences between printed words,
we argue that our lack of control on colour more ac-
curately represents standard use. Furthermore, an in-
teraction between scaling method and variations in
colour seems unlikely, especially as the size-colour
relationship is known to be reversed (e.g. size affects
colour assessment(Xiao et al., 2011)). Its potency as
a confounder in our analyses therefore seems limited
and allowing for ”natural” variation makes our re-
Lifting the Fog on Word Clouds: An Evaluation of Interpretability in 234 Individuals
127

sults more applicable to daily word cloud usage. Fur-
thermore, we removed responses which we deemed
too drastically divergent from the expected interpre-
tation. One could argue that these responses indicate
actual misinterpretation of frequency series, however
we are convinced a misinterpretation of the study de-
sign is a more likely explanation, thus warranting re-
moval from the main analyses. Our sensitivity anal-
yses show that this decision did not overly influence
our findings. Finally, we limited the length of the sur-
vey in order to maximise completion, which led us to
exclude any dummy questions to check user participa-
tion. By randomising the order in which clouds were
presented (after the two initial anchoring questions)
we believe to have distributed any potential drift in
attention evenly across all clouds.
4.3 Comparison with Related Work
To our knowledge, our study is the first to quantify
the guesstimation error of word clouds in a large sam-
ple size of different types of participants. Though the
cutoff for an acceptable error is subjective, we pro-
vide clear insight into the consequence on the error
of different factors, thus enabling readers to make
their own judgement. Limitations include the non-
exhaustive selection of potential influencing variables
(e.g. word angle and colour) and their interactions.
Full assessment beyond word length and frequency
sequence would have made the survey (much) longer
and would most likely have lowered completion rates.
As mentioned in section 2.1 we have made our scripts
publicly available on GitHub for their use in future
studies. A great body of work indicates a steady in-
terest in the use of word clouds and their associated
graphs, making it very relevant to investigate their
validity in qualitative assessment. Extensive review
of the entire word cloud field is beyond the scope
of the current project and would contribute little to
the great work performed by others, such as Parejo
et al.(
´
Ursula Torres Parejo et al., 2021) Alternative
work on improving the quantitative interpretability of
word clouds or on finding alternative corpus visuali-
sations will be of value to the information visualisa-
tion field. Replication of our findings in a more stan-
dardised manner might shed further light on the way
word scaling influences our comparative assessment
of word frequency.
5 CONCLUSIONS
In conclusion, word clouds can be a misleading
method to depict relative differences in frequency.
Even in simplified form, participants vary widely
in their estimates of relative word frequency. Our
method that corrects for surface area failed to im-
prove the estimations. Word clouds are decorative in-
fographics, but unsuitable for serious scientific com-
munication.
REFERENCES
Alexander, E., Chang, C.-C., Shimabukuro, M., Franconeri,
S., Collins, C., and Gleicher, M. (2018). Percep-
tual biases in font size as a data encoding. IEEE
Transactions on Visualization and Computer Graph-
ics, 24:2397–2410.
Bayrak, S. B., Villwock, J. A., Villwock, M. R., Chiu, A. G.,
and Sykes, K. J. (2019). Using word clouds to re-
envision letters of recommendation for residency ap-
plicants. Laryngoscope., 129(9):2026–2030.
Chi, M. T., Lin, S. S., Chen, S. Y., Lin, C. H., and Lee, T. Y.
(2015). Morphable word clouds for time-varying text
data visualization. IEEE Trans. Vis. Comput. Graph,
21(12):1415–26.
Fellows, I. (2018). CRAN – Package wordcloud. CRAN.r-
project.org.
Hearst, M. A., Pedersen, E., Patil, L., Lee, E., Laskowski,
P., and Franconeri, S. (2020). An evaluation of seman-
tically grouped word cloud designs. IEEE Trans. Vis.
Comput. Graph, 26(9):2748–2761.
Medelyan, A. (2016). Why word clouds harm insights. Get-
TheMatic.com.
Mueller, A. (2015). wordcloud · PyPI. PyPI.org.
´
Ursula Torres Parejo, Campa
˜
na, J. R., Vila, M. A., and Del-
gado, M. (2021). A survey of tag clouds as tools for
information retrieval and content representation. In-
formation Visualization, 20(1):83–97.
Sellars, B. B., Sherrod, D. R., and Chappel-Aiken, L.
(2018). Using word clouds to analyze qualitative data
in clinical settings. Nurs. Manage, 49(10):51–53.
Stott, A., Zamoyski, S., and Alberti, H. (2018). Word
clouds: presenting student feedback to clinical teach-
ers. In Med, pages 1208–1209. uc, vol. 52, no. 11.
Temple, S. (2019). Word Clouds Are Lame. TowardsData-
science.com.
Vanstone, M., Toledo, F., Clarke, F., Boyle, A., Giaco-
mini, M., Swinton, M., Saunders, L., Shears, M., Zy-
taruk, N., Woods, A., Rose, T., Hand-Breckenridge,
T., Heels-Ansdell, D., Anderson-White, S., Sheppard,
R., and Cook, D. (2016). Narrative medicine and
death in the icu: word clouds as a visual legacy. BMJ
Support Palliat. Care, Nov, 2016:2016–00117.
Wang, Y., Chu, X., Bao, C., Zhu, L., Deussen, O., Chen,
B., and Seldmai, M. (2017). Edwordle: Consistency-
preserving word cloud editing. IEEE Trans. Vis. &
Comp. Graphics (Proc. IEEE Information Visualiza-
tion (Infovis) 2017).
Xiao, K., Luo, M. R., Li, C., Cui, G., and Park, D. (2011).
Investigation of colour size effect for colour appear-
ance assessment. Color Research & Application,
36(3):201–209.
IVAPP 2022 - 13th International Conference on Information Visualization Theory and Applications
128
