
Virtual Reality Ontology Object Manipulation (VROOM)
Margarita Vinnikov
1
, Daniel Vergilis
1
, Uras Oran
1
and James Geller
2
1
Department of Informatics, New Jersey Institute of Technology, Newark, U.S.A.
2
Department of Data Science, New Jersey Institute of Technology, Newark, U.S.A.
Keywords:
Virtual Reality, 3D, Medical Ontology.
Abstract:
Biomedical ontologies are considered important repositories of knowledge about the medical domain and
related fields. They are best thought of as node-link networks, where each node represents one single (medical)
concept and links express binary relationships between pairs of concepts. The most important relationship
(“IS-A”) is used to form a generalization hierarchy among the concepts. Visualizing and manipulating such a
network when it includes more than a few hundred nodes can be challenging. This paper presents a new system
called VROOM (Virtual Reality Ontology Object Manipulation) that supports browsing and interaction with a
biomedical ontology in a virtual 3-D space, enabling more natural and realistic interaction with and navigation
through the ontology network.
1 INTRODUCTION
Biomedical ontologies are considered important
repositories of knowledge about the medical domain
and many related fields. The BioPortal web repository
(Stanford NCBO, 2021) contains 891 such ontolo-
gies and terminologies. Medical ontologies are best
thought of as node-link networks where each node
represents one single (medical) concept and links ex-
press binary relationships between pairs of concepts.
Ontologies may be represented as text or as diagrams.
Text is often inadequate because it hides important
structural features of the concept networks, e.g., when
a concept has several parent concepts. However, on-
tologies are usually entered into a computer by us-
ing a text-oriented editor. The most popular ontology
editor in the US is Protege, also created at Stanford
(Stanford Biomedical Informatics Research, 2021).
Diagrams are preferable for small ontologies, as
they show structural features better than text. How-
ever, ontologies are most useful when they represent a
large slice of a domain of the real world. Furthermore,
they have to follow certain structural rules. Thus, real
world ontology diagrams are large in size and com-
plicated in structure. This makes the diagrams over-
whelming and the ontologies difficult to understand.
As text is an even worse option, we are looking for
methods to make the diagram representation useful
even for large and complex ontologies.
In order to carry over the advantages of graphical
network representations to large, realistic ontologies,
we propose to make use of the power of adding a third
dimension and Virtual Reality (VR) to the graphical
display. We have designed and implemented a new
system that supports ontology exploration and manip-
ulation in interactive virtual space. Section 2 reviews
related work. In Section 3, we introduce the Virtual
Reality Ontology Object Manipulation (VROOM) ap-
plication that we have developed for Oculus headset
technology. Section 4 mentions limitations and Sec-
tion 5 contains our conclusions.
2 RELATED WORK
The idea of adding a third dimension to the visualiza-
tion and manipulation of network diagrams has been
investigated before, e.g., by (Robertson et al., 1991),
who created rotating cone trees, which added the pos-
sibility of dynamic manipulation to the display. How-
ever, the resultant image was still projected onto a 2-D
plane and was not optimized for medical ontology dis-
play, which requires the layout of many concepts with
multiple parents. Furthermore, manipulation of the
cone tree was accomplished with standard computer
hardware (mouse and keyboard) and the viewing an-
gle of the user was limited to the size of her screen.
(Morrey et al., 2009) created a hybrid display method
for medical ontologies. By dividing the screen into a
focus concept and its neighborhood, with easy navi-
Vinnikov, M., Vergilis, D., Oran, U. and Geller, J.
Virtual Reality Ontology Object Manipulation (VROOM).
DOI: 10.5220/0010787700003123
In Proceedings of the 15th International Joint Conference on Biomedical Engineering Systems and Technologies (BIOSTEC 2022) - Volume 5: HEALTHINF, pages 361-368
ISBN: 978-989-758-552-4; ISSN: 2184-4305
Copyright
c
2022 by SCITEPRESS – Science and Technology Publications, Lda. All rights reserved
361

gation to other focus concepts, they implemented the
Neighborhood Auditing Tool (NAT). NAT was suc-
cessful at viewing localized areas of an ontology, but
it did not provide the “big picture view” of the whole
ontology structure. A different approach to ontology
visualization was taken by (Zheng et al., 2017a; Ochs
et al., 2016; Zheng et al., 2017b). They developed
several summarization methods for medical ontolo-
gies, including a multi-granularity display approach.
While this created much better visualizations, the dis-
plays were not intuitive without studying the theory
of abstraction networks (Wang et al., 2012; Halper
et al., 2015), which cannot be expected from casual
users. There is no evidence that these methods have
been adopted by the community.
To overcome these issues in our project, we nav-
igate the ontology structure in 3-D using a VR ap-
proach. Thus, the viewer is not limited to a flat sur-
face with a graph layout on a screen, but can liter-
ally ”walk through” the knowledge structure. Modern
VR goggles and powerful driver computers can cre-
ate a good approximation of this navigation in 3-D
space. Furthermore, users have ambidextrous access
with two hand-held controllers to virtual objects (con-
cept nodes, relationships) as opposed to using one
mouse, making it easier to manipulate the objects in
a natural manner. Controllers also have more buttons
than a standard three-button mouse, adding degrees of
liberty to the manipulation.
2.1 Virtual Reality (VR)
In recent years, VR has become a rapidly develop-
ing technology that has been used in many industries
and domains (Chuah, 2018). Partially this can be at-
tributed to the fact that the head-worn devices have
become lighter and by a magnitude cheaper than the
traditional VR technology. Both VR and Augmented
Reality (AR) solutions have been widely used in the
medical field (Roberts et al., 1986; Pensieri and Pen-
nacchini, 2016), e.g., for medical diagnosis, medical
procedures, education, etc. Thus it is natural that VR
technology could be extended to medical ontology ex-
ploration and management. There are numerous ben-
efits of the VR paradigm, such as the utilization of
the space around the user and natural models of inter-
actions that are not available in standard PC settings.
Yet moving a data visualization from a 2-D paradigm
into VR can be challenging, as this is a novel and
emerging technology. Furthermore, there are no es-
tablished solutions for such applications. Nonethe-
less, we view our work as part of the Situated An-
alytics (SA) (ElSayed et al., 2015) framework, that
utilizes the idea of data representation in relevance to
people, objects, and places for “understanding, sense-
making, and decision-making” (Thomas et al., 2018).
Such approaches have proven to be beneficial for spa-
tial memory tasks (Gao et al., 2018) and analytical
tasks (Ens and Irani, 2016). Yet, in order for such an
application to be successful, it has to use an appro-
priate metaphor that supports natural and intuitive in-
teractions. For example, the curved “virtual cockpit”
(Ens et al., 2014) supports different types of content
to be spaced out around the user, such that she can
easily interact with different content objects utilizing
the 3-D space around her. Similarly, Liu et al. (Liu
et al., 2020) have explored an adaptation of 2-D visu-
alizations into 3-D VR. They incorporated a “shelves”
metaphor to organize data into various configurations.
Their user studies revealed that for small sets of data
visualization items, a flat layout is preferable. On the
other hand, with an increasing number of visualiza-
tions, the user’s preference changes to a semi-circular
layout, as this better utilizes the properties of the vi-
sual field and minimizes the distance between the user
and each displayed visualization.
The design of a visualization method needs to
keep in mind the task(s) expected of its users. Dif-
ferent affordances are required when a pure browsing
task is provided for, as opposed to an environment
that requires extensive manipulation of the VR ob-
jects. Visualizations of ontologies are often created
for purposes that go beyond comprehension and in-
clude error detection, error correction, and periodic
scheduled extension with new content (e.g., concepts
for new diseases, such as COVID). For this purpose,
a VR environment has the additional advantage that
objects in the virtual world can be manipulated with
two hands using appropriate multi-button manipula-
tors, as opposed to the single-handed use of a com-
puter mouse. To achieve these ambidextrous 3-D af-
fordances, we have implemented a software system
that allows for navigation through ontologies and di-
rect manipulation of its nodes and links with realistic
virtual tools such as scissors and glue sticks.
3 IMPLEMENTATION
VROOM provides a convenient process of displaying
and manipulating large data structures in a VR en-
vironment. The system can be used to visualize ex-
tensive biomedical ontologies and allows users to ex-
amine and interact with the ontology objects through
real-world metaphors.The system provides the best
user experience when a user wears an Oculus Rift or
a Quest headset. The software utilizes Unity’s XR
Interaction Toolkit Package for VR support (Unity
HEALTHINF 2022 - 15th International Conference on Health Informatics
362

Technologies, 2020). The following subsections will
review the implementation specifics of the key fea-
tures of the system.
3.1 Graph Structure
In most ontologies, the entities are referred to as con-
cepts or classes. The most important kind of relation-
ship is called the IS-A relationship. It is drawn as an
arrow that expresses that the concept at its tail end
is more specific than the concept at its head. Thus
“Lung” is more specific than “Organ,” and we say that
“Lung IS-A Organ” when an IS-A relationship exists
between these two concepts. Concepts and IS-A re-
lationships together either form a tree or a Directed
Acyclic Graph (DAG).
In a tree, every concept has exactly one parent,
except for a concept called the root, which has no
parents. Tree-shaped ontologies are computationally
easier to deal with, but they do not reflect the world
well. In a DAG, every concept may have one or more
than one parent, except for the root(s). To express the
fact that Viral Pneumonia is both a Viral Disease and
a Lung Disease, it is necessary to assign two parents
to Viral Pneumonia (Figure 1). Even in most DAG
ontologies, there is a single root.
Figure 1: The ontology concept Viral Pneumonia with two
parents.
Besides IS-A relationships, an ontology may have
hierarchical part-of relationships and other so-called
“lateral” relationships (location-of, causes, treats,...).
As these greatly complicate processing, we will omit
them in this paper.
3.1.1 Graph Design
To provide easy and clean implementation of the net-
work visualization, we divided the implementation
into two parts. The back end supports reading in on-
tologies and saving them to a file. It handles node
storage, manipulation, and search. The front end
modules are responsible for navigation, user inter-
face (UI), and interaction with Node Objects and the
connecting edges. This approach supports easy code
maintenance and readability and minimizes the num-
ber of bugs. Figure 2 shows that both nodes and links
(or as they are formally known in graph theory, edges)
are implemented as classes and are inheriting from a
generic graph class that is responsible for basic mod-
ification and enumeration of the data structure. The
nodes and edges are responsible for maintaining in-
dividual connections. Specifically, the node objects
store the properties of the ontology data and keep a
list of edges connected to them in an adjacency list,
which is more efficient than the adjacency matrix ap-
proach. This is the case because most ontologies are
sparse, i.e., they do not nearly have as many as the
possible n
2
relationships. Since the edges are also
defined as objects, they can store information about
the relationship, including the start and end nodes,
weight, and (bi)directionality, and store custom prop-
erties pertaining to the specific ontology, when nec-
essary. For this version of the VROOM system im-
plementation, a Tree class was defined as a subset of
the generic graph to facilitate certain layout manipu-
lations described below. With a tree structure, data is
guaranteed to be composed of nodes with a single par-
ent (except for the root) and n-children with unidirec-
tional relationships, which can be taken advantage of
with features such as sub-tree collapsing/expanding.
Yet, by using a generic graph data structure under-
neath a VR-focused visualizer, we have a platform to
build additional features into future versions.
A proper layout must be used to provide the best
visualization experience while taking advantage of
the 3-D space. An optimal layout would utilize as
much space around the user as possible to minimize
any movement required in VR. Hence, a radial lay-
out is best to satisfy these requirements. Thus, we
follow the previously mentioned cone tree paradigm,
but in VR. Specifically, to create the radial layout,
the root node is first placed at the center of the vi-
sual space (Figure 3). The area around the root node
is allocated in sectors to each of its children based
on their numbers of descendants, similar to the al-
gorithms described in the Related Work Section on
the hyperbolic browser (Lamping and Rao, 1996). In
polar coordinates, each child of the root is placed in
the middle of its sector between (θ
a
, θ
b
) and at a dis-
tance r away from the root, where r increases at each
depth. This algorithm is applied recursively through
each sub-tree, where the sector bounds of the sub-
tree lie within the bounds defined by its parent. Each
level of the radial layout is farther away from the root
plane to bring the layers visually closer to the user. A
feature of this layout algorithm is that descendants of
Virtual Reality Ontology Object Manipulation (VROOM)
363
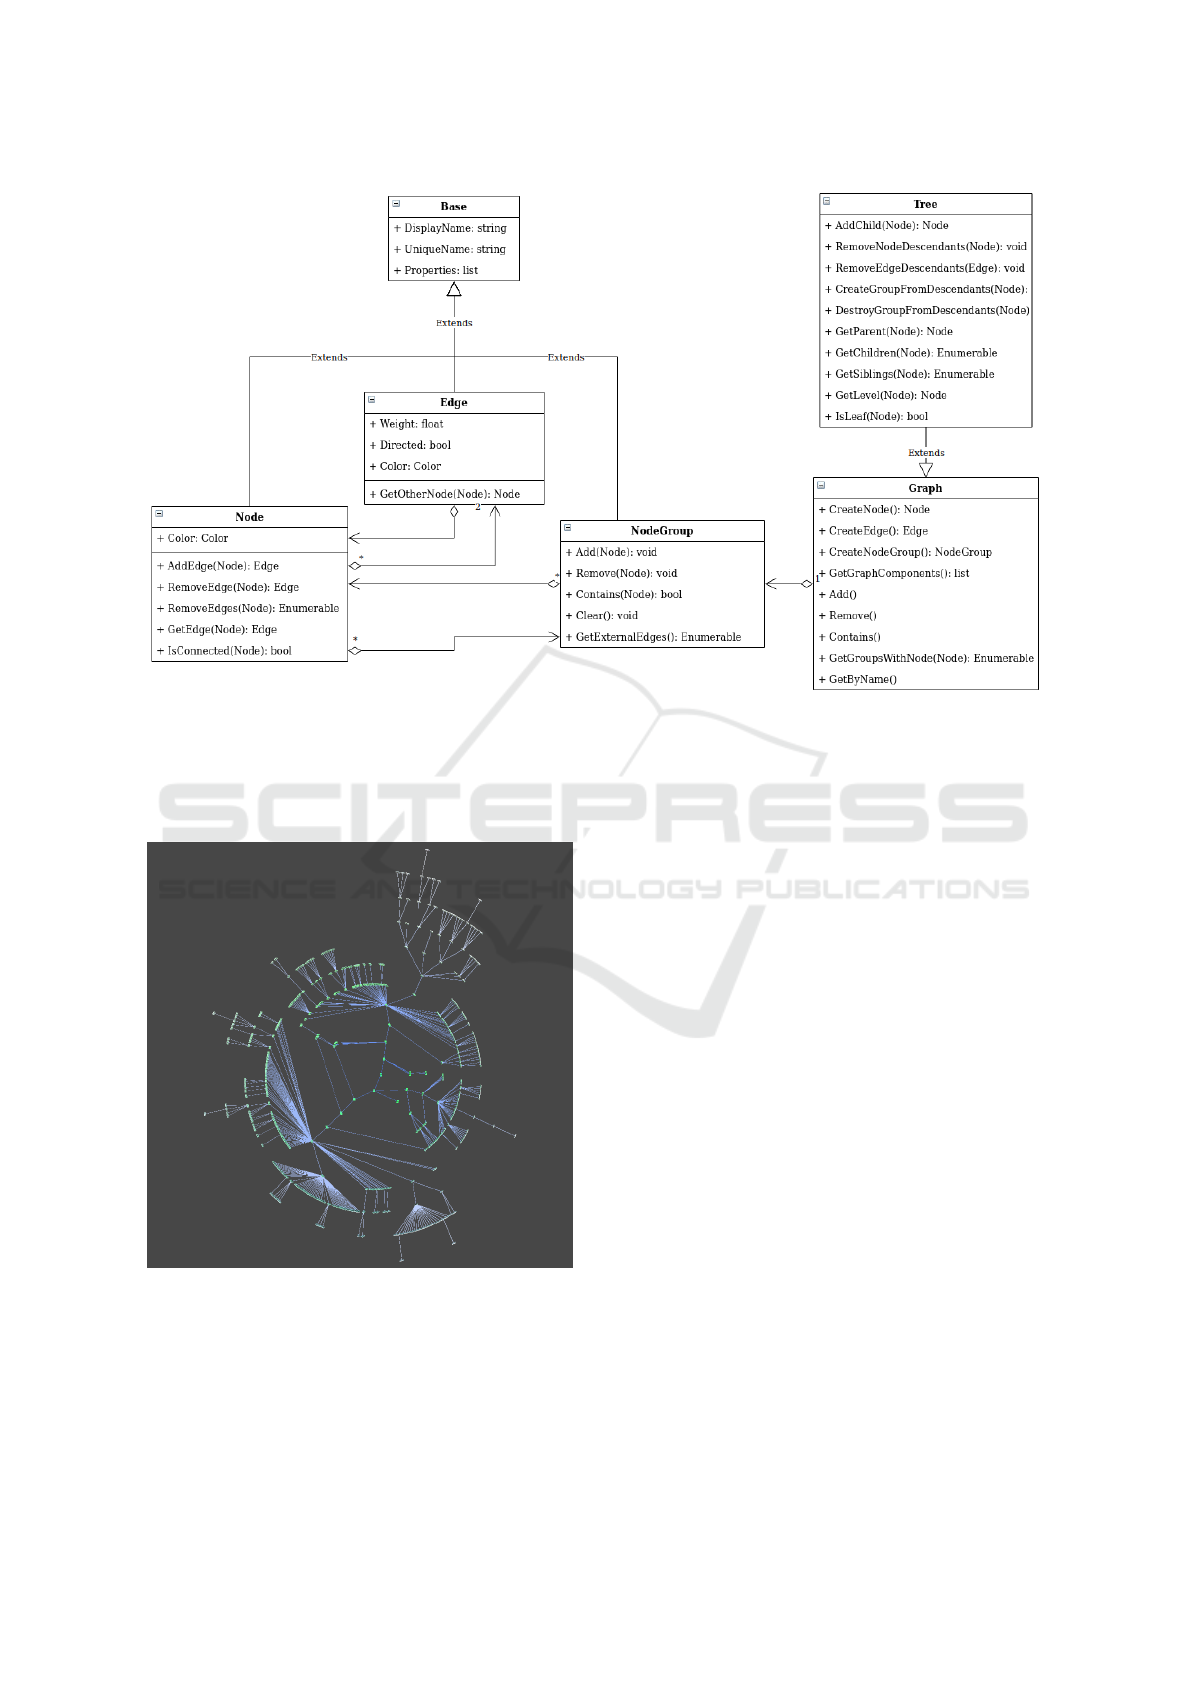
Figure 2: Graph Class Diagram.
sub-trees spread out more as the depth increases since
the radius of each level naturally increases. We can
also curve this layout around the user to maximize the
data perceptible in the user’s field of view.
Figure 3: An ontology in a radial layout tree form as seen
from afar.
3.2 VR Features
In order to make the user experience as naturalistic
and intuitive as possible, we have implemented the
following features, describe in the following subsec-
tions: The virtual platform 3.2.1 includes the cart
3.2.2, the scope 3.2.3, the scissors 3.2.4, the glue tool
3.2.5, the file reader 3.2.6 and the garbage bin 3.2.7.
The system implements interaction features describe
in Subsection 3.3.
3.2.1 Virtual Platform
The virtual platform serves the user as a working
space. It includes many virtual items that she can uti-
lize while working with an ontology, such as a cart
(section 3.2.2) that can contain nodes and other in-
teraction tools, and a garbage bin (section 3.2.7) that
has all the nodes that (temporarily) do not connect to
any edges. The second purpose of the virtual platform
is to move/fly through the ontology for browsing and
exploration or for advancing from node to node when
specific paths or nodes are of interest. Movements in
VR space can be performed by using the two hand-
held Oculus controllers.
3.2.2 Cart
The cart metaphor is one of the key ideas in the
VROOM system, and most of the user interactions
revolve around the cart. The first functionality of the
cart is to collect/store nodes that have been detached
from a tree and need to be moved to a different lo-
cation. The second function associated with the cart
is that it anchors all other direct manipulation tools,
HEALTHINF 2022 - 15th International Conference on Health Informatics
364
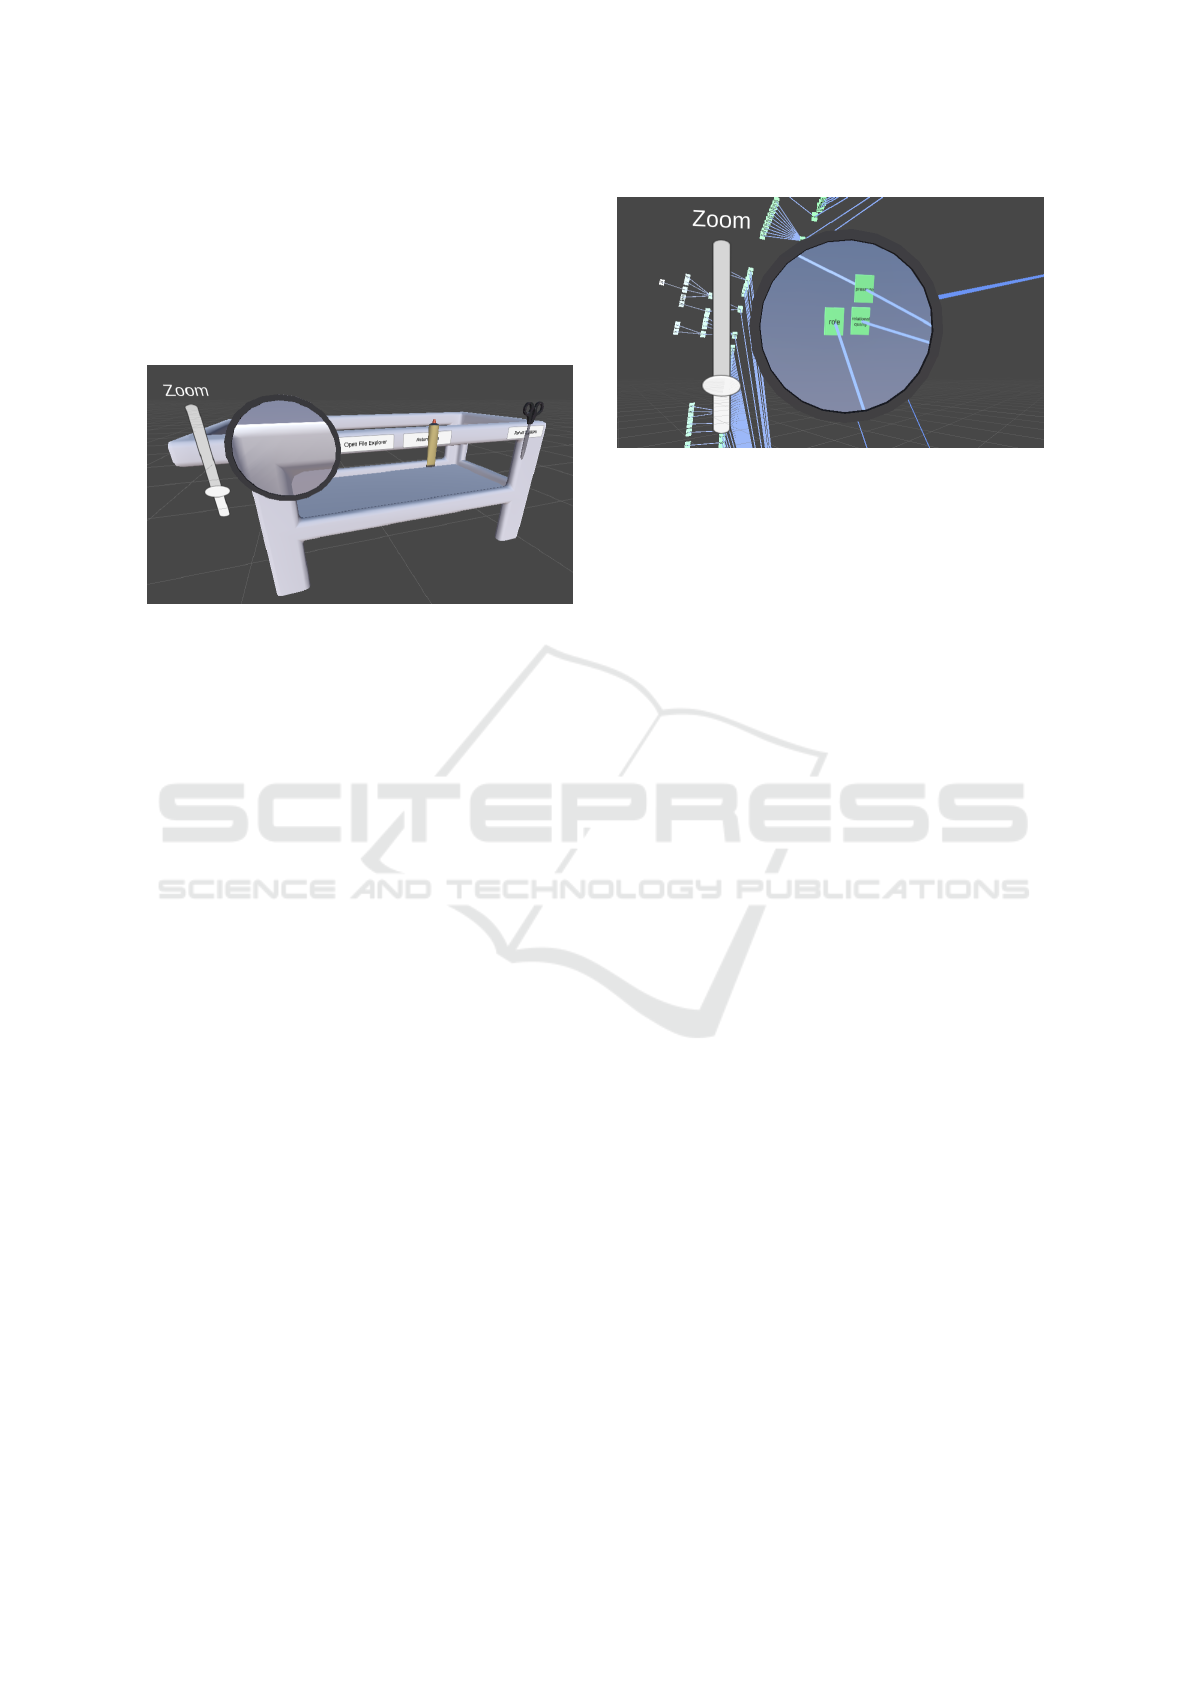
as shown in Figure 4. These will be discussed in the
following subsections. Furthermore, there are buttons
on the cart that “teleport” any lost tools back to their
initial positions. Finally, several additional buttons on
the cart allow opening a file dialog to load ontology
files from disk and save modified ontologies back to
permanent storage.
Figure 4: The cart that holds the user’s tools and can carry
any nodes of interest. Nodes that are grabbed from the en-
vironment and placed into the cart are carried with the user.
Tools from left to right: scope, glue, and scissors.
3.2.3 Scope
The scope tool (Figure 5) is used to examine nodes at
a distance, so the user does not need to move closer
in VR space to determine whether they are of interest.
This is useful when the user needs to decide which
sub-tree she needs to dig deeper into, and it is more
convenient to make this decision from one spot than
to travel to multiple locations while searching for the
correct node(s). The scope has a dynamic variable
zoom feature that allows for the examination of ob-
jects at varying distances. This feature uses the UI
slider to change the field of view of the camera. When
adjusting the slider, the scope will zoom in and out
(codemeariver, 2017).
A special texture, called a render texture, allows
the camera to project its vision onto an entity mod-
eled with the texture. The texture from a renderer is
set as the target texture for the camera in the scene to
vary the size of the field of you of the scope. Hence,
by varying the distance of a secondary camera, one
can change the size of a distant object that one is in-
terested in examining.
3.2.4 Scissors
The scissors tool is an object that can be accessed on
the cart by the grab function on one VR controller.
The scissors script is responsible for cutting edges be-
tween nodes. The cutting action is displayed as an an-
imation when the user pushes the appropriate button
on the VR controller. Cutting an IS-A link is done
Figure 5: The scope zoomed in on a specific subset of the
ontology.
with the following steps involving the scissors tool:
1. Pick up the scissors with the grab button on the
VR controller (back trigger is used for this).
2. Hover over an edge (IS-A link), causing the edge
to be highlighted in red.
3. Perform the trigger selection by pressing the trig-
ger to cut the highlighted edge.
3.2.5 Glue
The glue tool is an interactable object that can be ac-
cessed on the cart by the grab function on a VR con-
troller. The tool functions as the inverse of the scissors
and is responsible for the creation of a new edge be-
tween two nodes when performing the gluing action
with the trigger on the VR controller.
Creating a relationship between two nodes by in-
serting an edge between them can be done using the
glue tool as follows:
1. Pick up glue tool with the grab button on a VR
controller.
2. Hover with the glue over a node, causing it to be
highlighted in white.
3. Perform the trigger selection by pressing and
holding the trigger to create the parent end of the
edge.
4. While still holding the trigger, move to the desired
child node of the relation and release the trigger
button while hovering over the second node (the
selected child node).
5. The two nodes should now have a connecting IS-
A link from the child to the parent.
3.2.6 File Reader/Ontology Loader
Loading an ontology is done by opening the file ex-
plorer located at the center of the cart and selecting
Virtual Reality Ontology Object Manipulation (VROOM)
365
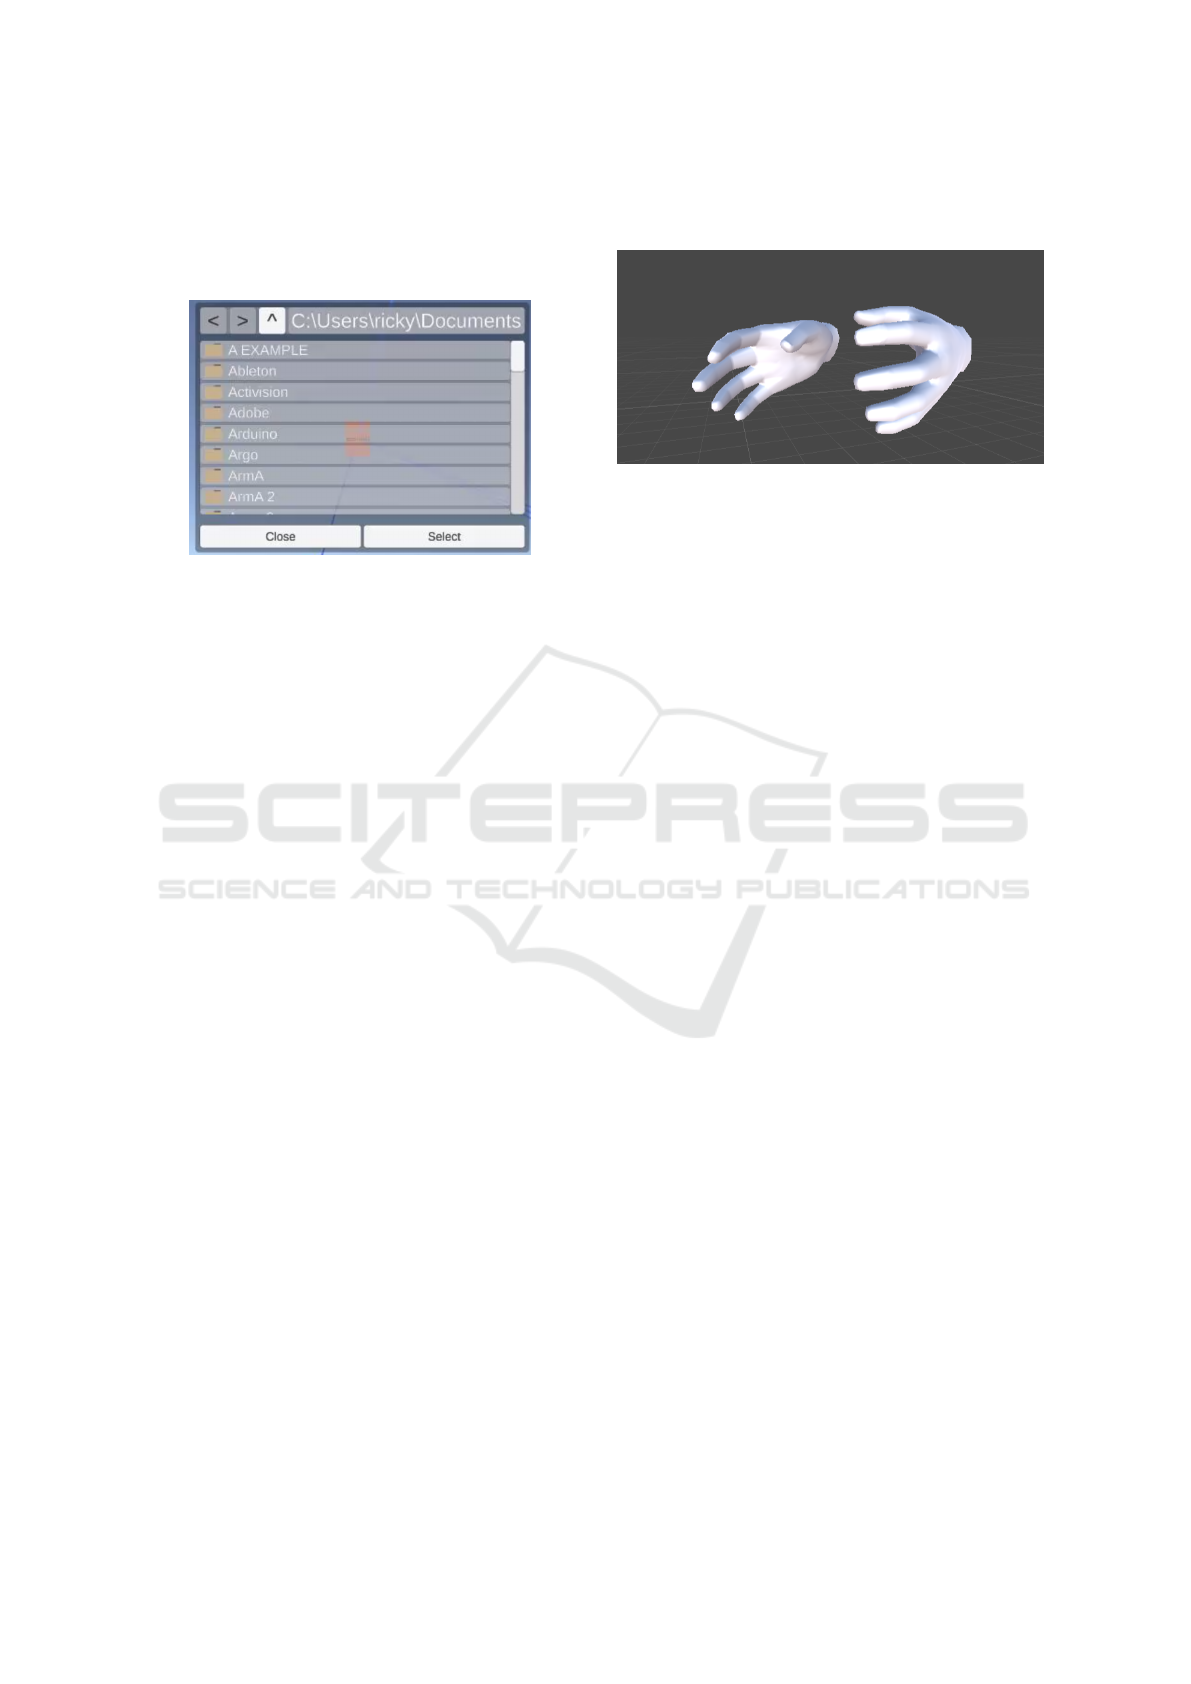
a file to open by pressing the trigger on the VR con-
troller. The file reader takes a .csv file that contains
the ontology data and loads it into a graphical tree
structure in the VR environment.
Figure 6: File explorer UI.
3.2.7 Tree Validation and Garbage Collection
Ontology trees are validated when loaded, and any
orphaned or invalid nodes are automatically placed
in the garbage bin. Nodes can also be put into the
garbage bin using the VR controllers. The user can
review the list of nodes places inside the garbage bin
to decide whether to keep a node there or retrieve it
into the working space to find an appropriate parent
and/or child(ren) for this specific node.
3.3 Interaction
There are four different types of interactions that the
user can engage in:
• Raycast: A hand that uses the XRRayInterac-
tor(Unity Technologies, 2019) to allow for manip-
ulation of interactable objects in Unity.
• Typing: A version of the Raycast hand that is in-
visible and shortened to the length of the pointer
finger for easier use with UI interactions not re-
quiring hands.
• Interacting Hand: An action-based controller
that uses the direct interactor to interact with the
interactable objects.
• Hand Controller (Device-based): This hand is a
part of the Hand Controller Uses Hand controller
and is used for the sole purpose of animating
the Custom hands from the Oculus VR package
with the Hand Anim script (Facebook Technolo-
gies, ). Set the interactor’s Select Action Trigger
to State to have this fully working with the anima-
tion script.
This component is put on the Oculus VR package’s
hand model and is then set up using the animator from
that same package and the Device-based controller
mentioned in the previous section.
Figure 7: A pair of hands that are controlled in VR for ontol-
ogy manipulation. Hand model from the Oculus Integration
package (Facebook Technologies, ).
3.3.1 Gestures
We have implemented two gestures – an expand ges-
ture and a collapse gesture. Specifically, nodes can be
collapsed into groupings to minimize the total num-
ber of nodes onscreen at the same time. Collapsing
parts of the tree structure only impact the ontology
visually. Collapsing and expanding are complemen-
tary gestures and have a similar operational concept.
When both triggers on a controller are pulled, the
midpoint of the two hands is found. If this midpoint is
within a specific range of a Node or NodeGroup, then
that object is selected. Then, the distance between
the two hands is checked to ensure that they are far
enough apart (in the case of the collapse gesture) or
close enough together (in the case of the expand ges-
ture). If the user’s hand placement is valid, the corre-
sponding gesture is started, and the selected object is
highlighted. Whenever the triggers are released, the
midpoint of the hands is again calculated, and the dis-
tance to the selected object is checked; if the mid-
point is too far from the selected object, then the ges-
ture is canceled. Otherwise, the distance between the
hands is checked to ensure that they are close enough
together (in the case of the collapse gesture) or far
enough apart (in the case of the expand gesture). If the
user’s final hand placement is valid, the active gesture
is completed, the action is performed, and the object
stopped being highlighted. Whenever a gesture is in
progress, the midpoint of the hands is calculated, and
the distance to the selected object is checked. The
highlight is removed if the midpoint is too far from
the chosen object; otherwise, the object remains high-
lighted. This is to provide visual feedback for the cur-
rent status of the gesture.
HEALTHINF 2022 - 15th International Conference on Health Informatics
366
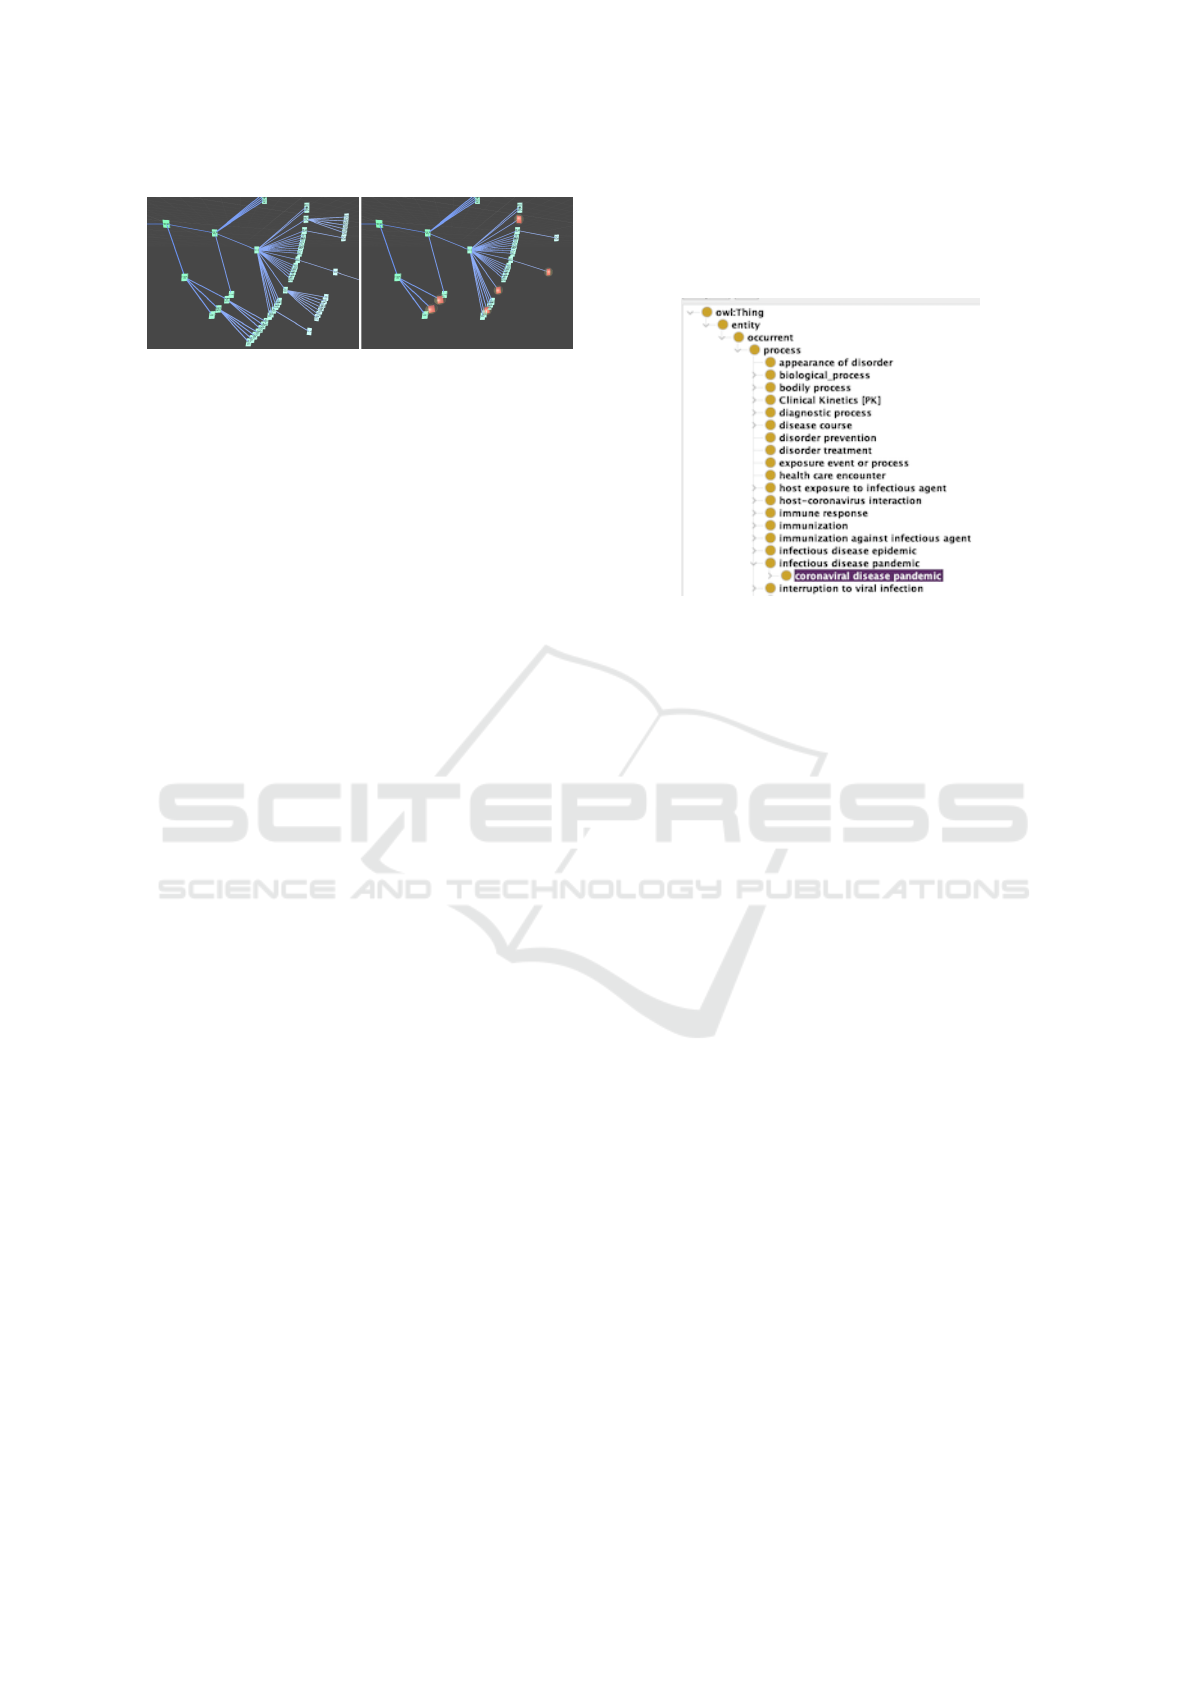
Figure 8: Left: Branch with subtrees. Right: Same branch
with some collapsed subtrees (the collapsed nodes are in
red).
3.3.2 Keyboard
A 3-D keyboard was created to efficiently change
node property data and perform search queries while
using VR controllers. The keyboard automatically ap-
pears when a textbox is selected with the VR con-
trollers and allows users to type directly into the
textbox without needing to switch to a physical key-
board. The keyboard disappears when typing is com-
pleted in order not to clutter up the environment. This
feature is also used for modifying ontology data or
performing search queries on the fly while remaining
in the VR environment.
3.4 Search
Search functionality is one of the critical features of
the entire ontology manipulation system. The search
is implemented using a UI window where the user can
enter keywords she is interested in by utilizing the vir-
tual keyboard. Nodes with the corresponding terms
are highlighted in red in the VR space for easy recog-
nition. An inverted index was created on the nodes’
data properties to find appropriate matches quickly.
The user is then can be teleported to the required node
to continue the intended investigation.
4 RESULTS
To test the functionality of VROOM, we needed a
moderately sized biomedical ontology that would be
considered to be of “wider interest.” CIDO, the Coro-
navirus Infectious Disease Ontology, fulfilled both
these requirements (He and et al., 2020). CIDO is
available for download at (Stanford NCBO, 2021).
Currently it contains 8,775 classes. Due to the ur-
gency caused by the COVID pandemic, CIDO has
been growing rapidly. At the time when we down-
loaded it, its size was slightly above 6,000 classes.
With CIDO we ascertained the functionality of the
tools described above, however, response times were
slow. Subsequently we developed a subset of CIDO
for experiments with human subjects. A partial view
of this subset is shown in Protege format in Figure 9.
After loading CIDO into Protege we exported it into
a .csv file that we used as the load file for VROOM.
Figure 9: A subset of CIDO in Protege format.
4.1 Future Work
We are currently in the process of conducting a user
study in terms of evaluating the system’s usability and
functionality. Preliminary results show that the users
enjoyed the system. During a recall test, one user
stated that he was visualizing the ontology in the for-
mat that he had seen in VR in order to answer the
questions. This is a promising observation and we
plan to have quantitative results in a forthcoming pa-
per.
5 CONCLUSIONS
In this paper, we have demonstrated an example of
a biomedical ontology visualization system based on
VR. We have leveraged the power of VR to make
the interaction modalities as natural as possible. Our
long-term goal is to extend VROOM for multi-user
interaction to enable collaborative ontology editing in
VR. We will increase the number of available gestures
that a user can utilize to interact with the system in
the near term. We will also add new features, such as
more sophisticated search and navigation functionali-
ties. We are currently preparing a usability study with
students and medical experts to evaluate VROOM’s
key features with novices and expert users alike.
ACKNOWLEDGEMENTS
Thanks to the development team of the Virtual On-
tology: Jordan Sefa, Uras Oran, Jacob Hayne, Daniel
Virtual Reality Ontology Object Manipulation (VROOM)
367

Vergilis, Tyler DeMarco, and Ahmed Zaheen Abdul
Farid, Nicholas Patterson, and Pranathi Pothukanuri.
REFERENCES
Chuah, S. H.-W. (2018). Why and who will adopt extended
reality technology? literature review, synthesis, and
future research agenda. Literature Review, Synthesis,
and Future Research Agenda (December 13, 2018).
codemeariver (2017). Making a sniper scope in
vr. https://codemeariver.wordpress.com/2017/06/30/
making-a-sniper-scope-in-vr/.
ElSayed, N., Thomas, B., Marriott, K., Piantadosi, J., and
Smith, R. (2015). Situated analytics. In 2015 Big Data
Visual Analytics (BDVA), pages 1–8.
Ens, B. and Irani, P. (2016). Spatial analytic interfaces: Spa-
tial user interfaces for in situ visual analytics. IEEE
computer graphics and applications, 37(2):66–79.
Ens, B. M., Finnegan, R., and Irani, P. P. (2014). The
personal cockpit: a spatial interface for effective task
switching on head-worn displays. In Proceedings of
the SIGCHI Conference on Human Factors in Com-
puting Systems, pages 3171–3180.
Facebook Technologies. Import oculus integration pack-
age. https://developer.oculus.com/documentation/
unity/unity-import.
Gao, B., Kim, H., Kim, B., and Kim, J.-I. (2018). Artifi-
cial landmarks to facilitate spatial learning and recall-
ing for curved visual wall layout in virtual reality. In
2018 IEEE International Conference on Big Data and
Smart Computing (BigComp), pages 475–482. IEEE.
Halper, M., Gu, H., Perl, Y., and Ochs, C. (2015). Abstrac-
tion networks for terminologies: Supporting man-
agement of big knowledge. Artificial Intelligence in
Medicine, 64(1):1–16.
He, Y. and et al. (2020). CIDO, a community-based ontol-
ogy for coronavirus disease knowledge and data inte-
gration, sharing, and analysis. Sci Data, 7(181).
Lamping, J. and Rao, R. (1996). The hyperbolic browser:
A focus 1 context technique for visualizing large hier-
archies. Journal of Visual Languages and Computing,
7:33–55.
Liu, J., Prouzeau, A., Ens, B., and Dwyer, T. (2020). Design
and evaluation of interactive small multiples data visu-
alisation in immersive spaces. In 2020 IEEE Confer-
ence on Virtual Reality and 3D User Interfaces (VR),
pages 588–597.
Morrey, C. P., Geller, J., Halper, M., and Perl, Y. (2009).
The Neighborhood Auditing Tool: a hybrid interface
for auditing the UMLS. Journal of Biomedical Infor-
matics, 42(3):468–489.
Ochs, C., Geller, J., Perl, Y., and Musen, M. A. (2016).
A unified software framework for deriving, visualiz-
ing, and exploring abstraction networks for ontolo-
gies. Journal of Biomedical Informatics, 62:90–105.
Pensieri, C. and Pennacchini, M. (2016). Virtual reality in
medicine. In Handbook on 3D3C Platforms, pages
353–401. Springer.
Roberts, D. W., Strohbehn, J. W., Hatch, J. F., Murray, W.,
and Kettenberger, H. (1986). A frameless stereotaxic
integration of computerized tomographic imaging and
the operating microscope. Journal of neurosurgery,
65(4):545–549.
Robertson, G. G., Mackinlay, J. D., and Card, S. K. (1991).
Cone trees: animated 3d visualizations of hierarchical
information. In Proceedings of the SIGCHI confer-
ence on Human factors in computing systems, pages
189–194.
Stanford Biomedical Informatics Research (2021). Protege.
https://protege.stanford.edu/.
Stanford NCBO (2021). BioPortal. https://bioportal.
bioontology.org/.
Thomas, B. H., Welch, G. F., Dragicevic, P., Elmqvist, N.,
Irani, P., Jansen, Y., Schmalstieg, D., Tabard, A., El-
Sayed, N. A., Smith, R. T., et al. (2018). Situated
analytics. Immersive analytics, 11190:185–220.
Unity Technologies (2019). Class xrsocketinterac-
tor. https://docs.unity3d.com/Packages/com.unity.
xr.interaction.toolkit@0.0/api/UnityEngine.XR.
Interaction.Toolkit.XRSocketInteractor.html.
Unity Technologies (2020). Xr interaction toolkit.
https://docs.unity3d.com/Packages/com.unity.xr.
interaction.toolkit@0.9/manual/index.html.
Wang, Y., Halper, M., Wei, D., Perl, Y., and Geller, J.
(2012). Abstraction of complex concepts with a re-
fined partial-area taxonomy of snomed. Journal of
Biomedical Informatics, 45(1):15–29.
Zheng, L., Ochs, C., Geller, J., Liu, H., Perl, Y., and
de Coronado, S. (2017a). Multi-layer big knowl-
edge visualization scheme for comprehending neo-
plasm ontology content. In ICBK, pages 127–134.
Zheng, L., Perl, Y., Elhanan, G., Ochs, C., Geller, J., and
Halper, M. (2017b). Summarizing an ontology: A
big knowledge coverage approach. Studies in Health
Technol. Inform., 245:978–982.
HEALTHINF 2022 - 15th International Conference on Health Informatics
368
