
12-Lead ECG Reconstruction via Combinatoric Inclusion of Fewer
Standard ECG Leads with Implications for Lead Information and
Significance
Utkars Jain
1 a
, Adam A. Butchy
1 b
, Michael T. Leasure
1 c
, Veronica A. Covalesky
2,3
,
Daniel Mccormick
2,3
and Gary S. Mintz
4 d
1
Heart Input Output Inc., 128 N. Craig Street, Suite 406, Pittsburgh, U.S.A.
2
Cardiology Consultants of Philadelphia, Philadelphia, Pennsylvania, U.S.A.
3
Jefferson University Hospital, Philadelphia, Pennsylvania, U.S.A.
4
The Cardiovascular Research Foundation, New York, U.S.A.
Keywords:
ECG, Limited Lead Systems, ECG Synthesis, ECG Reconstruction.
Abstract:
The electrocardiogram (ECG) is the most widely used, non-invasive, cardiovascular test. There exist many
lead variations including a one, three, six, and 12-lead device. In this work, we use ECGio, a validated
deep learning model for the assessment of coronary artery disease, to reconstruct ECG signals with various
combinations of leads, ranging from a single lead, to the full 12-leads. We are able to show 0.6536 R
2
, and
0.0747 mean absolute error (MAE) in the accurate reconstruction of a full 12-lead signal from just lead II.
We go one step further and look at which individual leads, and in what combinations, yield the most accurate
reconstructions as measured by R
2
and MAE. As you would expect, the larger the quantity of leads included,
the more accurate the reconstruction. Overall, the mean performance across all possible lead combinations
is 0.8335 R
2
, and 0.0538 MAE. This work opens the door for seeing if ECGio can handle systematic noise
injection and missing or misplaced leads.
1 INTRODUCTION
First introduced in the late 1800s, the electrocardio-
gram (ECG) is the most widely used, non-invasive,
cardiovascular test (AlGhatrif and Lindsay, 2012).
The ECG measures voltage generated in the heart as it
depolarizes and repolarizes by recording the potential
difference on the body’s surface. As it was adopted
clinically, ECG patterns were correlated with various
arrhythmias and cardiac conditions, often before the
underlying physiological mechanism was elucidated
(Yang et al., 2015). Currently, the ECG is an early-
stage diagnostic test, serving to identify and prelim-
inarily quantify myocardial infarctions (MI) (Mem-
bers et al., 2013), ischemia (Fihn et al., 2014), and
rhythm disorders such as atrial (January et al., 2014)
and ventricular tachycardias (Al-Khatib et al., 2018).
a
https://orcid.org/0000-0002-1800-0768
b
https://orcid.org/0000-0002-0096-0031
c
https://orcid.org/0000-0002-1488-712X
d
https://orcid.org/0000-0003-3296-8705
The most common ECG is a 12-lead although one,
three, and six lead devices are still in use. In the stan-
dard 12-lead ECG, there are ten different electrodes
(three limb and six chest leads and one electrode go-
ing to ground) that also generate three augmented
leads via linear combination of the limb and chest
leads. The names and are shown in Table 1. Besides
the number of leads, a multitude of lead placements
exist offering different trade-offs between lead place-
ment/number verse patient comfort and physicians’
ability to consistently and accurately place those ad-
ditional, nontraditional leads (Chou, 1986). The most
popular nontraditional lead placement configurations
include, but are not limited to, Frank’s Lead system
(Frank, 1956), and the four EASI electrode system
(Dower et al., 1988).
Additionally, devices such as the Holter Monitor,
Zio Patch
1
, AliveCor KardiaMoblie
2
, and Apple
1
iRhythm Technologies, Inc, San Francisco, Calif
2
AliveCor Inc, Mountain View, CA, USA
Jain, U., Butchy, A., Leasure, M., Covalesky, V., Mccormick, D. and Mintz, G.
12-Lead ECG Reconstruction via Combinatoric Inclusion of Fewer Standard ECG Leads with Implications for Lead Information and Significance.
DOI: 10.5220/0010788600003123
In Proceedings of the 15th International Joint Conference on Biomedical Engineering Systems and Technologies (BIOSTEC 2022) - Volume 4: BIOSIGNALS, pages 133-141
ISBN: 978-989-758-552-4; ISSN: 2184-4305
Copyright
c
2022 by SCITEPRESS – Science and Technology Publications, Lda. All rights reserved
133

Table 1: The 12 leads, the location of the positive and nega-
tive electrodes, and which heart surface they are thought to
represent. “N” refers to neutral or electric ground.
Lead + Location - Location Surface
I Left Arm Right Arm Lateral
II Left Leg Right Arm Inferior
III Left Leg Left Arm Inferior
aVR Right Arm N None
aVL Left Arm N Lateral
aVF Left Leg N Inferior
V1
Right side of sternum,
4th intercostal space
N Septum
V2
Left side of sternum,
4th intercostal space
N Septum
V3 Between V2 & V4 N Anterior
V4
Left midclavicular line,
5th intercostal place
N Anterior
V5 Left anterior axillary line N Lateral
V6 Left midaxillary line N Lateral
Watch
3
offer a varying number of leads and alterna-
tive lead placements, but still aim to capture signals
that are similar to the common 12-lead ECG.
Devices that employ fewer leads typically have
less chance of misplaced leads, but contain less infor-
mation. Thus, there are many methods and algorithms
to convert and/or reconstruct signals collected from
one device into another device (Finlay et al., 2007).
Until recently, the most common methods to re-
construct a 12-lead signal using fewer than the stan-
dard 12-leads was either linear regression (Trobec
and Toma
ˇ
si
´
c, 2011) (Toma
ˇ
si
´
c and Trobec, 2013a)
(Zhu et al., 2018) or through a principal component
analysis (Dawson et al., 2009) (Mann and Orglmeis-
ter, 2013). Within the last decade, there has been a
tremendous push in the field of machine learning and
artificial intelligence to tackle this problem.
(Grande-Fidalgo et al., 2021) employed ANN to
reconstruct 12-lead ECG from a proprietary three-
lead device in 7 people. (Smith et al., 2021) created
a focus time-delay neural network (FTDNN) using 7
leads to derive the remaining 5 precordial leads (V1,
V3-V6). (Sohn et al., 2020a) created a long short-
term memory (LSTM) network to overcome the issue
of reduced horizontal components of the vector in the
electric signal obtained from the patch-type device at-
tached to the anterior chest.
For a more rigorous review of ECG reconstruc-
tion methods, please refer to (Trobec et al., 2018) and
(Toma
ˇ
si
´
c and Trobec, 2013b). The assumption un-
derlying these attempts was that the information used
to make clinical decisions from a 12-lead ECG was
also present and extractable from a system with fewer
leads.
Heart Input Output, Inc. (DBA HEARTio) has
3
Apple Inc., Cupertino, CA, USA
developed a novel deep learning algorithm that re-
constructs a 12 lead ECG from missing leads. Our
algorithm, ECGio, was developed to screen patients
for coronary artery disease (CAD, the cause of most
rhythm disorders and acute events) and has been vali-
dated in 1,659 patients as verified by coronary angiog-
raphy (Leasure et al., 2021). This paper’s novel con-
tribution to lead reconstruction describes, ECGio’s
ability to take any number and/or combination of
leads and reconstruct an accurate representation of
the original 12-lead signal. For example, ECGio can
recreate a full 12-lead utilizing only Lead I and lead
aVR from a non-standard ECG recording device. In
addition, ECGio is not limited to only 12-lead recon-
struction, but can do a multitude of transformations
(i.e. 12 lead to 128 leads, etc.). As a deep learning
architecture, ECGio will continue to improve.
In this this paper. we demonstrate ECGio’s abil-
ity to accurately reconstruct a 12-lead ECG from a
single lead (any of the standard 12-leads). Next we
use combinations of leads to reconstruct the 12-lead
ECG. Finally, we look at ECGio’s ability to recon-
struct a 12-lead ECG and determine which leads were
most useful for faithful reconstruction
2 METHODS
2.1 Data Source
This is a study proof-of-concept study into the ability
of a deep learning model (ECGio) to reconstruct miss-
ing ECG information. There were 3 distinct experi-
ments done on 250 randomly selected patients from
PTB-XL, a large publicly available electrocardiogra-
phy dataset (Wagner et al., 2020). Only 250 patients
were used as a test set because of the high degree
of computation involved in the experiments although
other similar works have used fewer ECGs (Sohn
et al., 2020b). Overall, 1,023,750 different ECG in-
put combinations were constructed from the original
250 patients.
2.2 Data Standardization
We standardized the ECG signal in-put being sent
to the deep learning model. Each ECG signal was
clipped such that it represented one second of ECG
time and in the form N × M, where M was the number
of leads and N the number of samples. Since each sig-
nal was only one second in length, N was also equal
to the sampling rate. Using Fast Fourier Transform
(FFT), we resampled the signal to reduce the sam-
pling rate to 100Hz. To make sure only the infor-
BIOSIGNALS 2022 - 15th International Conference on Bio-inspired Systems and Signal Processing
134

mation within this band of frequencies was retained
while others were removed, we used a Bandpass But-
terworth filter with passband starting at 2Hz and ex-
tending to 40Hz.
The databased ECG signals were recorded in mil-
livolts (mV), with irregular maxima and minimum
values. To conform to best machine learning prac-
tices, we scaled each one second ECG segment to val-
ues between [-1. +1] using Equation 1 as is common
in deep learning to standardize input signals:
f (x) = 2
x − min(x)
max(x) − min(x)
− 1 (1)
where x represented an ECG array as recorded in
millivolts (mV), max(x) the maximum value along x,
and min(x) the minimum value along x. Any null val-
ues were converted to zeros. Eventually each signal
was detrended such that the isoelectric portions of the
ECG were equal to zero.
The 12-lead standardized data was the reference
when performance metrics were calculated. We did
not use raw voltage difference values as the reference
similar to Sohn et al., (Sohn et al., 2020b) to avoid
a large potential variance in the existence of muscle,
movement, or electric noise causing deviations from
signal to signal. Standardized signals would bring
a more fair comparison mathematically whereas a
straight comparison of performance metrics between
our results and others might not be prudent.
2.3 Experiments & Goals
There were three different experiments:
1. 1 Lead Reconstruction: Can ECGio use 1 lead
of ECG information to accurately and faithfully
reconstruct a 12 lead ECG? If so, which single
lead resulted in the highest performance?
2. Multi-lead Reconstruction: Can ECGio use dif-
ferent ECG lead combinations to accurately and
faithfully reconstruct a 12 lead ECG? If so, what
was the correlation between the number of leads
used as input and performance?
3. Lead Significance: Did the inclusion or exclu-
sion of specific leads affect performance?
2.4 Performance Metrics
In all three experiments there were two key perfor-
mance metrics: mean absolute error (MAE) and the
Pearson correlation coefficient (R
2
). For each of these
values, we calculated the mean (µ) and the standard
deviation (σ) similar to other studies. Furthermore,
these metrics were calculated easily and were easy to
interpret.
MAE was defined as:
MAE(y, ˆy) =
1
N
N
∑
i=1
|y
i
− ˆy
i
| (2)
where y is the ground truth and ˆy is the predicted
value. Each element of the 12-lead ECG array is used
for the purposes of this mean with no difference in
weighting among the leads.
R
2
is defined as:
R
2
(y, ˆy) =
E[(y − µ
y
)( ˆy − µ
ˆy
)]
σ
y
σ
ˆy
(3)
where y is the ground truth and the ˆy is the predicted
value. Each element of the 12-lead ECG array is used
for the purposes of this mean with no difference in
weighting among the leads. E is used to indicate ex-
pectation, µ is the mean, and σ is the standard devia-
tion.
2.5 1 Lead Reconstruction
We used a previously-trained model of ECGio where
the input was an ECG in matrix format, and our out-
put of interest was an ECG in matrix format (Leasure
et al., 2021)). Although ECGio has many outputs, in
this paper only this reconstruction output was used.
As detailed in the methodology, the population of 250
ECGs from the PTB-XL database was standardized
before reconstruction. Each was inputted into ECGio
12 separate times, each time using a different single
lead of information while the remaining eleven leads
were masked to zero. Each time an ECG was inputted,
a unique lead index assured that each individual lead
was used once. After the input was propagated, the
reconstructed ECG was collected and stored.
2.6 Multi-lead Reconstruction
To determine the effect of lead number and signifi-
cance, different leads were systematically included or
removed from the same 250 patient set. All possible
combinations of lead inclusion were explored for each
patient.
In this situation we let S = {1, 2, 3, ..., 11, 12}.
Let S
k
represent a set of all the combinations of S
with k length combinations. Then let A represent
the set that is the union of all the combinations, A =
{S
1
, S
2
, S
3
, ..., S
10
, S
11
, S
12
}. Each set in A indicated
which leads in the input ECG should remain intact
and all others were masked to zero. Performance
statistics were averaged across each S
k
. In Table 2
combinations for each different S
k
and the total num-
ber of combinations done for the 250 ECG population
are shown.
12-Lead ECG Reconstruction via Combinatoric Inclusion of Fewer Standard ECG Leads with Implications for Lead Information and
Significance
135

Table 2: All the possible lead combinations for just one pa-
tient’s ECG. The Total Combinations row results from mul-
tiplying the number of combinations for one ECG with the
total number of patients in the whole population (250).
# of Leads # of Combinations
1 12
2 66
3 220
4 495
5 792
6 924
7 792
8 495
9 220
10 66
11 12
12 1
Sum 4,095
Total Combinations 1,023,750
2.7 Lead Significance
Based on the analyses performed above, we deter-
mined which leads, when included or excluded, lead
to a statistically significant change in performance
by taking every combination c ∈ A and determining
which leads were included and which were excluded.
For example, if c
0
= {1, 2, 3}, then leads 1, 2, 3 were
included and the rest were excluded. When testing
the statistical significance of lead 1, c
0
would be used
for the inclusion of lead 1, while any combination that
did not contain lead 1 would be excluded. It would be
the opposite scenario if it were leads 4-12.
This exercise was followed for every combination
in A until we had 24 subsets with each lead having
2 corresponding subsets indicating whether the lead
was or was not included. For each pair of subsets,
performance metrics were calculated and a p-value
calculated in order to determine if the difference be-
tween the distribution of the performance metrics was
statistically significant.
3 RESULTS
3.1 1 Lead Reconstruction
The MAE and R
2
were calculated for each patient’s
ECG reconstruction using just one lead. These val-
ues were averaged across all 250 patients to obtain
Table 3: The MAE and R
2
mean and standard deviation
across the whole patient population of ECG reconstruction
from just one lead. The first column includes which lead
was used for the reconstruction.
Lead MAE µ MAE σ R
2
µ R
2
σ
I 0.0755 0.0238 0.6498 0.1914
II 0.0747 0.0274 0.6536 0.2172
III 0.0836 0.0280 0.6003 0.2215
aVR 0.0775 0.0280 0.6225 0.1986
aVL 0.0814 0.0279 0.6169 0.2105
aVF 0.0788 0.0270 0.6281 0.2020
V1 0.0834 0.0273 0.5734 0.2013
V2 0.0818 0.0258 0.5786 0.2117
V3 0.0792 0.0252 0.5952 0.1975
V4 0.0775 0.0248 0.6141 0.1971
V5 0.0757 0.0265 0.6317 0.2102
V6 0.0757 0.0261 0.6374 0.2026
Figure 1: The (A) MAE and (B) R
2
of all patients using a
particular lead. Outliers are shown as black diamonds.
the mean and standard deviations reported in Table 3.
To illustrate the spread in reconstruction fidelity
within the population, Figure 1 shows two measures
of reconstruction fidelity as box and whisker plots,
with outliers indicated as black diamonds.
We did not observe a huge deviation in reconstruc-
tion depending upon which lead was used. This points
BIOSIGNALS 2022 - 15th International Conference on Bio-inspired Systems and Signal Processing
136
to one lead including sufficient information to recon-
struct a full 12-lead set. The mean best performance
was observed using lead II and the worst was with
lead III with a range of 0.0747 - 0.0836 for MAE,
and 0.6003 and 0.6536 for R
2
. Quite a few outliers
were observed and responsible for lowering the re-
construction fidelity. The overall individual highest
performing ECG was with a MAE of 0.0321 and a R
2
of 0.964, with surprisingly only six leads selected for
input.
3.2 Multi-lead Reconstruction
In total, 1,023,750 different combinations were cre-
ated across all 250 patients. Reconstructions were
compared against the full, true patient 12-lead ECG
to calculate performance metrics. In Table 4, we re-
port the mean MAE and R
2
metrics of reconstruction
fidelity, grouping the number of leads that went into
the reconstruction. To illustrate the spread in recon-
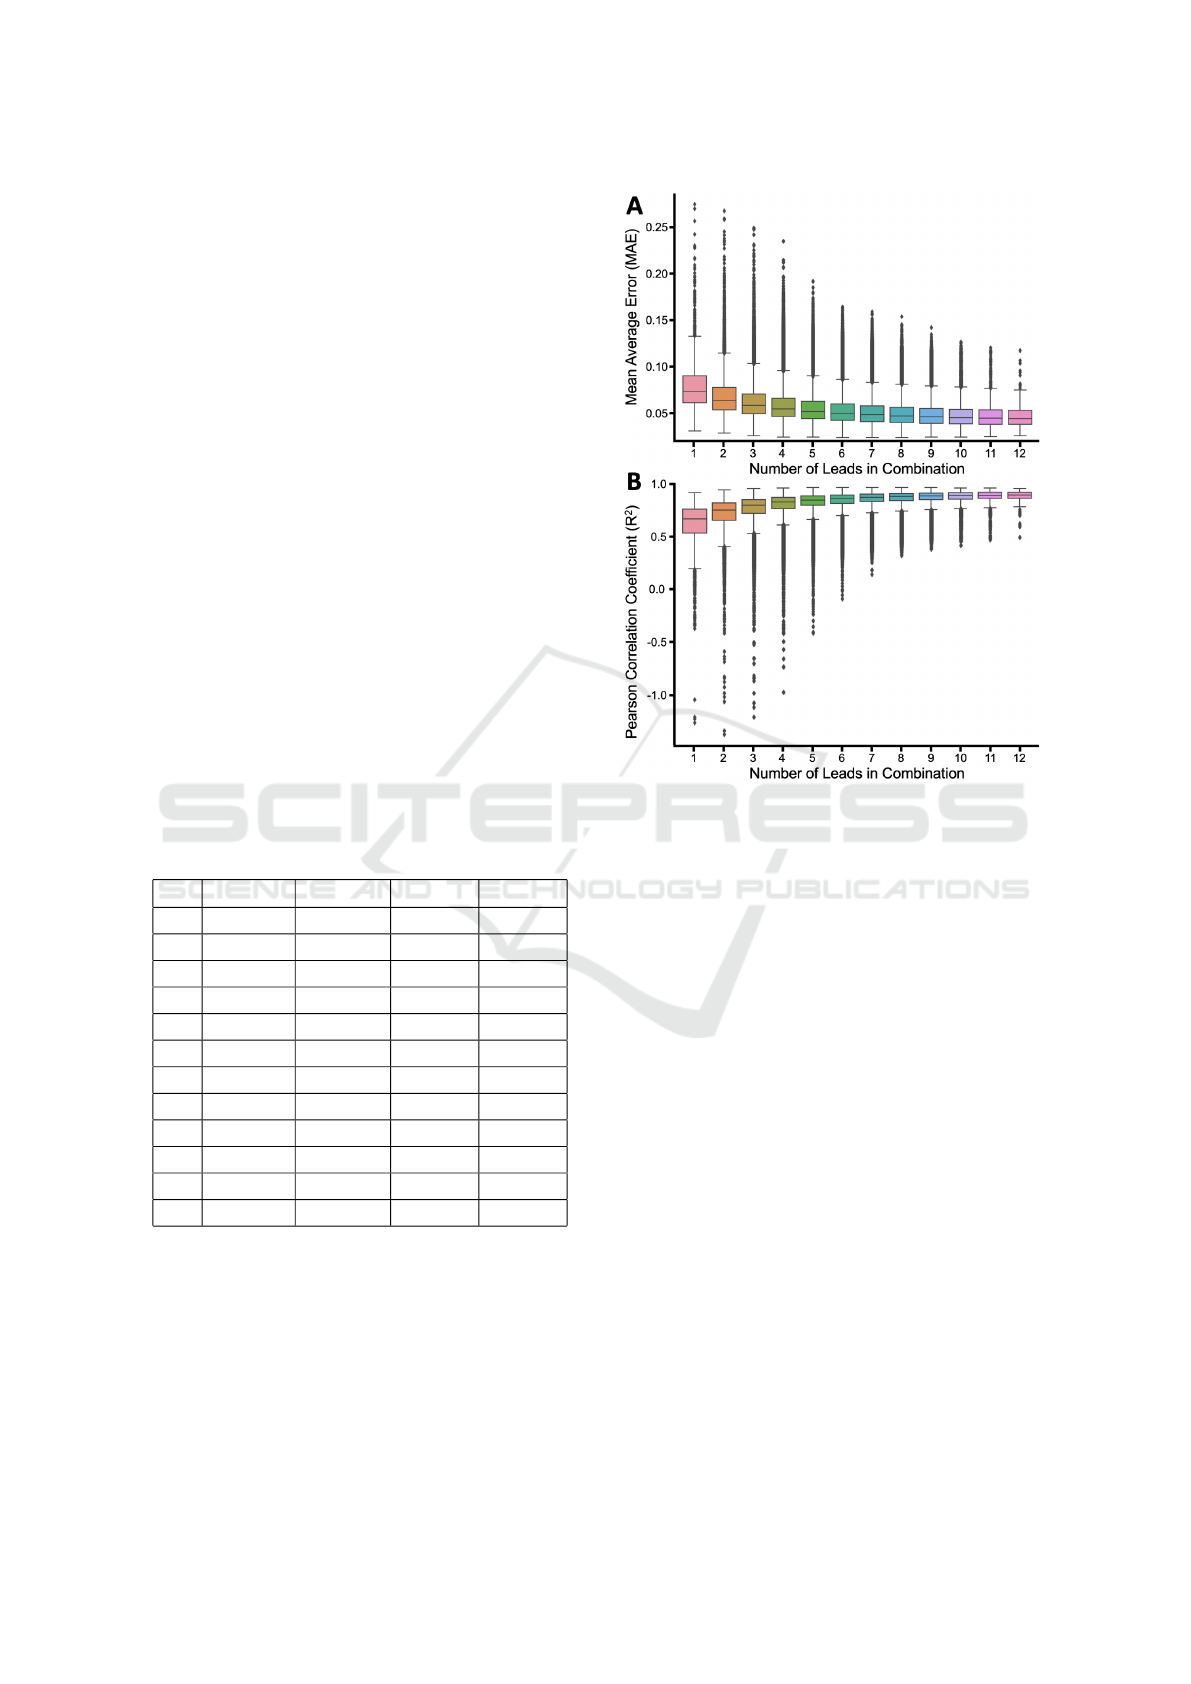
struction fidelity based on the number of leads, Fig-
ure 2 shows two measures of reconstruction fidelity
as box and whisker plots, with outliers indicated as
black diamonds.
Table 4: The MAE and R
2
mean and standard deviation
across the whole patient population for ECG reconstruc-
tions using different combinations of leads. For example,
in 2 leads, we report the performance of any reconstruction
that used any 2 lead combination for reconstruction.
# MAE µ MAE σ R
2
µ R
2
σ
1 0.0787 0.0267 0.6168 0.2068
2 0.0684 0.0226 0.7127 0.1574
3 0.0623 0.0199 0.7662 0.1268
4 0.0582 0.0181 0.8005 0.1056
5 0.0552 0.0169 0.8243 0.0911
6 0.0529 0.0161 0.8415 0.0811
7 0.0512 0.0155 0.8539 0.0741
8 0.0499 0.0151 0.8629 0.0692
9 0.0490 0.0147 0.8694 0.0659
10 0.0483 0.0145 0.8743 0.0636
11 0.0477 0.0144 0.8779 0.0621
12 0.0474 0.0143 0.8806 0.0609
Overall and as expected, there was a consistent
increase in performance when more leads were in-
cluded. The best performing number of leads was
twelve and the worst performing was one with a range
of 0.0474 - 0.0787 for MAE, and 0.6168 - 0.8806 for
R
2
. There was also a decrease in the maximum nega-
tive range as more leads were inputted.
Figure 2: The (A) MAE and (B) R
2
of all patients using
a particular number of leads in combination. Outliers are
shown as black diamonds.
3.3 Lead Significance
Finally, performance statistics were calculated for
various groups of leads depending on whether or not
the reconstruction used a specific lead or combina-
tion of leads. Table 5 reports the MAE and R
2
values
when specific leads were included and sent to EC-
Gio and when they were excluded. These groups in-
cluded reconstructions that used just one lead, up to
the full 12-leads, to identify which leads could sig-
nificantly alter reconstruction fidelity. P-values were
calculated by comparing the performance when the
lead was included against the performance of all re-
constructions when it was excluded. We calculated
p-values for both MAE and R
2
performance metrics,
and these values are reported in Table 6. Leads I, II,
III, aVL, aVF, V2, and V3 all had significant differ-
ence (p-value <0.05) between reconstructions that in-
cluded these leads from those reconstructions that ex-
cluded these leads.
12-Lead ECG Reconstruction via Combinatoric Inclusion of Fewer Standard ECG Leads with Implications for Lead Information and
Significance
137

Table 5: The mean and standard deviations of performance statistics (MAE and R
2
) reported for all combinations of leads,
grouped based on which leads are included (with) and excluded (without). For example, the average MAE is reported for all
reconstructions that used Lead II in “With Lead” and all reconstructions that didn’t use Lead II in “Without Lead”.
Lead
MAE R
2
With Lead Without Lead With Lead Without Lead
µ σ µ σ µ σ µ σ
I 0.053 0.017 0.055 0.018 0.842 0.085 0.825 0.102
II 0.053 0.017 0.055 0.018 0.842 0.086 0.825 0.101
III 0.053 0.017 0.055 0.018 0.843 0.085 0.824 0.101
aVR 0.053 0.017 0.055 0.017 0.839 0.089 0.828 0.099
aVL 0.053 0.017 0.055 0.018 0.845 0.084 0.822 0.102
aVF 0.053 0.016 0.055 0.018 0.845 0.083 0.822 0.102
V1 0.053 0.017 0.055 0.018 0.841 0.086 0.826 0.100
V2 0.052 0.016 0.055 0.018 0.843 0.086 0.824 0.101
V3 0.052 0.016 0.055 0.018 0.844 0.086 0.823 0.100
V4 0.053 0.016 0.055 0.018 0.842 0.088 0.825 0.099
V5 0.053 0.016 0.055 0.018 0.840 0.089 0.827 0.099
V6 0.053 0.017 0.055 0.018 0.839 0.089 0.828 0.099
Table 6: Table reporting the p-values associated with the
level of significance between the performance of the ECG
reconstructions that included (with) or excluded (without)
that particular lead. Both p-values are reported for MAE
and R
2
. Leads with R
2
p-values <0.05 are denoted with an
asterisk.
Lead
p-value
MAE R
2
I* 0.176 0.039
II* 0.157 0.049
III* 0.301 0.030
aVR 0.299 0.194
aVL* 0.159 0.008
aVF* 0.117 0.006
V1 0.136 0.062
V2* 0.050 0.018
V3* 0.041 0.009
V4 0.096 0.052
V5 0.163 0.111
V6 0.228 0.170
4 DISCUSSION
The purpose of this study was to determine whether
ECGio, a novel deep learning platform of HEARTio,
could reconstruct a full 12-lead ECG from one or
more leads. We used the mean absolute error (MAE)
and the Pearson correlation coefficient (R
2
) which are
standard performance metrics to measure ECG recon-
struction fidelity. Both measures were calculated by
comparing ECGio’s reconstruction to the normalized
ECG (as described in the methodology section). The
normalization process does remove the amplitude in-
formation from the signal, which can impact the phys-
iological importance of the ECG (i.e. certain condi-
tions where the definition is dependent on an ampli-
tude value). However, this doesn’t affect the many
pathologies where the qualitative features of the ECG
matter more than the amplitude.
An example of ECGio reconstruction is shown in
Figure 3, and demonstrates that complete correlation
may not be possible because some noise still exists
within the reference standard ECG and will not be
seen in the reconstruction. This can be illustrated
quantitatively, where despite there being a high visual
match between the original and reconstructed ECG,
the R
2
is not near 1. This noise is usually signal ar-
tifacts that result from issues with baseline recording
or our filtering, and as signal noise in the middle of
the signal.
In the first experiment we used only one lead of in-
formation to create a 12-lead ECG. This experiment
yielded moderate correlation between the reference
standard ECG and the reconstructed ECG. This level
of correlation might offer clinicians additional infor-
mation when dealing with limited technology (e.g. a
one-lead patch or even a one-lead smartwatch ECG).
Lead II performed best. A possible hypothesis was
that a limb lead was harder to recreate than a precor-
dial lead or that information from a limb lead can be
used to recreate precordial leads and not vise-versa.
It was also possible that this behavior was only extant
within this 250 ECG dataset and not in an extended
population.
In the second experiment, a higher level of recon-
struction was exhibited with more information pro-
vided within the input ECG. The correlation increased
BIOSIGNALS 2022 - 15th International Conference on Bio-inspired Systems and Signal Processing
138
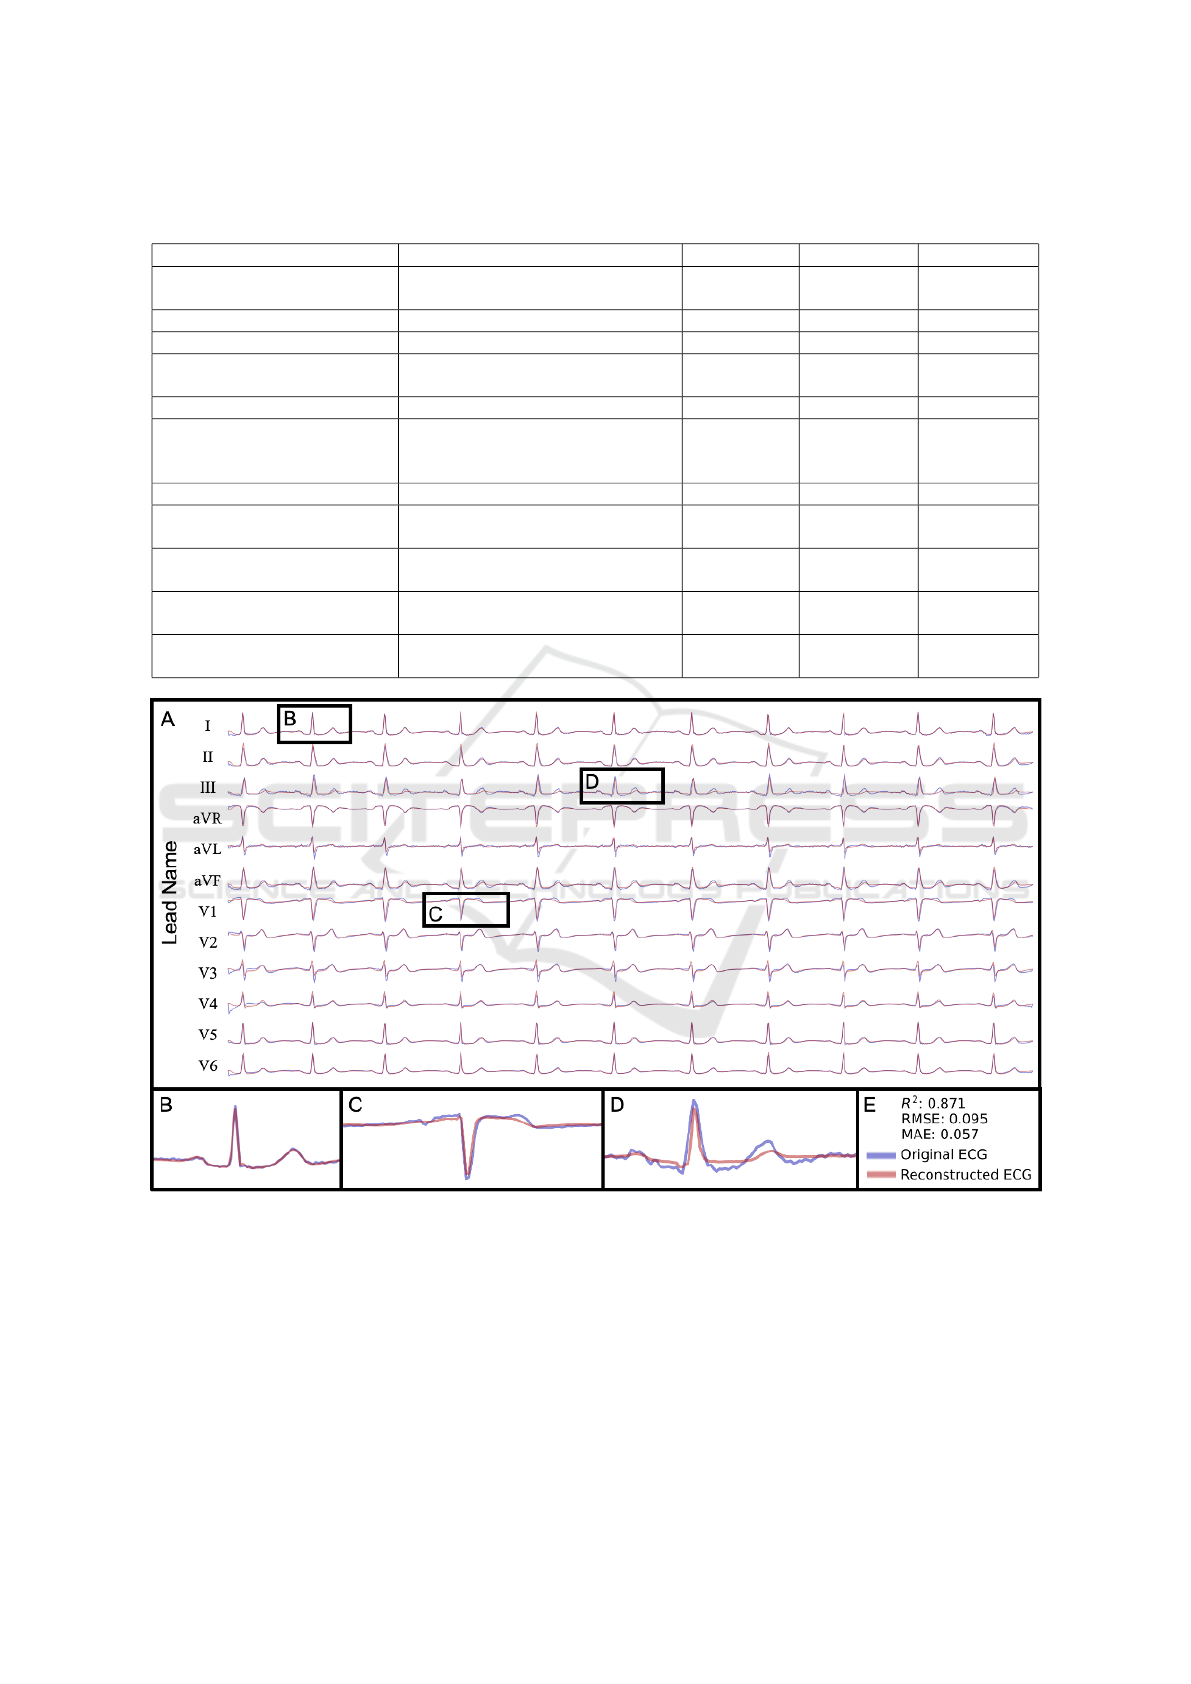
Table 7: This table showcases a sampling of other methods that are used in 12-lead ECG reconstruction. Note that the value
used for R
2
for this work is for the mean value for associated lead subset.
Ref Method Sample Size Lead Subset R
2
(Trobec and Toma
ˇ
si
´
c, 2011) Linear Regression 65
2,3,4
lead subsets
0.954
(Zhu et al., 2018) Linear Regression 39 I, II, V2 0.947
(Dawson et al., 2009) Linear Affine Transformation 448 3-lead VCG 0.819
(Mann and Orglmeister, 2013) Principal Component Analysis 24
6,9,11
lead subsets
0.950
(Grande-Fidalgo et al., 2021) Artificial Neural Network 7 3 leads 0.997
(Smith et al., 2021) Focus Time-Delay Neural Network 25
I, II, III
aVL, aVR
aVF, V2
0.861 - 0.968
(Sohn et al., 2020a) LSTM Network 60 3 lead patch 0.95
This Work
Multi-output Deep Learning Model
(ECGio)
250
Every
combination
0.835
This Work
Multi-output Deep Learning Model
(ECGio)
250 3 leads 0.762
This Work
Multi-output Deep Learning Model
(ECGio)
250 6 leads 0.842
This Work
Multi-output Deep Learning Model
(ECGio)
250 9 leads 0.869
Figure 3: (a) An ECG reconstructed by ECGio (in semi-transparent red) using only lead I and compared against the true,
original 12-lead ECG signal (in semi-transparent blue). (B) Enlarged lead I demonstrating that even though ECGio is given
lead 1, it performs corrections and approximations in an attempt to correct for noise in the input signal. (C) Enlarged lead V1
demonstrating ECGio’s reconstruction ability on an important precordial lead. (D) Enlarged lead III demonstrating ECGio’s
reconstruction ability on a noisy limb lead. This points to areas for improvement in future work. (E) Figure legend and
performance statistics (R
2
, Root Mean Square Error (RMSE) and MAE) for this particular one-lead reconstruction.
from moderate with 1 lead to high with 12-leads. This
type of behavior was expected especially for clini-
cians who would prefer a more authentic reconstruc-
tion.
In the final experiment there were particular leads
that were more significant in ECGio’s ability to re-
construct a full 12-lead ECG. Either ECGio weighed
information from some leads more highly than others,
12-Lead ECG Reconstruction via Combinatoric Inclusion of Fewer Standard ECG Leads with Implications for Lead Information and
Significance
139

or some leads contained more information and were
therefore more significant to understanding a full 12-
lead morphology. From the tests of significance, leads
I,II, aVL, aVF, V2, and V3 – the majority of which
were limb leads – were statistically significant. The
unipolar leads aVL and aVF were linear combina-
tions of limb leads and therefore their inclusion was
also significant. V2 and V3 were also statistically sig-
nificant and might be more important than other pre-
cordial leads. Again, this behavior might represent a
larger trend or might be limited to this dataset.
In Table 7, we compared our results against a sam-
pling of other methods with R
2
as the metric of com-
parison. At first glance, our work contained a lower
R2 than others, but a few factors should be consid-
ered. (1) Our reference standard had the propensity to
filtering artifacts as a result of standardization. (2)
This work was a generalized model that used any
combination of ECG leads and so that a decrease of
performance in favor of flexibility was expected. (3)
We limited the length of time to 10 seconds and we ar-
tificially lowered the sampling rate to 100Hz, which
meant that there were less values in flat areas, such as
isoelectric portions.
We also showed the potential of ECGio to be used
to reconstruct a full 12-lead ECG when leads were
either missing or unable to be collected. We also
showed that there were leads of an ECG that may con-
tain more information than others, namely the limb
leads. In future studies, ECGio’s scale, usability, and
clinical viability must be examined. We must deter-
mine if results scale and if they demonstrate a larger
trend in how ECG information is stored. The next step
must include a larger sample size with the potential to
capture the variance of ECGs. We need to show if the
information provided by this reconstruction matches-
up not only mathematically, but clinically. A future
study should compare the reference standard ECG to
the reconstruction in terms of clinical information de-
livered to physicians. In addition, the presence of ab-
normal beats and rhythms must be examined to deter-
mine if abnormal morphology affects ECGio’s recon-
struction capabilities.
REFERENCES
Al-Khatib, S. M., Stevenson, W. G., Ackerman, M. J.,
Bryant, W. J., Callans, D. J., Curtis, A. B., Deal,
B. J., Dickfeld, T., Field, M. E., Fonarow, G. C., et al.
(2018). 2017 aha/acc/hrs guideline for management
of patients with ventricular arrhythmias and the pre-
vention of sudden cardiac death: a report of the amer-
ican college of cardiology/american heart association
task force on clinical practice guidelines and the heart
rhythm society. Journal of the American College of
Cardiology, 72(14):e91–e220.
AlGhatrif, M. and Lindsay, J. (2012). A brief review: his-
tory to understand fundamentals of electrocardiogra-
phy. Journal of community hospital internal medicine
perspectives, 2(1):14383.
Dawson, D., Yang, H., Malshe, M., Bukkapatnam, S. T.,
Benjamin, B., and Komanduri, R. (2009). Lin-
ear affine transformations between 3-lead (frank
xyz leads) vectorcardiogram and 12-lead electro-
cardiogram signals. Journal of electrocardiology,
42(6):622–630.
Dower, G. E., Yakush, A., Nazzal, S. B., Jutzy, R. V., and
Ruiz, C. E. (1988). Deriving the 12-lead electrocar-
diogram from four (easi) electrodes. Journal of elec-
trocardiology, 21:S182–S187.
Fihn, S. D., Blankenship, J. C., Alexander, K. P., Bittl, J. A.,
Byrne, J. G., Fletcher, B. J., Fonarow, G. C., Lange,
R. A., Levine, G. N., Maddox, T. M., et al. (2014).
2014 acc/aha/aats/pcna/scai/sts focused update of the
guideline for the diagnosis and management of pa-
tients with stable ischemic heart disease: a report of
the american college of cardiology/american heart as-
sociation task force on practice guidelines, and the
american association for thoracic surgery, preventive
cardiovascular nurses association, society for cardio-
vascular angiography and interventions, and society of
thoracic surgeons. Journal of the American College of
Cardiology, 64(18):1929–1949.
Finlay, D. D., Nugent, C. D., Kellett, J. G., Donnelly, M. P.,
McCullagh, P. J., and Black, N. D. (2007). Syn-
thesising the 12-lead electrocardiogram: Trends and
challenges. European journal of internal medicine,
18(8):566–570.
Frank, E. (1956). An accurate, clinically practical sys-
tem for spatial vectorcardiography. circulation,
13(5):737–749.
Grande-Fidalgo, A., Calpe, J., Red
´
on, M., Mill
´
an-Navarro,
C., and Soria-Olivas, E. (2021). Lead reconstruction
using artificial neural networks for ambulatory ecg ac-
quisition. Sensors, 21(16):5542.
January, C. T., Wann, L. S., Alpert, J. S., Calkins, H., Cigar-
roa, J. E., Cleveland, J. C., Conti, J. B., Ellinor, P. T.,
Ezekowitz, M. D., Field, M. E., et al. (2014). 2014
aha/acc/hrs guideline for the management of patients
with atrial fibrillation: executive summary: a report
of the american college of cardiology/american heart
association task force on practice guidelines and the
heart rhythm society. Journal of the American Col-
lege of Cardiology, 64(21):2246–2280.
Leasure, M., Jain, U., Butchy, A., Otten, J., Covalesky,
V. A., McCormick, D., and Mintz, G. S. (2021).
Deep learning algorithm predicts angiographic coro-
nary artery disease in stable patients using only a stan-
dard 12-lead electrocardiogram. Canadian Journal of
Cardiology.
Mann, S. and Orglmeister, R. (2013). Pca-based
ecg lead reconstruction. Biomedical Engi-
neering/Biomedizinische Technik, 58(SI-1-Track-
G):000010151520134197.
BIOSIGNALS 2022 - 15th International Conference on Bio-inspired Systems and Signal Processing
140

Members, . W. C., Anderson, J. L., Adams, C. D., Antman,
E. M., Bridges, C. R., Califf, R. M., Casey Jr, D. E.,
Chavey, W. E., Fesmire, F. M., Hochman, J. S., et al.
(2013). 2012 accf/aha focused update incorporated
into the accf/aha 2007 guidelines for the management
of patients with unstable angina/non–st-elevation my-
ocardial infarction: a report of the american col-
lege of cardiology foundation/american heart associ-
ation task force on practice guidelines. Circulation,
127(23):e663–e828.
Smith, G. H., Van den Heever, D. J., and Swart, W. (2021).
The reconstruction of a 12-lead electrocardiogram
from a reduced lead set using a focus time-delay neu-
ral network. Acta Cardiologica Sinica, 37(1):47.
Sohn, J., Yang, S., Lee, J., Ku, Y., and Kim, H. C. (2020a).
Reconstruction of 12-lead electrocardiogram from a
three-lead patch-type device using a lstm network.
Sensors, 20(11):3278.
Sohn, J., Yang, S., Lee, J., Ku, Y., and Kim, H. C. (2020b).
Reconstruction of 12-lead electrocardiogram from a
three-lead patch-type device using a LSTM network.
Sensors, 20(11):3278.
Toma
ˇ
si
´
c, I. and Trobec, R. (2013a). Electrocardiographic
systems with reduced numbers of leads—synthesis of
the 12-lead ecg. IEEE reviews in biomedical engineer-
ing, 7:126–142.
Toma
ˇ
si
´
c, I. and Trobec, R. (2013b). Electrocardiographic
systems with reduced numbers of leads—synthesis of
the 12-lead ecg. IEEE reviews in biomedical engineer-
ing, 7:126–142.
Trobec, R., Toma
ˇ
si, I., Rashkovska, A., and Avbelj, V.
(2018). Lead Theory of Differential Leads and Syn-
thesis of the Standard 12-Lead ECG, pages 77–100.
Springer International Publishing, Cham.
Trobec, R. and Toma
ˇ
si
´
c, I. (2011). Synthesis of the 12-lead
electrocardiogram from differential leads. IEEE trans-
actions on information technology in biomedicine,
15(4):615–621.
Wagner, P., Strodthoff, N., Bousseljot, R.-D., Samek, W.,
and Schaeffter, T. (2020). Ptb-xl, a large publicly
available electrocardiography dataset.
Yang, X.-L., Liu, G.-Z., Tong, Y.-H., Yan, H., Xu, Z., Chen,
Q., Liu, X., Zhang, H.-H., Wang, H.-B., and Tan, S.-
H. (2015). The history, hotspots, and trends of elec-
trocardiogram. Journal of geriatric cardiology: JGC,
12(4):448.
Zhu, H., Pan, Y., Cheng, K.-T., and Huan, R. (2018).
A lightweight piecewise linear synthesis method for
standard 12-lead ecg signals based on adaptive region
segmentation. PloS one, 13(10):e0206170.
12-Lead ECG Reconstruction via Combinatoric Inclusion of Fewer Standard ECG Leads with Implications for Lead Information and
Significance
141
