
Have Your Cake and Log it Too: A Pilot Study Leveraging IMU Sensors
for Real-time Food Journaling Notifications
Arpita Kappattanavar
a,∗
, Marten Kremser
b,∗
and Bert Arnrich
c
Digital Health - Connected Healthcare, Hasso-Plattner-Institut, University of Potsdam, Germany
Keywords:
Eating Activity, Classification, Notification, Real-time.
Abstract:
To monitor diet, nutritionists employ food journaling approaches, which rely on the subject’s memory. Ac-
cordingly, a real-time reminder during eating can help subjects adhere to a journaling routine more strictly.
Although previous works used sensors to detect eating activities, no study accounted for the time impact of
delivering notifications. Our study presents an approach to notify subjects for food journaling within three
to six minutes from eating. We achieved this by collecting wrist motion data using an inertial measurement
unit. Twenty-two features were extracted from the collected data. Those were used as input to a random forest
model to classify an eating activity. To train and test the model, we collected data from four subjects in a
semi-controlled environment and daily life. The f1-score for testing data was between 0.74 to 0.78 for four
subjects, but they still received notifications for all meals. Additionally, we tested this approach with data
collected for one and a half days from a new subject. We observed notifications for four out of five meals. The
robust detection criterion reduced the false notifications. Our pilot study results suggest that considering the
delivery time of notification can lead to better food journaling
1 INTRODUCTION
According to the World Health Organization fact
sheet, the number of people with diabetes rose from
108 million in 1980 to 422 million in 2014 (WHO,
2021). The prevalence of diabetes has increased
rapidly in low and middle-income countries and is a
significant cause of amputation of lower limbs, blind-
ness, heart attack, and kidney failure. The majority of
people have Type 2 diabetes, which can be prevented,
or its onset delayed, by maintaining normal body
weight with healthy diet and physical activity (WHO,
2021). A healthy diet requires monitoring food in-
take frequency, the quantity, and what is eaten (Bedri
et al., 2017). To monitor diet, nutritionists employed
self-reporting tools and food diaries, which answer
these questions by relying on subjects’ memory. In
the study conduct by Helander, E., et al., only 2.58%
out of 189,770 users who downloaded ’The Eatery’
application were active in food journaling (Helander
et al., 2014). These methods of food journaling are
prone to errors, as people tend to forget the food con-
a
https://orcid.org/0000-0002-7322-0704
b
https://orcid.org/0000-0002-6907-3158
c
https://orcid.org/0000-0001-8380-7667
∗
These authors contributed equally
sumed on stressful days (Shim et al., 2014; Thompson
et al., 2010). Some studies do offline eating activity
classification using different sensors, but they do not
send reminders in real-time for food journaling (Bedri
et al., 2017; Biallas et al., 2015; Dong et al., 2009;
Dong et al., 2013; Amft et al., 2005). Hence, we do
this study to develop a mechanism to remind people to
adhere to food journaling by sending real-time notifi-
cations to the smartphones of the subject within 3-6
minutes of the start of their food consumption.
We accomplish our aim of notification by first col-
lecting wrist motion tracking Inertial Measurement
Unit (IMU) data, extracting 22 best features from
the collected data, and using these features as input
to Random Forest (RF) model for classifying eating
activity to other activities. Finally, to reduce false-
positive and false-negative notifications, a detection
criterion (a threshold which is applied to the output
of the RF model to identify two consecutive peaks
to send notifications) is applied to send correct re-
minders to the subject for food journaling.
The organization of this paper is as follows: in
Section II, we present the state of the art and its
limitations. Section III introduces the data collec-
tion protocol, preprocessing and feature engineering
techniques, classification models, and real-time im-
532
Kappattanavar, A., Kremser, M. and Arnrich, B.
Have Your Cake and Log it Too: A Pilot Study Leveraging IMU Sensors for Real-time Food Journaling Notifications.
DOI: 10.5220/0010845500003123
In Proceedings of the 15th International Joint Conference on Biomedical Engineering Systems and Technologies (BIOSTEC 2022) - Volume 5: HEALTHINF, pages 532-541
ISBN: 978-989-758-552-4; ISSN: 2184-4305
Copyright
c
2022 by SCITEPRESS – Science and Technology Publications, Lda. All rights reserved
plementation of eating activity detection. In section
IV, we present the results of preprocessing, feature
engineering techniques, and model performance. In
Section V, we discuss the results and methods applied.
Finally, in Section VI, we conclude and provide an
outlook on our future work.
2 RELATED WORK
The early works on eating activity classification in-
cluded offline intake gestures in the lab and daily life.
The data in these works were collected using sensors
placed on the neck, ears, upper and lower arms (Bedri
et al., 2017; Biallas et al., 2015; Dong et al., 2009;
Dong et al., 2013; Amft et al., 2005).
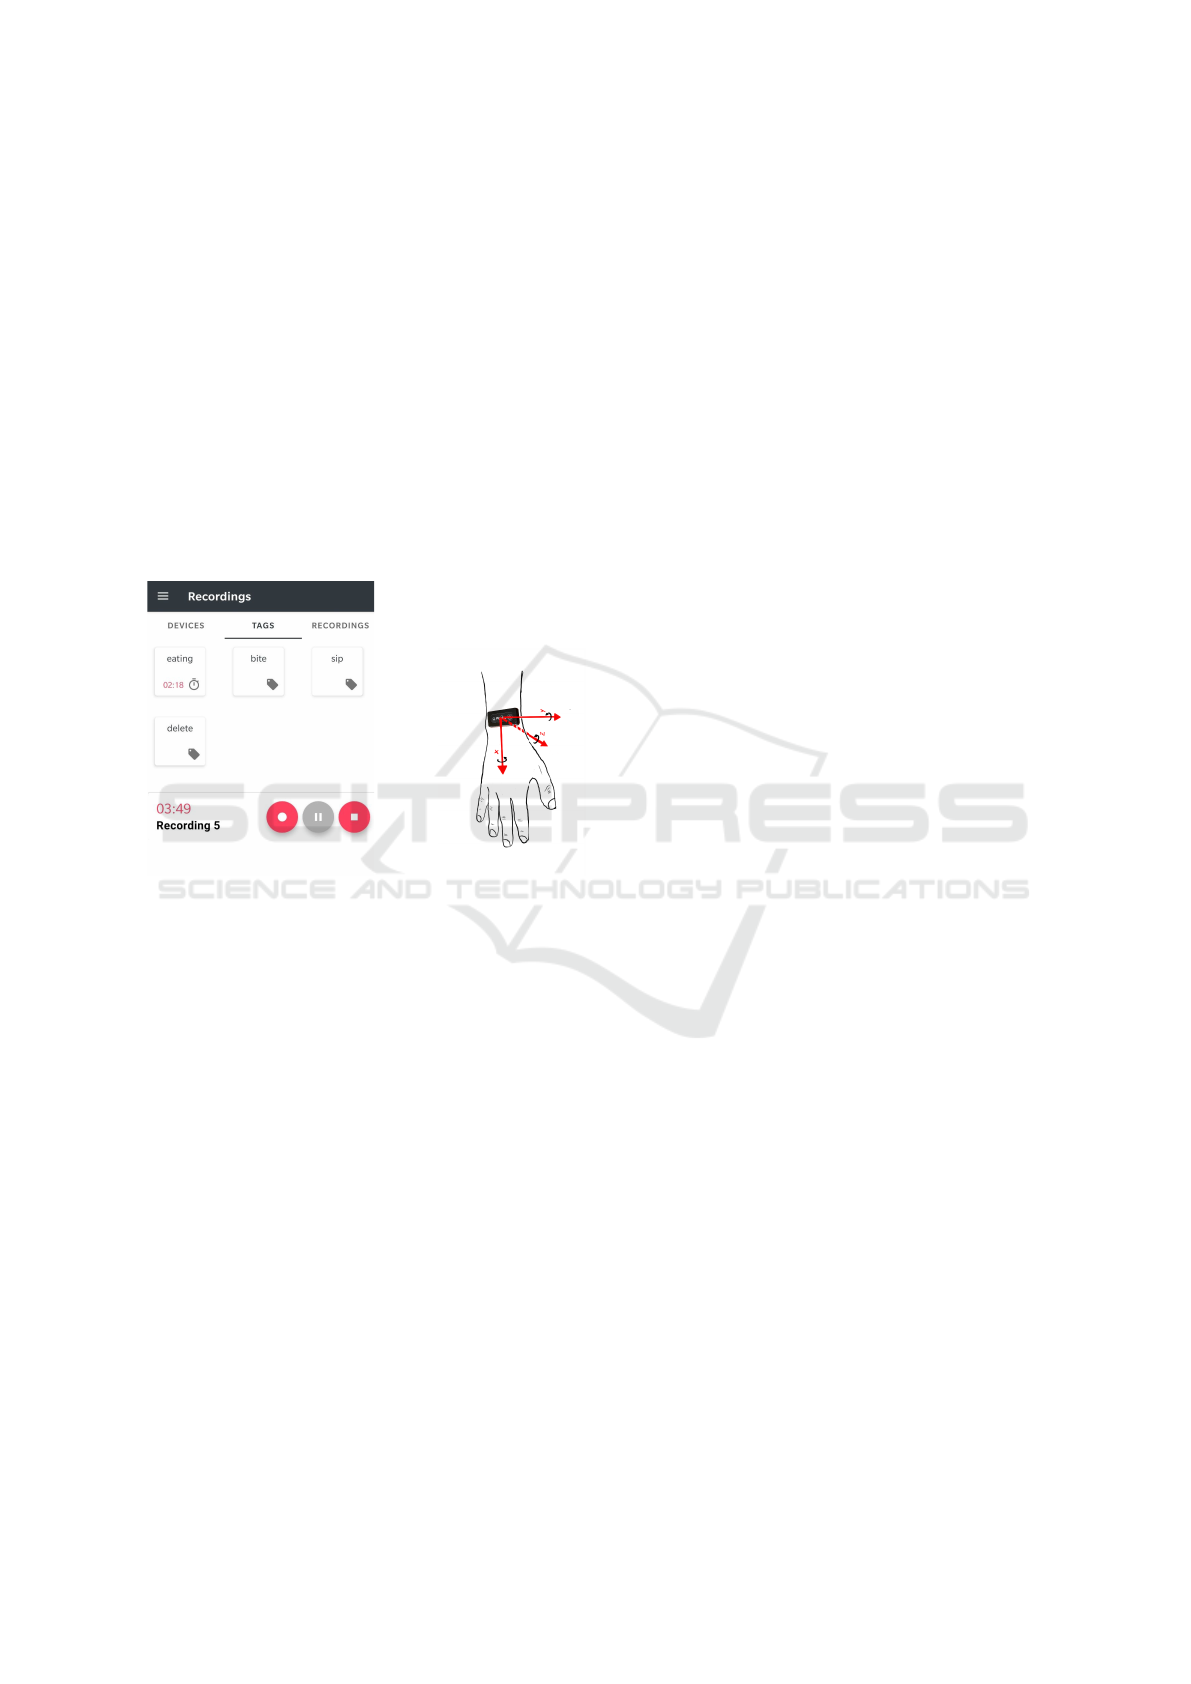
(a) (b)
Figure 1: Sensor Setup used for data collection. (a) Sen-
sorHub application for tagging and (b) GaitUp tri-axis IMU
sensors placement on the wrist.
There are very few studies that have worked on the
real-time classification of eating activity in the daily
life. Sougata Sen et al. worked on Annapurna, which
is an automated eating journal that detects eating ac-
tivity gestures on a smartwatch using the inbuilt ac-
celerometer and gyroscope sensor data and triggers
the smartwatch to take images of the food (Sen et al.,
2018). This work extracted more than 30 features
from the raw data for every 500 msec, and the authors
have not mentioned the details. They then trained
the model on a decision tree, RF and support vector
machine, which had a false positive of 6.5% and a
false negative of 3.3%. Nevertheless, capturing im-
ages could be a privacy concern in monitoring eating
activity.
Simon Stankoski et al. also carried out real-time
eating activity detection using a tri-axis accelerom-
eter, and gyroscope in their work (Stankoski et al.,
2020). They collected data from 10 subjects in real
life. They used three stages to provide the results. In
the first two stages, they trained the machine learning
algorithm (RF), which had many false positives. In
the third stage, they used the hidden markov model
to smoothen the prediction. They achieved a preci-
sion of 0.7 and a recall of 0.83 by using 60 features.
Training three models on the smartphone increases
the complexity of the algorithm. Moreover, they do
not report the time taken by the algorithm to detect
the eating activity.
In our study, we do real-time eating activity de-
tection classification using a single RF classifier with
22 features. We also send real-time notifications to
the subject within 3-6 minutes of eating start for food
journaling. The correct notification is sent by apply-
ing detection criteria to the output of the classifier.
3 METHODS
This Section provides the information on the sensor
setup used to collect the data, the data collection pro-
tocol, and the steps followed in preprocessing. We
further explain the different approaches to extract and
select features, the eating activity classifier, and fi-
nally introduce the real-time implementation.
3.1 Sensor Setup
To collect the data and provide real-time notifications
to the subjects, we used the sensorHub an internally
developed application. This application facilitates the
collection of data from different sensors on one ap-
plication. It has a backend server and dashboard to
store and retrieve collected data. The application also
has a tag functionality to label events. We utilized
this application to collect GaitUp IMU sensors tri-axis
accelerometer and gyroscope data at a sampling rate
of 64 Hz. Figure 1 presents the sensorhub applica-
tion along with the location of IMU placement on the
wrist. We used GaitUp sensors as it has sufficient bat-
tery life, Bluetooth functionality to transfer collected
data to the sensorHub application, and the data qual-
ity has been verified in previous studies (Zhou et al.,
2020). Nonetheless, smartwatches will be considered
in the future studies as they have integrated IMU sen-
sors and also allows onboard data collection and pro-
cessing.
We further extended this application within the
scope of this paper to perform real-time notification
by introducing machine learning for eating activity
classification. We also retrieved the data collected
from the sensors and machine learning output on the
backend server.
Have Your Cake and Log it Too: A Pilot Study Leveraging IMU Sensors for Real-time Food Journaling Notifications
533

3.2 Study Protocol
To test and train RF model, we collected data in
the controlled environment to detect food intake ges-
tures and in the semi-controlled environment to col-
lect daily life data. Finally, a third experiment was
performed to evaluate the accuracy of the device to
detect eating activities, the details of which are in Sec-
tion 3.6
3.2.1 Food Intake Gesture Data
This data was collected while the subjects had a meal
to detect food intake gestures. Food intake gesture
(Bite) involves the movement of the dominant hand
from plate to mouth and back and is as presented in
Figure 2 (Dong et al., 2009). Seven subjects partici-
pated in this study. One of the experimenters stayed
with the subjects during these meals and recorded
each gesture manually using the sensorHub applica-
tion’s tag functionality. Tag functionality is presented
in Figure 1 a. We recorded the data for 13 meals.
The subjects in these recordings used a spoon, fork,
or knife to eat 11 meals. They ate two other meals
using chopsticks and hands. The mean time for eat-
ing the meal by the seven subjects was 9.8 minutes.
The mean number of food intake gestures during the
recording was 38.5.
3.2.2 Semi-controlled Environment Data
The data was collected using the sensors mentioned
in the Sensor Setup in a semi-controlled environment
by four subjects (two male and two female). The sub-
jects used sensorHub application to collect the data
and tag the label while eating meals in their personal
spaces. All subjects wore the sensor on their domi-
nant hand. We asked the subjects participating in the
experiment to collect data that included 45 minutes of
different activities (home office, cleaning the house,
resting, shopping, walking, and chatting (either seated
or standing)) before and after the meal, along with
the mealtime in their private spaces. The collected
data set contained 52 hours of data, which included 4
hours of eating. We used this data for training, test-
ing, and tuning hyperparameters of the RF model and
for training the real-time RF model on the smartphone
for notifications.
3.3 Preprocessing
3.3.1 Filtering
Filtering of the IMU data was performed to reduce
the noise caused due to high-frequency signals and
(a) (b) (c)
(d) (e)
Figure 2: The wrist roll pattern for food intake. (a) Pick the
food, (b) Movement from plate to mouth, (c) Food placed
in the mouth, (d) Movement back to plate, (e) Hand at rest.
dynamic body movements. Butterworth and Gaussian
filters were applied.
Butterworth Filtering: The accelerometer data was
filtered using Butterworth low pass filter at a cutoff
frequency of 1Hz and filter order of 5 to get the ori-
entation data (Stankoski et al., 2021). Parallelly, the
same data was band pass filtered between 2 and 8 Hz
to get dynamic movements performed by the hand.
The gyroscope data was only low pass filtered below
2Hz, to remove high-frequency noise (Gallego et al.,
2010). The filtered tri-axis accelerometer and gyro-
scope signal magnitudes were also calculated (Kap-
pattanavar et al., 2020).
Gaussian Filtering: To smoothen the x-axis gyro-
scope signal, a Gaussian filter with a window size of
128 and a standard deviation of 20 was used (Dong
et al., 2009; Dong et al., 2013).
3.3.2 Intake Gesture Algorithm
The Gaussian filtered gyroscope data is the input to
this algorithm. We modified the original (Dong et al.,
2009; Dong et al., 2013) bite detection algorithm us-
ing the x-axis gyroscope data and a different threshold
to detect the intake gesture. The food intake gesture
is presented in Algorithm 1.
In Algorithm 1, V t measured angular velocity of
gyroscope x-axis data at time t, T 1 is the threshold
in deg/s which detects roll motion while moving the
hand from plate to the mouth, T 2 is the threshold
in deg/s which detects the roll motion when moving
the hand from the mouth back to the plate, T 3 is the
threshold in seconds to detect the wrist motion while
putting food into the mouth, and T 4 is the threshold in
seconds to detect hand resting before the start of the
next intake gesture.
The algorithm detects an intake gesture from a
negative gyroscope x peak (T1), by a short break of
putting food into the mouth (T2), a positive gyroscope
x peak (T3), followed by a long break of resting the
HEALTHINF 2022 - 15th International Conference on Health Informatics
534
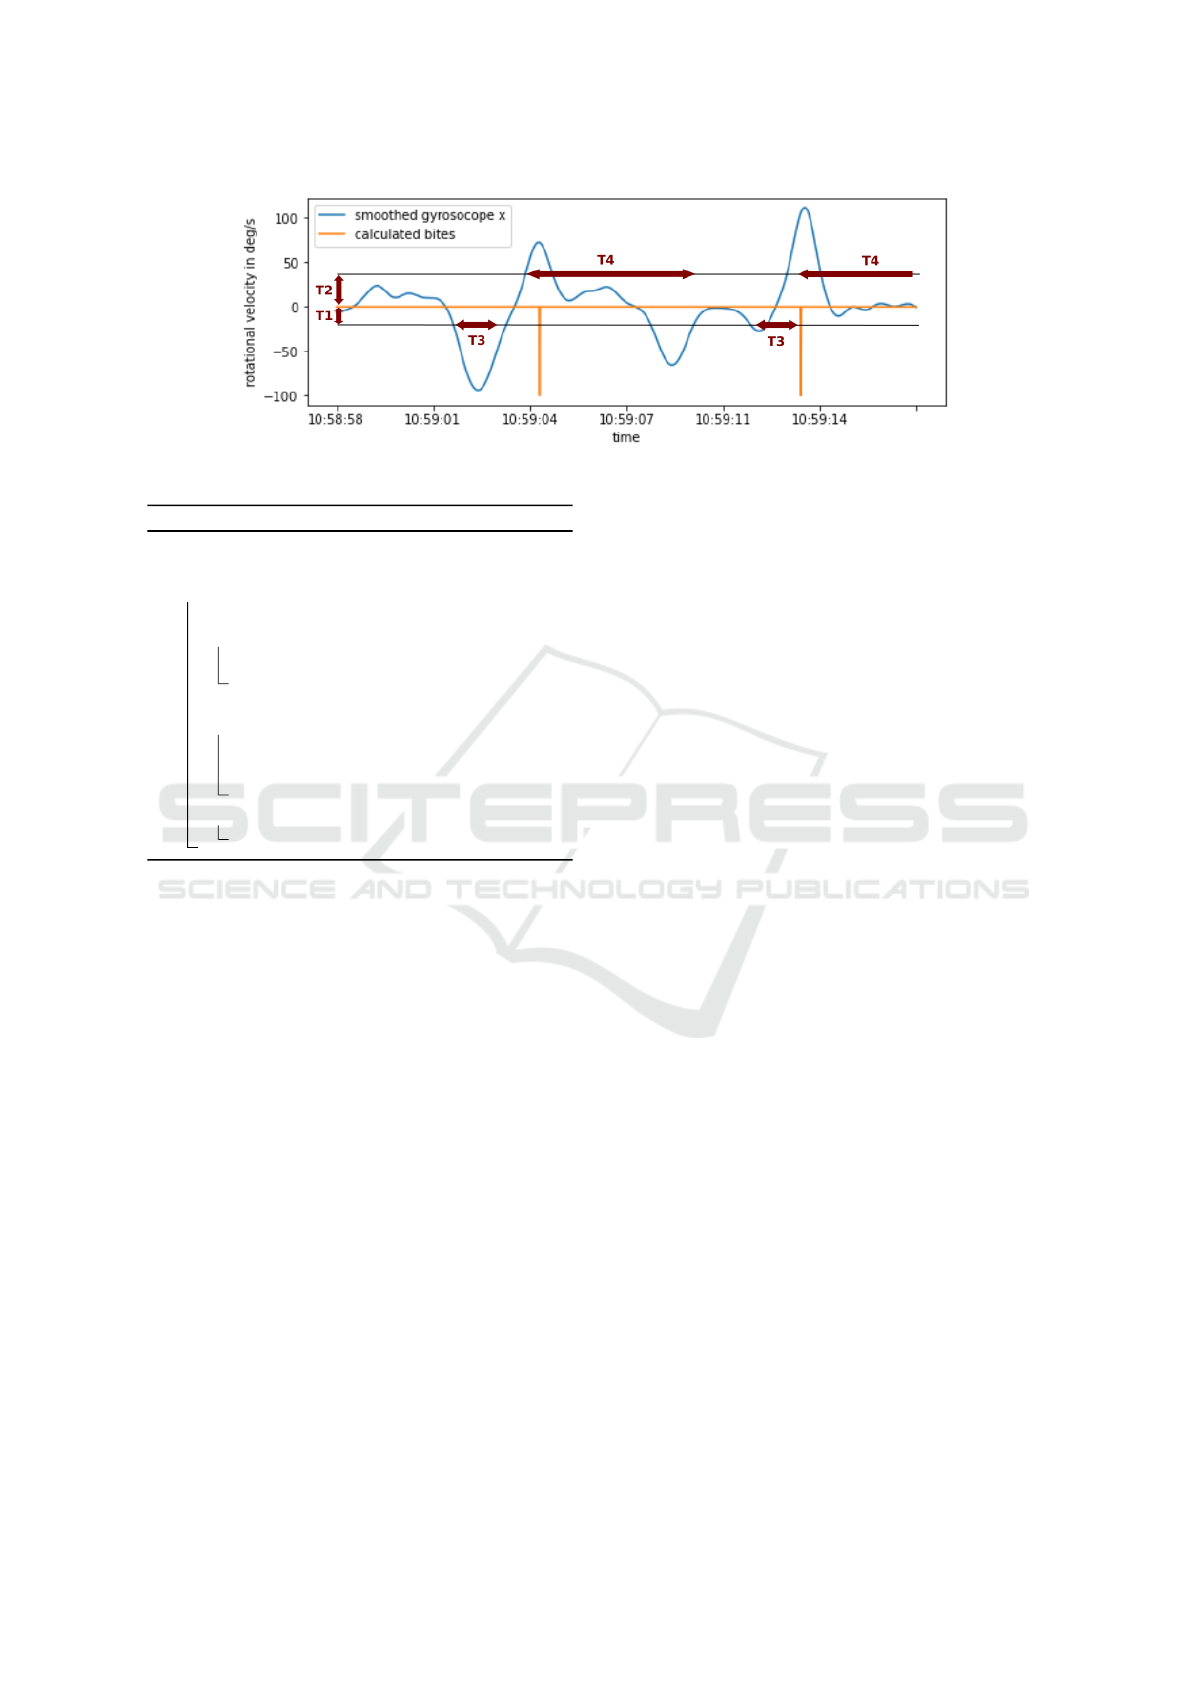
Figure 3: Gaussian filtered gyroscope-x signal with threshold for intake gesture (bite).
Algorithm 1: Intake Gesture Algorithm.
Result: Intake gesture detected
Input: Smoothened gyroscope-X (GyrX);
for i in GyrX do
Vt= GyrX[i]
if Vt < −T 1 and EV ENT = 0 then
EV ENT = 1
Let s = t
if Vt > T 2 and t − s > T 3 and
EV ENT = 1 then
Intake gesture detected
Let s = t
EV ENT = 2
if EV ENT = 2 and t − s > T 4 then
EV ENT = 0
hand near the plate (T4), which we have presented in
the Figure 3. We ran the algorithm for T1 = 15, T2 =
35, T3 = 1.5, T4 = 5 using trial and error method.
3.3.3 Segmentation
We windowed the Butterworth filtered signals and the
magnitude calculated signal into 20 seconds segments
to extract features. These windows were overlapped
at 80% (Sen et al., 2018; Stankoski et al., 2020). The
output of the intake gesture algorithm is windowed at
20 seconds with 80% overlap, plus 20 seconds of data
were added both at the beginning and in the end, re-
sulting in a window size of 60 seconds for each of the
intake gesture detected data. This was carried out as
the larger window provided us additional information
about the periodicity and density of food intake ges-
tures (Sen et al., 2018).
3.4 Feature Engineering
In this Section, we introduce the feature extraction
performed using libraries and from the intake gesture
algorithm. We further explain two methods utilized
for feature selection.
3.4.1 Feature Extraction
Library Extracted Features: We extracted fea-
tures from the 20 seconds window in the time do-
main, frequency domain, and statistical domain us-
ing the python library TimeSeriesFeatureExtraction-
Library (TSFEL) (Barandas et al., 2020).
Intake Gesture Features: From the output of the
intake gesture algorithm, we extracted features for
60 seconds window. The features extracted were the
number of intake gestures, mean, and variances in the
distance between the gestures.
3.4.2 Feature Selection
Many input features result in considerable computa-
tional inefficiency for the training of machine learning
models (Guyon and Elisseeff, 2003; Stankoski et al.,
2020). Therefore, we used the following methods to
reduce the number of features:
Correlation Technique: We calculated the correla-
tion between all the features. We selected the signal
pairs which correlated greater than 0.8. For each of
the signals in the pair, we calculated the Mutual In-
formation (MI) in regard to the label. We discard one
of the signals from the pair which had lower MI with
the label (Stankoski et al., 2021).
Recursive Feature Selection Method: A set of well-
performing features was constructed by recursively
selecting the best feature added to the set (Guyon and
Elisseeff, 2003). The process starts with no features
selected and trains and evaluates the RF model for all
single features. First, a single feature that allowed the
model to perform best was selected as the first fea-
ture of the final set. Further, we trained the model
for all the remaining features in combination with the
best feature added in the previous step. The iteration
of adding new best features continued until no further
addition of a single feature increased model perfor-
mance. We used the f1-score to evaluate the model
performance.
Have Your Cake and Log it Too: A Pilot Study Leveraging IMU Sensors for Real-time Food Journaling Notifications
535
3.5 Random Forest Classifier
Feature selection was performed using the RF model,
as this model has performed better in the previous
studies (Thomaz et al., 2015). The classification was
done by both balanced and unbalanced RF using the
Scikit-learn library (Pedregosa et al., 2011).
3.5.1 Validation and Evaluation
The Leave-One-Subject-Out (LOSO) cross-validation
is performed on the data set for classification. In this,
one test set consists of all data collected by one par-
ticipant, while the train set consists of the data of all
other participants (Stankoski et al., 2020). The Eval-
uation of the data is done with the confusion matrix
using the Scikit-learn library (Buitinck et al., 2013).
Here only the f1 score, precision, and recall are used
for evaluation.
3.5.2 Detection Criterion
Ten output samples of the classification were win-
dowed with a sliding window of one sample. The
window having positive predictions for eight output
samples for the eating class is considered as a peak.
When a peak is detected, the next peak’s search win-
dow will start again between 15 output samples (i.e.,
60 sec after the detection of the peak) till the 75th
output sample (i.e., before 300 sec) from the detected
peak sample. The subject gets the notification of the
eating activity only when the second peak is detected.
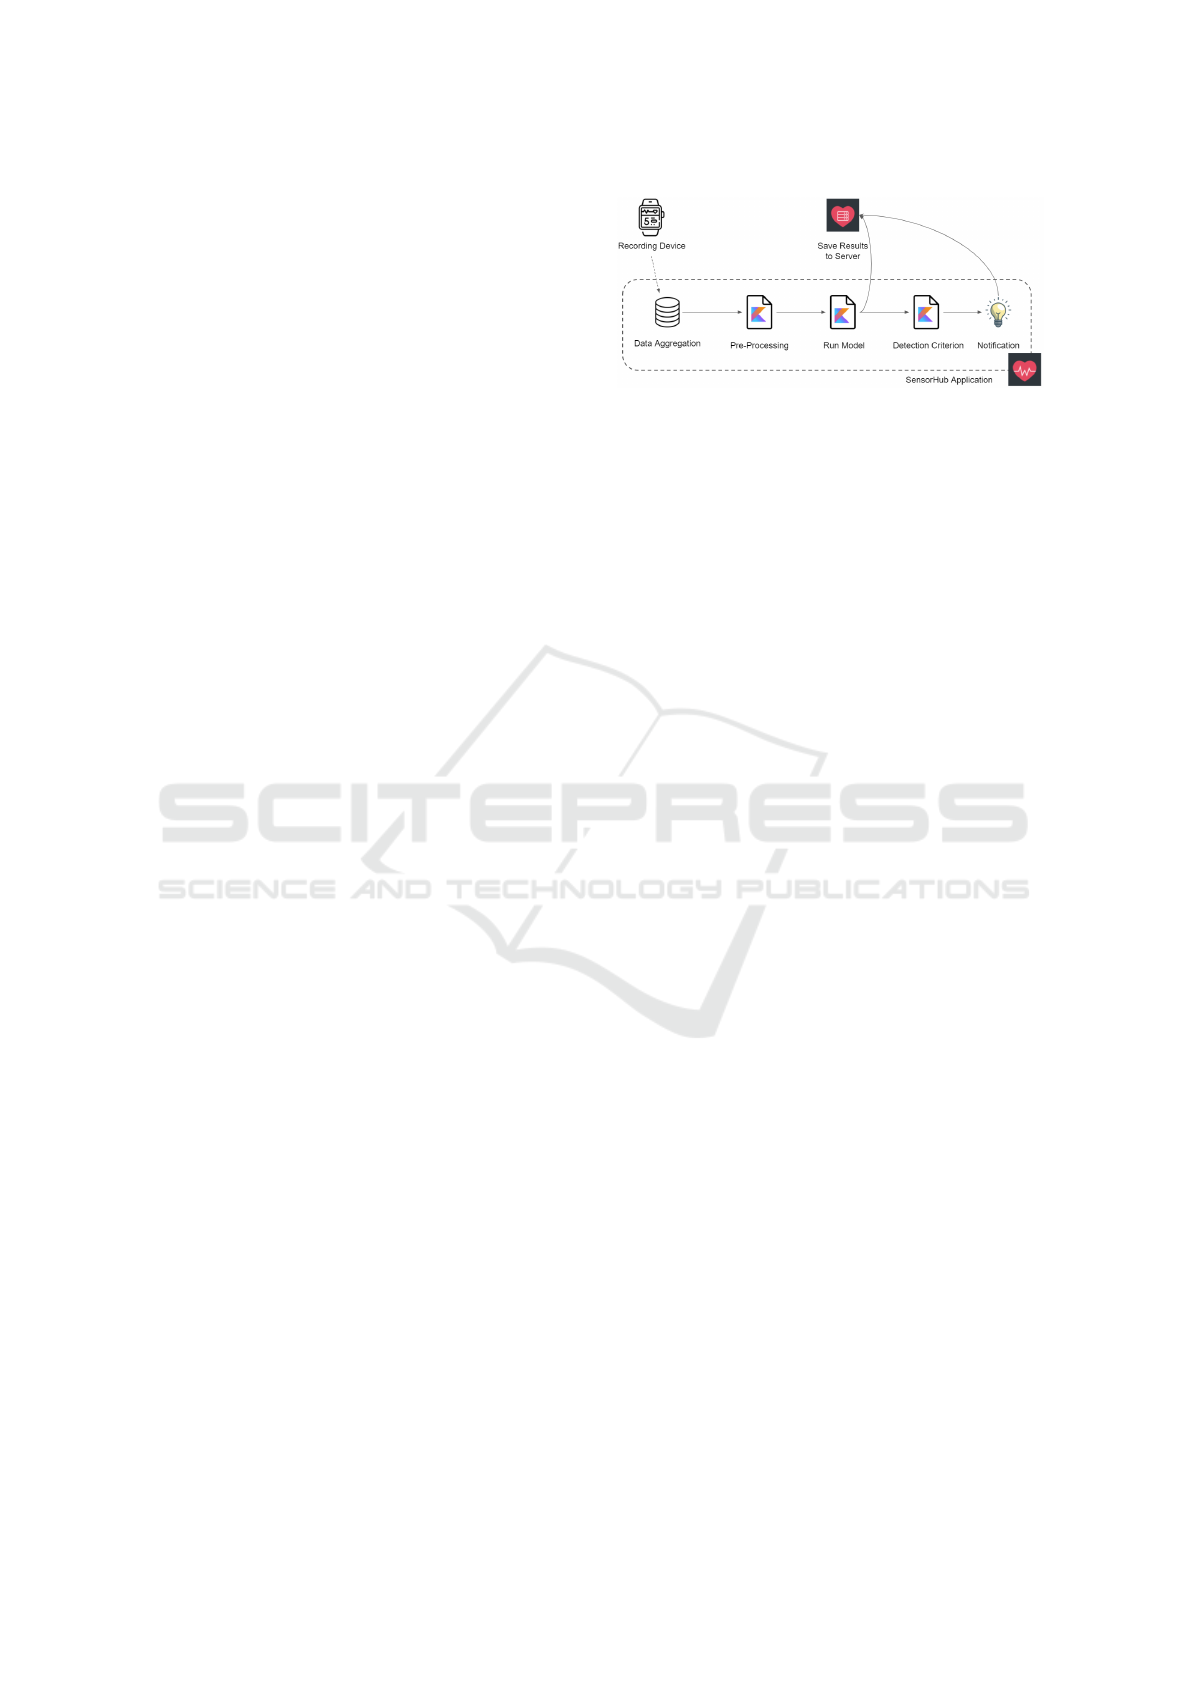
3.6 Real-time Implementation of Eating
Activity Detection
SensorHub is an internally developed data collection
android application. We extended this application
for eating activity detection by introducing real-time
machine learning and notification functionality. We
present the overview in Figure 4. We used Kotlin pro-
gramming language with Java libraries for extending
the application.
3.6.1 Preprocessing
We used the Java library (Porr, 2021) to implement
the filter mentioned in the 3.3.1 Section. We did not
have access to all the data during real-time notifica-
tion. Hence, we used 40 seconds of data to filter. Out
of the 40 seconds of filtered data, we used the middle
20 seconds for extracting features. In the Section 5,
we have mentioned the reasons for taking the middle
20 seconds of data.
Figure 4: Overview of the real-time classification Sensor
Setup.
3.6.2 Feature Extraction
We implemented the shortlisted features from the
3.4.2 Section on the smartphone. Some of these fea-
tures we implemented using the java library JDSP
(Paul, 2020). While few other features we imple-
mented manually based on their implementations in
the TSFEL python library, and six features were not
at all implemented, the details of which are mentioned
in the Section 5.
3.6.3 Model Transfer
We implemented the RF with the best hyperparam-
eter found during the feature selection in 3.4 Sec-
tion on the android smartphone. We did the im-
plementation using Java, Predictive Model Markup
Language (JPMML), and applying JPMML-SkLearn
(Ruusmann, 2016), JPMML-Evaluator (Ruusmann,
2014), and JPMML-Android (Ruusmann, 2017) li-
braries. We trained the model from the data set
collected in a semi-controlled environment, and we
tested its performance with the data collected in real-
time.
3.6.4 Detection Criterion
We follow the same detection criterion procedure fol-
lowed in 3.5.2 Section to send the notification, but
wrote the pipeline in Kotlin and Java programming
language. Based on detection criterion, the smart-
phone sends a notification whenever the eating activ-
ity is detected.
3.6.5 Evaluation
In real-time testing, the four subjects who collected
data in Section 3.2.2 again collected data in daily life
for one recording, each collected for about three hours
of data. They also labeled each of their beginning and
end of eating using the tag functionality in the appli-
cation. The subjects also received notifications for
food journaling. We used this data only for testing.
HEALTHINF 2022 - 15th International Conference on Health Informatics
536

The data of the fifth subject was not included in train-
ing but used for testing. We collected the data from
this subject for one and a half days. The subject was
a female with a dominant right hand.
Table 1: Comparison of weight balanced and unbalanced
random forest model. Abbreviations: P = Precision, R =
Recall, f1 = f1-score, RF = Random Forest, NB = Not Bal-
anced, B = Balanced.
Classifier P R f1
RF (NB) 82.3% 59.5% 0.673
RF (B) 85.4% 58.2% 0.678
4 RESULTS
This section analyses and explores the results of our
real-time food journaling notification in intermediate
steps. First, we present the filtered output of the in-
take gesture. Secondly, we present the matrix used to
select the model, the hyperparameter tuning results,
and give an account of the features selected. Further,
we present the evaluation results of the real-time no-
tification.
4.1 Feature Extraction and Model
Selection
We present in Figure 3 the Gaussian filtered gyro-
scope x data and the thresholds applied for intake ges-
ture. We extracted the number of peaks (intake ges-
ture), mean, and variance of the distance between the
peaks as the features from the output of the intake
gesture algorithm. From the 11 signals which were
Butterworth filtered, we extracted 1969 features us-
ing TSFEL library.
We implemented the feature selection methods of-
fline to know the best features and extract only these
for training and testing in real-time. Initially, we ob-
tained 617 features out of 1969 after the application
of the correlation technique to reduce features. We
further applied the recursive feature selection method
with the balanced and unbalanced weights for the RF
model using default parameters present in Scikit-learn
libraries. Table 1 presents the f1-score, recall, pre-
cision, and the number of features selected for 20
seconds window for the balanced and unbalanced RF
model. In Table 1, we observe that the balanced RF
model had a higher precision of 85.4% and f1-score
of 0.678 when compared to the unbalanced RF model,
which had a precision of 82.3% and f1-score of 0.673.
Since the balanced RF had higher precision and
f1-score, we further tuned the depths of the tree, and
the results are as presented in Table 2. In Table 2
we can observe that the model’s performance for the
training set increases with an increase in the depth of
the tree. We observe a maximum precision value of
87.0% at a depth of 45. The highest recall, 86%, is
found at a depth of 5, and the highest f1-score of 0.711
is at a depth of 20. We also notice a trade-off between
the depth, the number of features, f1-score, precision,
and recall in the test data set. We decided to choose
the depth of the model based on the f1-score to train
and test. Hence, we chose the model with a maximum
depth of 20.
Table 3 presents the 28 best features for the model
with a maximum depth of 20. Most of the features de-
rived were either low pass or band pass Butterworth
filtered signals from IMU. We also derived one fea-
ture from the Gaussian filtered gyroscope-x signal,
which was the output of the intake gesture algorithm.
4.2 Model Performance
In the real-time implementation of notification of eat-
ing, we implemented only 22 out of the 28 fea-
tures. F1 score calculated offline after LOSO reduced
marginally from 0.711 to 0.696 even after taking out
6 features that were related to Linear prediction cep-
stral coefficients, Mel frequency cepstral coefficients,
and wavelet entropy of the signal. Moreover, in the
real-time eating activity notification on the same four
subjects, the f1-score was above 0.74, and we present
the evaluation results in Table 4. Furthermore, all four
received at the right time notification for eating activ-
ity (i.e., within 3-6 minutes of the start of the eating
activity in real-time) due to the application of detec-
tion criteria.
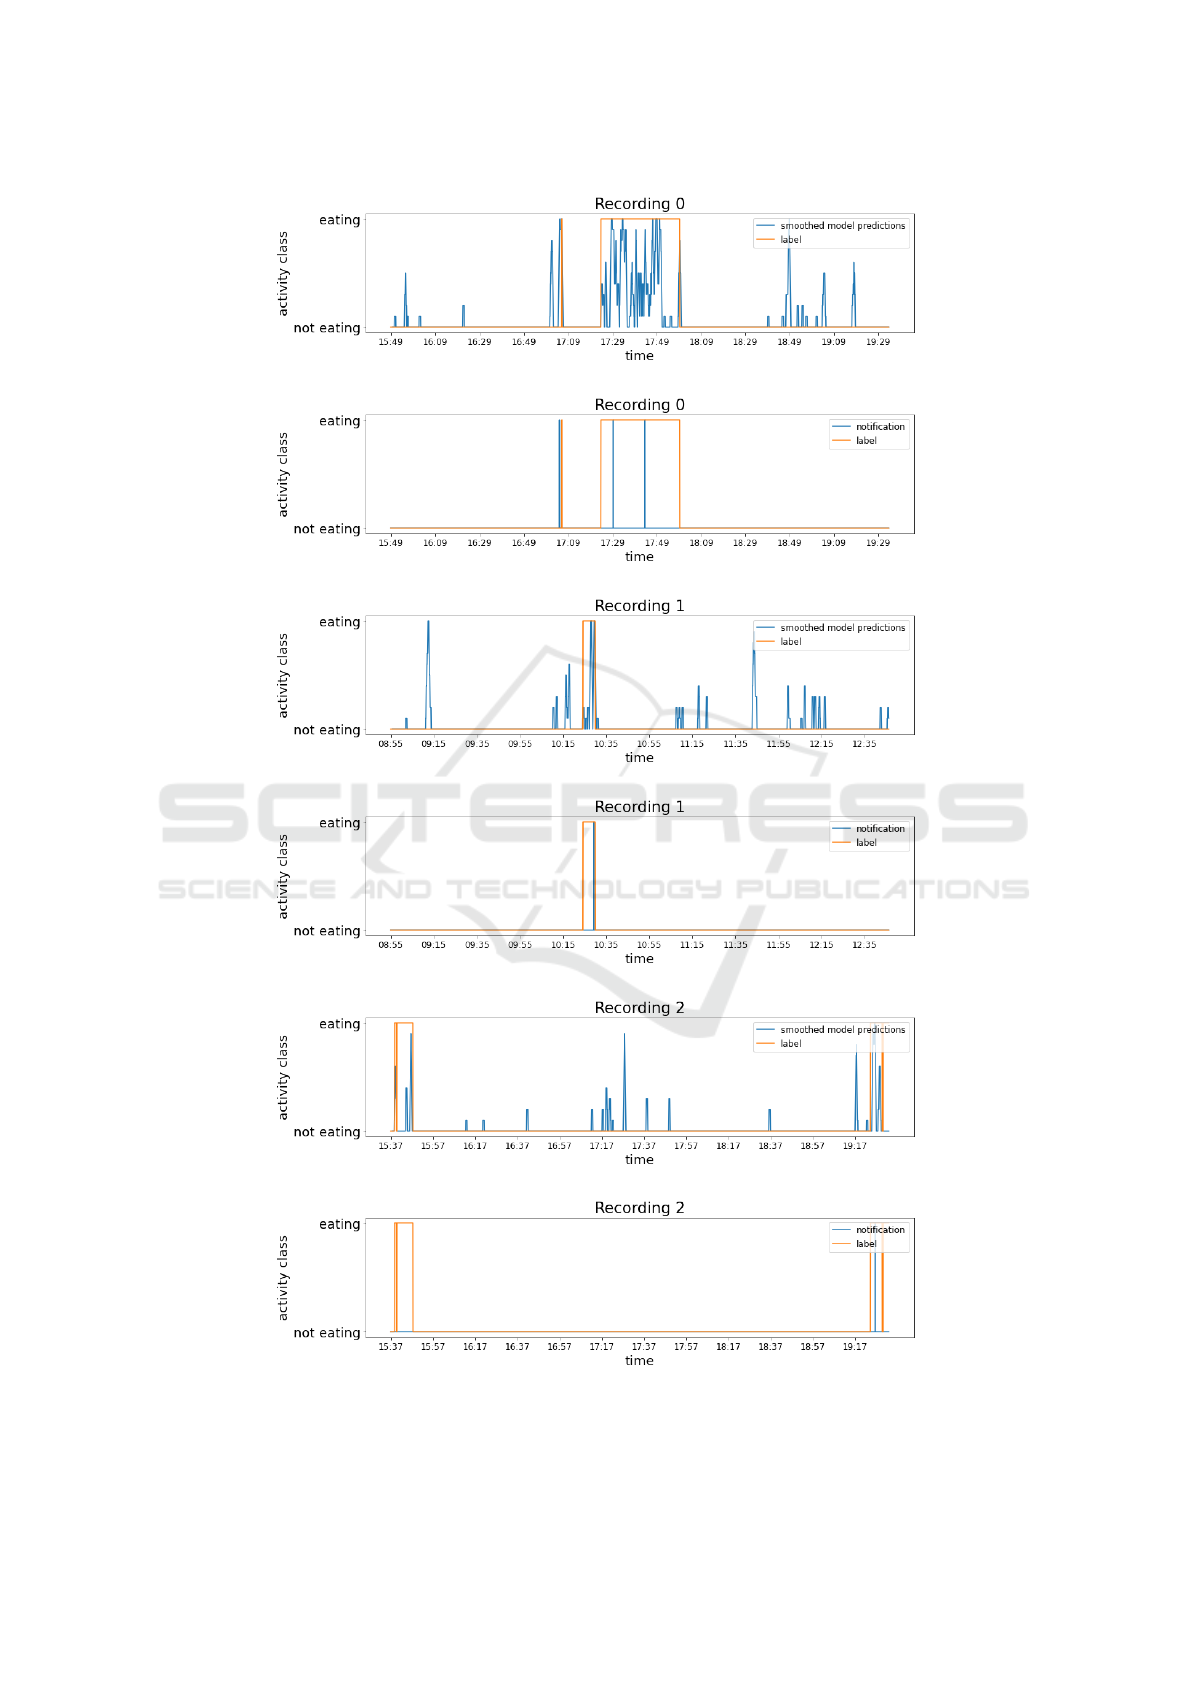
We performed real-time notification testing on the
fifth subject for 1.5 days, whose data was used only
for testing. We can observe three recordings for the
fifth subject in the Figure 5. Recording 0 was the data
collection on the first day. Recording 1 and 2 were
on the second day. The recordings in the second day
were disrupted for a few hours due to the Bluetooth
packet loss. The Figures 5 a., c., and e. represent
the eating activity classification output (predictions
are smoothened only for the graph). Figures 5 b., d.,
and f. represent the time notifications were sent to
the subject after applying the detection criterion (i.e.,
within 3-6 minutes).
5 DISCUSSION
This section discusses our interpretations and ex-
plains the implications of our findings regarding data
Have Your Cake and Log it Too: A Pilot Study Leveraging IMU Sensors for Real-time Food Journaling Notifications
537

Table 2: Results of feature selection method for different maximum depth for random forest using balanced weights.
Maximum depth Features Performance on train data Performance on test data
Precision Recall f1-score Precision Recall f1-score
5 14 47.5% 91.2% 0.624 47.9% 86.0% 0.590
10 25 70.7% 98.8% 0.824 62.7% 79.8% 0.686
15 19 80.4% 99.8% 0.891 70.4% 73.8% 0.706
20 28 88.7% 100% 0.940 78.0% 67.6% 0.711
25 25 90.4% 99.9% 0.949 79.0% 65.7% 0.704
30 20 94.9% 99.8% 0.972 82.6% 61.5% 0.687
35 29 98.9% 99.3% 0.993 86.7% 59.8% 0.695
40 27 99.7% 99.8% 0.997 86.1% 58.9% 0.686
45 25 100% 99.9% 0.999 87.0% 57.7% 0.680
50 19 100% 99.9% 0.999 85.5% 58.1% 0.678
Table 3: Twenty-eight features selected for training and
testing random forest model offline. Abbreviation: LPF =
Low Pass Filter, HPF = High Pass Filter, GF = Gaussian Fil-
ter, Acc = Accelerometer, Gyr = Gyroscope, Mag = Magni-
tude.
Filter Signal Feature
LPF Acc X 3rd histogram bucket
10th histogram bucket
Peak to peak distance
Acc Y 3rd histogram bucket
Median difference
Acc Z Maximum
Spectral roll-on
Acc Mag Slope
Positive turning points
Gyr X 2nd histogram bucket
Skewness
Spectral decrease
2nd FFT mean coefficient
5th MFCC coefficient
∗
Gyr Y Area under the curve
Slope
8th FFT mean coefficient
Gyr Z Spectral positive turning points
Maximum
1st FFT mean coefficient
Gyr Mag 0th LPCC coefficient
∗
Spectral decrease
BPF Acc X 5th MFCC coefficient
∗
Acc Y 5th MFCC coefficient
∗
5th histogram bucket
Acc Z 0th MFCC coefficient
∗
Acc Mag wavelet entropy
∗
GF Gyr X Time variance of detected gestures
Note:
∗
Features not included in real-time eating activ-
ity classification.
segmentation, feature engineering, model selection,
and model evaluation for real-time food journaling.
Table 4: Performance of real-time classification during val-
idation recordings.
Recording Precision Recall f1-score
1 62.4% 91.5% 0.742
2 72.7% 80.0% 0.761
3 95.8% 63.0% 0.760
4 72.5% 85.7% 0.785
5.1 Preprocessing
All the signals obtained are windowed for differ-
ent window sizes, including 15 seconds windows, as
mentioned in the previous studies (Stankoski et al.,
2020). However, the window size of 20 seconds with
80% overlap leads to better identification when com-
pared to the 15 seconds window. We, therefore, used
20 seconds window segments to extract features us-
ing the TSFEL library. We filtered 40 seconds of the
IMU sensor data in the real-time implementation, as
it would take us longer to get more data. However,
we used only the center 20 seconds of data to extract
features, as filtering signal using the Java library led
to distortion in the beginning and end of the signal.
We segmented the output data of the intake ges-
ture algorithm similar to the other signals mentioned
above. Additionally, we added 20 seconds of data
before and after the selected 20-seconds segment to
make 60 seconds window. We did this in contrast to
the 20 seconds window, as choosing a larger window
for feature extraction can gather additional informa-
tion about the periodicity and density of bites (Sen
et al., 2018). Thus, the time variance between de-
tected gestures extracted in the 60 seconds window is
an important feature that was selected in all the mod-
els presented in Table 2.
HEALTHINF 2022 - 15th International Conference on Health Informatics
538
(a)
(b)
(c)
(d)
(e)
(f)
Figure 5: Outputs of the random forest and the notifications sent for the labels. Figure (a), (c), and (e) are smoothed prediction
outputs. Figure (b), (d), and (f) are the notification outputs.
Have Your Cake and Log it Too: A Pilot Study Leveraging IMU Sensors for Real-time Food Journaling Notifications
539

5.2 Feature Engineering
To decrease the computational complexity and im-
prove the performance of the classification algorithm,
we performed feature selection using two stages. In
the first stage, we used the correlation technique to
remove redundant features conveying the same in-
formation, which was also used in previous studies
(Stankoski et al., 2020). This did not reduce too many
features. Therefore, we extended the work to the sec-
ond stage of feature selection. The feature selection
technique required a computational time of 45 hours.
This reduced time was achieved by using the correla-
tion technique prior to feature selection.
5.3 Model Selection
Although we trained our data on different models
(Quadratic Discriminant Analysis, Ada Boost, K-
Nearest Neighbour and Support Vector Machine), we
found that the evaluation time and F1 score did not
match 3-6 minutes and .71, respectively with that of
the RF model. Since our goal was to do real-time no-
tification, we trained on RF as it was also used in the
previous literature (Sen et al., 2018; Stankoski et al.,
2020).
We train the RF model with and without weight
balancing. We understand from the previous stud-
ies that when there is an unbalanced data set, bal-
ancing could improve the classification performance
(Stankoski et al., 2021). Our study has an unbalanced
eating activity data set (i.e., 4 hours of eating and 48
hours of non-eating activities). In a direct compari-
son of Table 4, the weight-balanced model performed
better than the unbalanced one. Hence, we consid-
ered the weight-balanced model for further parameter
tuning.
During the model selection, we chose the model
with a maximum f1-score of 0.711 and a depth of
20. We chose a higher f1-score than the models
with higher precision and recall, as f1-score is inter-
preted as a weighted average of precision and recall
(Stankoski et al., 2021).
5.4 Real-time Implementation
The RF model with a depth of 20 was used to train
the real-time classification and notification algorithm
on the smartphone. We trained the model with only
22 features out of 28 best features. Implementing
the six features without libraries was complex. More-
over, by not including the six features related to Mel-
frequency cepstral coefficients, Linear prediction cep-
stral coefficients, and wavelet entropy, the f1-score
decreased from 0.711 to 0.696. The decrease of 0.015
in the f1-score was not a very significant decrease for
the test data.
Figure 5 presents many false positive predictions
for the data collected continuously for one and half
days. The detection criterion proved successful in
transforming the continuous predictions of the RF
into a single notification to subjects during their
meals. Hence, in the Figure 5 we observe that the
labels are longer and the notifications are sent only
for few seconds after eating commences. In Figure
5 b. the label is present after notification. Here, the
subject had forgotten to label the food. Therefore, she
was reminded to label the same after receiving the no-
tification. One of the eating activities, in Figure 5 f.,
was not recognized, as the subject ate with a spoon
and did not have much of the roll motion in hand,
while for the rest of the eating periods, she used a
fork or hand. Here, we can conclude that people eat
differently with different cutlery. Although the sys-
tem recognized 4 meals out of 5, it still needs more
model training due to variations in eating gestures for
different food types.
6 CONCLUSION
We present a pilot study to send real-time notifications
for food journaling. We accomplish the aim of send-
ing real-time notifications using sensorHub applica-
tion, which collects the data from the wrist-worn IMU
sensor and performs preprocessing of the data on the
smartphone. We further extract the 22 best features
from the preprocessed data and use it as an input to a
RF model for classifying the eating activity. Finally,
a detection criterion is applied to reduce false noti-
fications and notify the subjects for food journaling
within 3-6 minutes of eating. Therefore, the method
is unobtrusive and could be applied in everyday life to
track meals and provide treatment reminders to peo-
ple with diabetes, hypertension, and dementia.
In different cultures, people eat the same food dif-
ferently by using different utensils or in hand. We can
eat wraps/rolls in hand without roll motion or eat with
a knife and fork. In this study, we classified the eat-
ing activities which involved roll motions. However,
in the future, we will incorporate eating activities that
do not include wrist-roll movement (wraps/rolls and
snacks eaten in hand) to avoid false-negative notifi-
cations. Hence, we would consider these cultural as-
pects of eating and train the model, which includes
different hand motions involved in eating. Further-
more, another arena to be considered along with eat-
ing activity classification is the classification of drink-
HEALTHINF 2022 - 15th International Conference on Health Informatics
540

ing habits, such as beverages and alcohol intake.
We can avoid the Bluetooth connection issues be-
tween IMU and smartphone by implementing the RF
model on the smartwatch. Finally, a further test of
the pipeline on more subjects would be required for
validating these results.
ACKNOWLEDGEMENTS
We thank all our subjects who gave data for this study.
We are grateful to the Federal Ministry of Economic
Affairs and Energy for generously funding this project
with funding number ZF4776601HB9. We also ex-
tend our gratitude to Dr.-Ing.Harry Freitas da Cruz
and Pascal Hecker for proofreading the paper.
REFERENCES
Amft, O., Junker, H., and Troster, G. (2005). Detection of
eating and drinking arm gestures using inertial body-
worn sensors. In Ninth IEEE international symposium
on wearable computers (ISWC’05), pages 160–163.
IEEE.
Barandas, M., Folgado, D., Fernandes, L., Santos, S.,
Abreu, M., Bota, P., Liu, H., Schultz, T., and Gam-
boa, H. (2020). Tsfel: Time series feature extraction
library. SoftwareX, 11:100456.
Bedri, A., Li, R., Haynes, M., Kosaraju, R. P., Grover, I.,
Prioleau, T., Beh, M. Y., Goel, M., Starner, T., and
Abowd, G. (2017). Earbit: using wearable sensors to
detect eating episodes in unconstrained environments.
Proceedings of the ACM on interactive, mobile, wear-
able and ubiquitous technologies, 1(3):1–20.
Biallas, M., Andrushevich, A., Kistler, R., Klapproth, A.,
Czuszynski, K., and Bujnowski, A. (2015). Feasibil-
ity study for food intake tasks recognition based on
smart glasses. Journal of Medical Imaging and Health
Informatics, 5(8):1688–1694.
Buitinck, L., Louppe, G., Blondel, M., Pedregosa, F.,
Mueller, A., Grisel, O., Niculae, V., Prettenhofer, P.,
Gramfort, A., Grobler, J., et al. (2013). Api design
for machine learning software: experiences from the
scikit-learn project. arXiv preprint arXiv:1309.0238.
Dong, Y., Hoover, A., and Muth, E. (2009). A device for
detecting and counting bites of food taken by a person
during eating. In 2009 IEEE International Conference
on Bioinformatics and Biomedicine, pages 265–268.
IEEE.
Dong, Y., Scisco, J., Wilson, M., Muth, E., and Hoover, A.
(2013). Detecting periods of eating during free-living
by tracking wrist motion. IEEE journal of biomedical
and health informatics, 18(4):1253–1260.
Gallego, J. A., Rocon, E., Roa, J. O., Moreno, J. C., and
Pons, J. L. (2010). Real-time estimation of patholog-
ical tremor parameters from gyroscope data. Sensors,
10(3):2129–2149.
Guyon, I. and Elisseeff, A. (2003). An introduction to vari-
able and feature selection. Journal of machine learn-
ing research, 3(Mar):1157–1182.
Helander, E., Kaipainen, K., Korhonen, I., and Wansink, B.
(2014). Factors related to sustained use of a free mo-
bile app for dietary self-monitoring with photography
and peer feedback: retrospective cohort study. Journal
of medical Internet research, 16(4):e109.
Kappattanavar, A. M., Da Cruz, H. F., Arnrich, B., and
B
¨
ottinger, E. (2020). Position matters: Sensor place-
ment for sitting posture classification. In 2020 IEEE
International Conference on Healthcare Informatics
(ICHI), pages 1–6. IEEE.
Paul, S. (2020). psambit9791/jdsp. https://doi.org/10.5281/
zenodo.5137347. Accessed :2021-09-14.
Pedregosa, F., Varoquaux, G., Gramfort, A., Michel, V.,
Thirion, B., Grisel, O., Blondel, M., Prettenhofer, P.,
Weiss, R., Dubourg, V., et al. (2011). Scikit-learn:
Machine learning in python. the Journal of machine
Learning research, 12:2825–2830.
Porr, B. (2021). An efficient iir filter library written in java.
https://github.com/berndporr/iirj. Accessed :2021-09-
14.
Ruusmann, V. (2014). Jpmml-evaluator. https://github.com/
jpmml/jpmml-evaluator. Accessed :2021-09-14.
Ruusmann, V. (2016). Jpmml-sklearn. https://github.com/
jpmml/jpmml-sklearn. Accessed :2021-09-14.
Ruusmann, V. (2017). Jpmml-android. https://github.com/
jpmml/jpmml-android. Accessed :2021-09-14.
Sen, S., Subbaraju, V., Misra, A., Balan, R., and
Lee, Y. (2018). Annapurna: building a real-
world smartwatch-based automated food journal. In
2018 IEEE 19th International Symposium on” A
World of Wireless, Mobile and Multimedia Net-
works”(WoWMoM), pages 1–6. IEEE.
Shim, J.-S., Oh, K., and Kim, H. C. (2014). Dietary assess-
ment methods in epidemiologic studies. Epidemiology
and health, 36.
Stankoski, S., Jordan, M., Gjoreski, H., and Lu
ˇ
strek, M.
(2021). Smartwatch-based eating detection: Data se-
lection for machine learning from imbalanced data
with imperfect labels. Sensors, 21(5):1902.
Stankoski, S., Resc¸ic¸, N., Mezic, G., and Lustrek, M.
(2020). Real-time eating detection using a smart-
watch. In EWSN, pages 247–252.
Thomaz, E., Essa, I., and Abowd, G. D. (2015). A practical
approach for recognizing eating moments with wrist-
mounted inertial sensing. In Proceedings of the 2015
ACM international joint conference on pervasive and
ubiquitous computing, pages 1029–1040.
Thompson, F. E., Subar, A. F., Loria, C. M., Reedy, J. L.,
and Baranowski, T. (2010). Need for technological in-
novation in dietary assessment. Journal of the Ameri-
can Dietetic Association, 110(1):48–51.
WHO (2021). Diabetes. https://www.who.int/news-room/
fact-sheets/detail/diabetes. Accessed: 2021-09-06.
Zhou, L., Tunca, C., Fischer, E., Brahms, C. M., Ersoy,
C., Granacher, U., and Arnrich, B. (2020). Valida-
tion of an imu gait analysis algorithm for gait moni-
toring in daily life situations. In 2020 42nd Annual
International Conference of the IEEE Engineering in
Medicine & Biology Society (EMBC), pages 4229–
4232. IEEE.
Have Your Cake and Log it Too: A Pilot Study Leveraging IMU Sensors for Real-time Food Journaling Notifications
541
