
ADAS Classifier for Driver Monitoring and Driving Qualification using
Both Internal and External Vehicle Data
Rafael Alceste Berri
1 a
, Diego Renan Bruno
2 b
, Eduardo Borges
1 c
, Giancarlo Lucca
1 d
and Fernando Santos Osorio
3 e
1
Center for Computational Science, Federal University of Rio Grande (FURG), Rio Grande, RS, Brazil
2
S
˜
ao Paulo State Faculty of Technology, S
˜
ao Paulo, Brazil
3
University of S
˜
ao Paulo, S
˜
ao Paulo, Brazil
Keywords:
ADAS, Computer Vision, Autonomous Vehicles, Driver Assistance, Machine Learning.
Abstract:
In this paper, we present an innovative safety system for driver monitoring and quality of how a vehicle is being
controlled by a human driver. The main objective of this work is linked to the goal of detecting human failures
in the task of driving, improving the predictions of human failures. In this work, we used 3D information
of the driver’s posture and also the vehicles’ behavior on the road. Our proposal is able to act when human
inappropriate behaviors are detected by applying a set of automatic routines to minimize their consequences.
It is also possible to produce safety alarms/warnings in order to re-educate the driver to maintain good posture
practices and to avoid dangerous driving using only few seconds (2.5s) of data capture. This can help to
improve traffic, drivers’ education, and benefits with the reduction of accidents. When a highly dangerous
behavior/situation is detected, using 140 seconds of recorded data, an autonomous parking system is activated,
parking the vehicle in a safe position. We present in this paper new classifiers for ADAS (Advanced Systems
of Driver Assistance) based on Machine Learning. Our classifiers are based on Artificial Neural Nets (ANN),
furthermore, the values set to adjust input features, neuron activation functions, and network topology/training
parameters were optimized and selected using a Genetic Algorithm. The proposed system achieved results
of 79.65% of accuracy in different alarm levels (short and long term), for joint detection of risk in situations
of cellphone usage, drunkenness, or regular driving. Only 1.8% of normal situations have wrong predictions
(false positive alarms) in Naturalistic Driver Behavior Dataset frames, contributing to the driver’s comfort
when he/she is using the system. In the near future we aim to improve these results even more.
1 INTRODUCTION
Distraction during driving is a serious and growing
problem on the roads (WHO, 2018). Up to 95% of
all fatal crashes in traffic are caused by human er-
rors (Amditis et al., 2010), and these accidents are
among the 8 main causes of people’s death in the
world (Buckeridge, 2015).
About only 1% of the drunk drivers are addressed
by the police (CDC, 2015), even though there are
rigid transit laws in many countries. These facts in-
crease the concern about drunk driving, as demon-
a
https://orcid.org/0000-0002-5125-2756
b
https://orcid.org/0000-0001-6905-6422
c
https://orcid.org/0000-0003-1595-7676
d
https://orcid.org/0000-0002-3776-0260
e
https://orcid.org/0000-0002-6620-2794
strated by a survey conducted in pubs of Porto Alegre
city (Brazil) shows that 51% of the pub-goers will be
driving their vehicles after drinking alcohol (De Boni
et al., 2012).
The drivers’ attention problems (e.g. with eyes
off the road, hands off the steering wheel, and the
mind off the task) are the main causes of the driver
dangerous behavior (Strayer et al., 2011). When the
driver talks on a cell phone, the driver’s attention is
inhibited from the processing of visual information
(Strayer et al., 2003), and also in hand-held phone
(usage with one hand off the steering wheel), which
increases the danger and cognitive distraction (Strayer
et al., 2013).
There are numerous systems in modern vehicles
to help drivers, known as ADAS (Advanced Driver-
Assistance Systems), which improve traffic safety.
Great scientific efforts have been made to develop au-
560
Berri, R., Bruno, D., Borges, E., Lucca, G. and Osorio, F.
ADAS Classifier for Driver Monitoring and Driving Qualification using Both Internal and External Vehicle Data.
DOI: 10.5220/0010880100003124
In Proceedings of the 17th International Joint Conference on Computer Vision, Imaging and Computer Graphics Theory and Applications (VISIGRAPP 2022) - Volume 4: VISAPP, pages
560-567
ISBN: 978-989-758-555-5; ISSN: 2184-4321
Copyright
c
2022 by SCITEPRESS – Science and Technology Publications, Lda. All rights reserved

tonomous and intelligent vehicles in the last years, as
the research project CaRINA (Fernandes et al., 2014)
developed at the LRM
1
Lab. at USP (Brazil). Ca-
RINA is an autonomous vehicle able to sensing its
environment and navigating without human support
(Gehrig and Stein, 1999). Then, human error possibil-
ities in autonomous mode are reduced. Autonomous
vehicles can also need special requirements and roads
adapted for autonomous safe driving (Badger, 2015),
then, in some places and specific situations, (safe)
manual driving is still necessary. Thus, while the ve-
hicles still have a steering wheel, manual driving can
be required by a human.
This work proposes a novel system for avoiding
risk driving situations in modern vehicles. The sys-
tem uses cameras, inertial sensors, car telemetry, and
road lane data. The system aims to indicate two lev-
els of risk, the Lowest alarm (first alert for driver re-
education) and the Highest alarm (the Autonomous
Parking System is activated), or “no risk” (regular
driving) related to the driving behavior, thus, the au-
tonomous parking system can minimize the risk sit-
uation and even get control of the car, stopping the
vehicle in a safe position.
This paper is structured in the following sections:
in Section 2 related works are described; in Sec-
tion 3 the proposed safety system is described; the
Autonomous Parking System is described in Section 4
results are shown; and finally, conclusions are set out
in Section 5.
2 RELATED WORKS
This section shows some other works of driver mon-
itoring and driving qualification related to the pro-
posed system (Section 3) for detection of cell phone
usage, drunkenness, and dangerous driving recogni-
tion.
Some works (Veeraraghavan et al., 2007), (Se-
shadri et al., 2015), (Berri et al., 2016), (Lee et al.,
2006), and (Craye and Karray, 2015) allow monitor-
ing the driver using RGB cameras, but they rely on
lighting, furthermore, they depend on certain consis-
tency and homogeneity of lighting to detect and seg-
ment the driver correctly. The segmentation accuracy
of the driver can be impaired by internal parts of the
vehicle or other objects in-vehicle with colors close
to human skin color. In a real situation, the incidence
of illumination may vary which makes this a relevant
problem. For example, in the vehicle’s regions where
the sunlight reaches, the pixels of the acquired im-
1
LRM Lab. USP-ICMC http://shorturl.at/dnqxE
age from the camera saturates, in other words, they
tend to have a bright color. The vehicle movement
causes yet the displacement of the regions reached by
the sunshine. All these problems hamper the usage of
driver monitoring based RGB cameras in a real envi-
ronment.
Cameras can acquire 2D information about the
scene, without considering the depth related to the
pixels captured by the camera. Using an active 3D
sensor with its own lighting that is not visible (in-
frared) and tolerant to the incidence of the sun is inter-
esting for driver monitoring. Thus, with 3D data, we
can be able to track the driver movement in-vehicle,
without color and light intensity influence of the pas-
sive devices. Craye and Karray (Craye and Kar-
ray, 2015) propose a method that uses a 3D Sensor
(Kinect), but it uses a fusion of sensors (with RGB
cameras), and then, depends on RGB data and is sus-
ceptible to sunlight reaches.
The sensor position for capturing data from the
driver is important. Lateral position (Veeraraghavan
et al., 2007) is restrictive for passengers besides the
driver. The frontal position (for example (Berri et al.,
2016)) to the driver is usual among works for driver
monitoring using the image and 3D data.
Avoiding intrusive systems as (Deshmukh and De-
hzangi, 2017), that use for example electrodes, is
a good way to improve the comfort of driving. In
an intrusive system, the driver must participate di-
rectly in the driving risk qualification system putting
electrodes or other equipment on his/her body be-
fore using the system. In other non-intrusive meth-
ods (Haile, 1992), (Minist
´
erio das Cidades, 2012),
and (Park et al., 2018), the driver needs to partici-
pate actively to detect the risk. It is interesting that
the driver does not participate in any activity of the
process of driving risk detection. Thus, the driver can
forget that he/she is being monitored and should act a
natural way.
The driver re-education is an interesting point for
risk detection, thus, the driver should be advised of
the detection system of his/her risk attitude, changing
his/her behavior to avoid this risk situation (posture
or driving) in the future. Some related works (Artan
et al., 2014) and (Seshadri et al., 2015) are not able to
stimulate the re-education, they do not permit just-in-
time alerts.
In some safety systems, the driver may not be
monitored, thus, driving risk situations are allowed.
The reason for these operation restrictions is because
the system does not verify if the driver is using the
system (Minist
´
erio das Cidades, 2012), or the elec-
trodes can be installed on a passenger (Deshmukh and
Dehzangi, 2017). Some ignition systems (Deshmukh
ADAS Classifier for Driver Monitoring and Driving Qualification using Both Internal and External Vehicle Data
561

and Dehzangi, 2017) can be deceived by a passenger
instead of a driver.
3 SAFETY SYSTEM PROPOSAL
The driver monitoring and driving qualification sys-
tem proposed in this paper is an extension of Berri and
Os
´
orio (Berri and Os
´
orio, 2018a), (Berri and Os
´
orio,
2018b) and aims to detect moments of driving risk,
using data from driver posture (3D) and vehicle be-
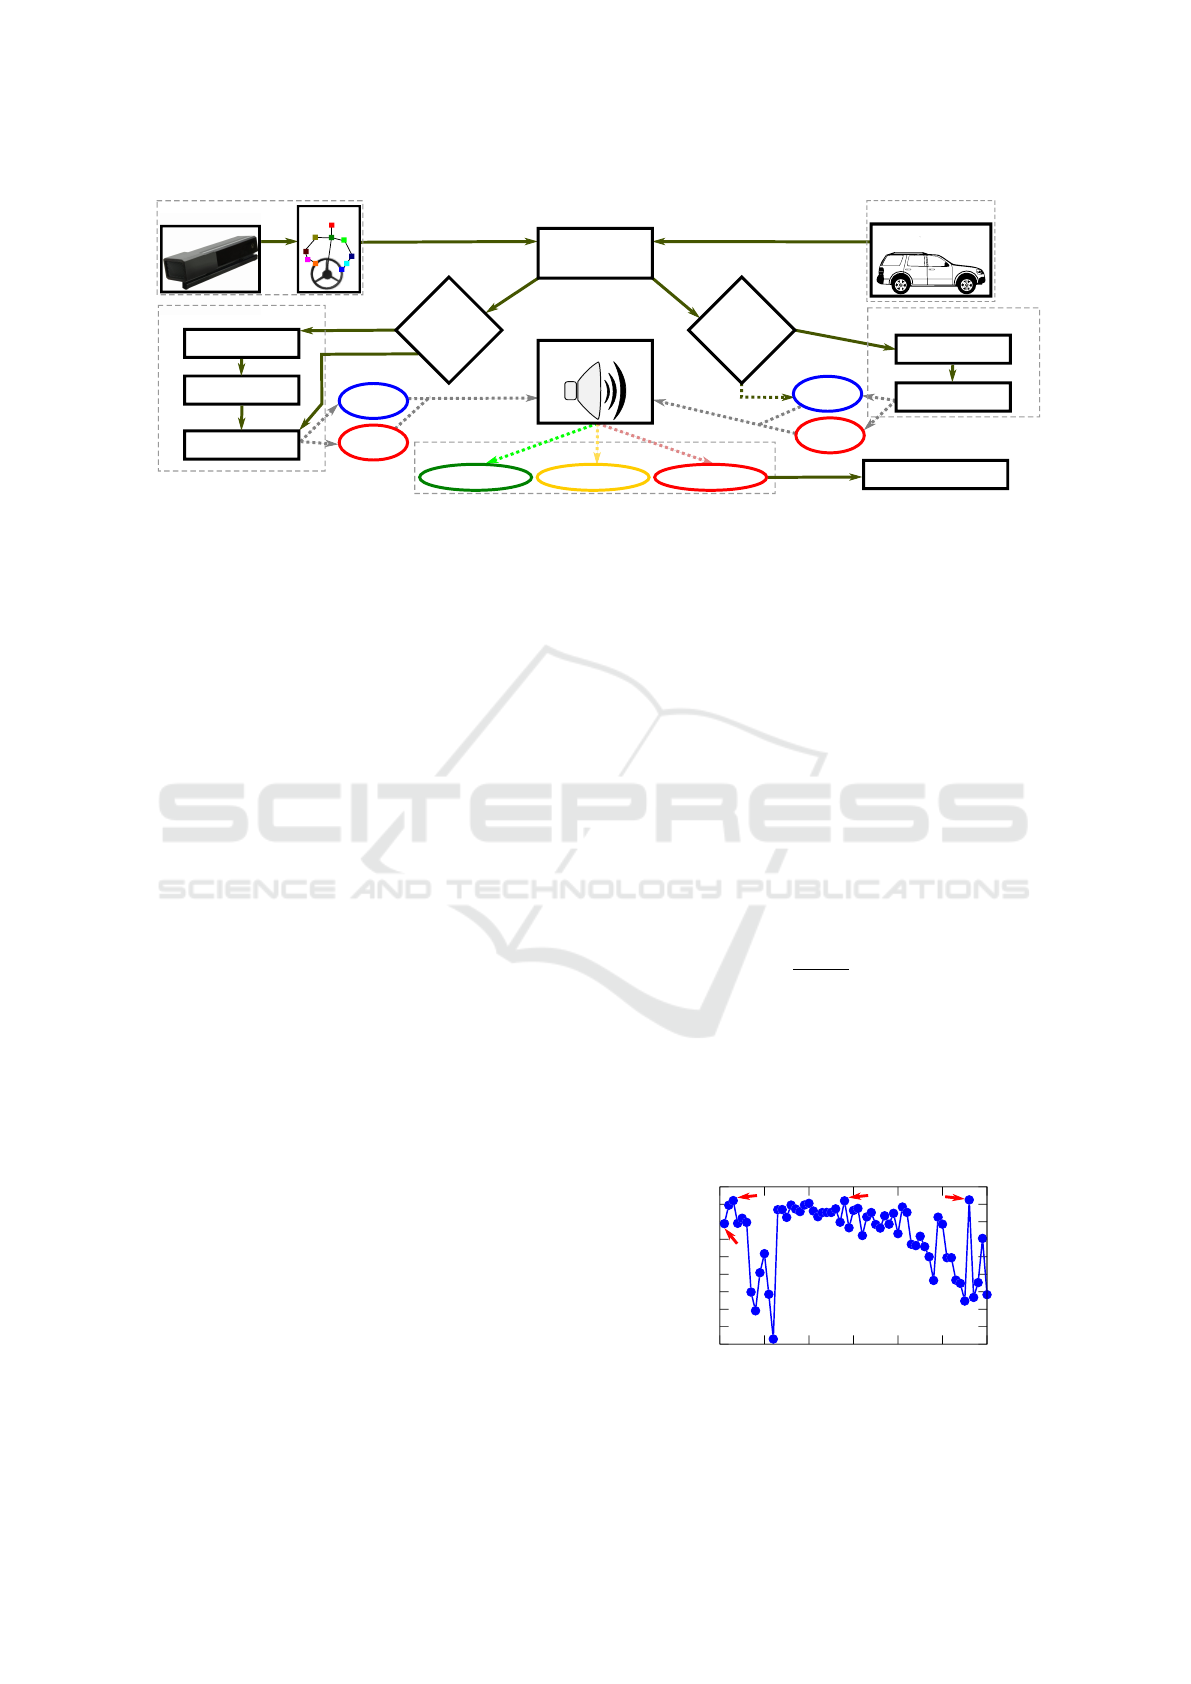
havior (driving). The system flow is shown in Fig. 1.
It uses two temporal analyses of the data to determine
when he/she is at risk. Then, it allows the driver to
keep good practices of posture and avoiding risks of
dangerous driving. How close or far is the driver pose
and driving from “the normal” could be determined
experimentally (see Section 4) using machine learn-
ing and a dataset with samples labeled with “no risk”
and “risk” situations.
The acquisition module gets new 3D data frames
from Kinect v2
2
(driver monitoring) and from the ve-
hicle (driving style). The 3D data frame is passed to
the Skeleton Data extraction (Shotton et al., 2013) be-
fore extracting features whose outputs are 5 driver’s
joints: head, left shoulder, right shoulder, left hand,
and right hand.
The features are obtained from 3D positions of left
and right hands of driver’s skeleton using two differ-
ent origins. The first reference origin is in the Steer-
ing Wheel, and its position and orientation are estab-
lished on an initial calibration. The second one is
the Driver’s Head. Its position is the same of head’s
joint of driver’s skeleton and as its orientation is used,
the Steering Wheel orientation is rotated by X-axis
in 180 degrees. Table 1 shows the 20 candidate fea-
tures of Driver Monitoring and their abbreviations, 10
for each origin, which is used to calculate the fea-
ture. The 3D positions of each hand of the driver
are converted to the coordinate system of the Steering
Wheel and Driver’s Head (SW and DH reference ori-
gins). The feature values are normalized between −1
and +1 using f eature
n
(i) = f eature
v
(i) ∗shoulder
l
∗
ϕ(i), where, f eature
v
is the feature calculated value,
shoulder
l
is the driver shoulder’s length (3D distance
between left shoulder and right shoulder joints), a fac-
tor ϕ and i defines each feature. The factor ϕ is de-
fined experimentally using the dataset and describes
how representative is the feature value for the driver’s
body.
The features of Driving Style are data from the
car telemetry (vehicle status), from the inertial sen-
2
For more information about Microsoft Kinect v2, see
the link https://goo.gl/QbMuBF.
Table 1: Candidate features for Driver Monitoring.
Features Features Abbreviation
Both hands: minimum distance,
maximum distance.
Left Hand: distance, x, y, z.
Right Hand: distance, x, y, z.
minDistHands,
maxDistHands.
distLH, xLH, yLH, zLH.
distRH, xRH, yRH, zRH.
From (origins): Steering Wheel (SW ) and Driver’s head (DH)
Total: 10 features for each origin (SW and DH), a total of 20 features
sors inside of the vehicle (accelerometers and gyros),
and related to the lane and road system detection. In
Table 2, all features obtained are shown.
Table 2: Candidate features for Driving Style.
From Features Features Abbreviation
Car
Telemetry
Acceleration
Speed
Speed Pedal Level
Brake Pedal Level
Steering Wheel Angle
accel
speed
SPlevel
BPlevel
SWangle
Inertial
Sensors
Accelerometer X, Y, Z
Gyroscope X, Y, Z
aX, aY , aZ
gX, gY , gZ
Lane and
Road
Distance to the Center Lane
Lane Angle to the Vehicle
Straight Road
distCL
lAngle
sRoad
The Straight Road is a boolean feature and it indi-
cates whether the actual road segment is straight (1)
or curved (0). Every feature data of Driving Style are
normalized between −1 and +1. The other subsys-
tems of this Safety System are:
Short-Term Recognition System (ST)
It is responsible for recognizing risk poses of the
driver and driving risks, using it during a short data
period with nST frames. At the end-of-period, it cal-
culates the average and standard deviation values of
this period for each feature and they are used as the
inputs for the classifier. The classi f ierST is previ-
ously trained and is able to predict normal and risk
situations in short-term data. Short-Term Recognition
System uses a buffer of length nbST with the lasts
predictions of nST periods and, check if at least 80%
of these predictions are “risk”, then the output of the
subsystem is “risk”, otherwise, “no risk”. The current
output of ST system can be changed when arrives a
new prediction (end of period) at the buffer. The nST ,
nbST , and classi f ierST were established in experi-
ments (Section 4).
Long-Term Recognition System (LT)
It uses long data sequences of the lasts nLT frames
(window) to predict risks. When the window is with
nLT previous data frames (full), the Statistical Data
(average and standard deviation) can be calculated
VISAPP 2022 - 17th International Conference on Computer Vision Theory and Applications
562
Kinect v2
Driver monitoring
No risk
Risk
Skeleton
Extraction of
features
Driving style
Car sensors and
telemetry, ADAS
Is the end-
of-period?
Is the data
window
full?
Statistical Data
Classification
Rating Buffer
Statistical Data
Classification
No alarm
Lowest alarm
Highest alarm
Alarm Control
No risk
Risk
Short-term Recognition System
Long-term Recognition System
nothing new
Output
New data
no
yes
no
yes
Autonomous Parking
Figure 1: Proposed monitoring and driving qualification system.
for each selected feature in the present LT data win-
dow. The classi f ierLT is able to predict the statistical
data based on calculated features between “risk” or
“no risk” (output of subsystem). In the initial frames,
when the window is not yet full, the system output for
these frames is “no risk”. The output of this subsys-
tem is a strong indication for the system if the driver
is in a dangerous pose or driving, or, in a normal situ-
ation. The nLT, and classi f ierLT were established in
experiments (Section 4).
Alarm Control
The output of the system for each frame is an alarm-
ing level to the driver with three possibilities values,
“No alarm”, “Lowest alarm” and “Highest alarm”.
The alarm volume is off for “No alarm” when the
Short-Term Recognition System is “no risk” (good
pose and driving). When a risk is detected by the
Short-Term Recognition System and the Long-Term
Recognition System detects “no risk”, the volume is
“Lowest alarm” (small advice or a warning sound is
emitted to the driver). Finally, when output is “High-
est alarm” (strongest advice) when both subsystems,
Short-Term and Long-Term predict “risk”, then the
Autonomous Parking System (Bruno et al., 2018) is
activated, then the vehicle will be parked as soon as
possible, autonomously.
4 RESULTS
In this work, we use the Naturalistic Driver Behavior
Dataset (NDBD) (Berri and Os
´
orio, 2018a) and (Berri
and Os
´
orio, 2018b), which includes data of driver be-
haviors from both synchronized 3D positions of the
driver and car telemetry considering mobile distrac-
tion, drunk driving, and regular driving were used in
all experiments and tests on the Safety System (Sec-
tion 3). The experiments described here use data from
14 participants (7 for training and 7 for validating)
in two kinds of recorded tests from the NDBD, the
regular driving and distracted. We used 9-fold cross-
validation (Kohavi, 1995) in all classifiers’ training
for statistical analysis.
Using all data, we could be obtained the ϕ (see
Section 3) for each feature. The ϕ adopted was the
minimum value of all frames and participants, using
the absolute value for f eature
v
, f eature
n
equal 1 and
the driver shoulder length (shoulder
l
) obtained from
the initial frame. Table 3 shows the ϕ of each driving
monitoring.
Using Linear SVM (Cortes and Vapnik, 1995) for
finding the maximum-margin hyperplane for “risk”
and “no risk” classes, NDBD in periods between 5
and 300 frames, combinations of all the 68 candidate
features (34 averages and 34 standard deviations), and
Findex
5
(Findex
5
=
26×PR
25×P+R
, where, P is Precision
and R is Recall of normal situations predictions), we
could obtain some group of the features and frequency
(nST and nLT ) that avoids false risk alarms. In each
period, the test was started by with 1 feature until the
64 features are included, being included one feature
by each step, searching for the set of features that
makes Findex
5
better (higher). Fig. 2 shows the best
test for each period length and quantity of feature.
0.91
0.915
0.92
0.925
0.93
0.935
0.94
0.945
0.95
0.955
0 50 100 150 200 250 300
Findex
Period length (frames)
140
5
15
280
Figure 2: Graph of the best Findex
5
obtained in each period
length.
ADAS Classifier for Driver Monitoring and Driving Qualification using Both Internal and External Vehicle Data
563
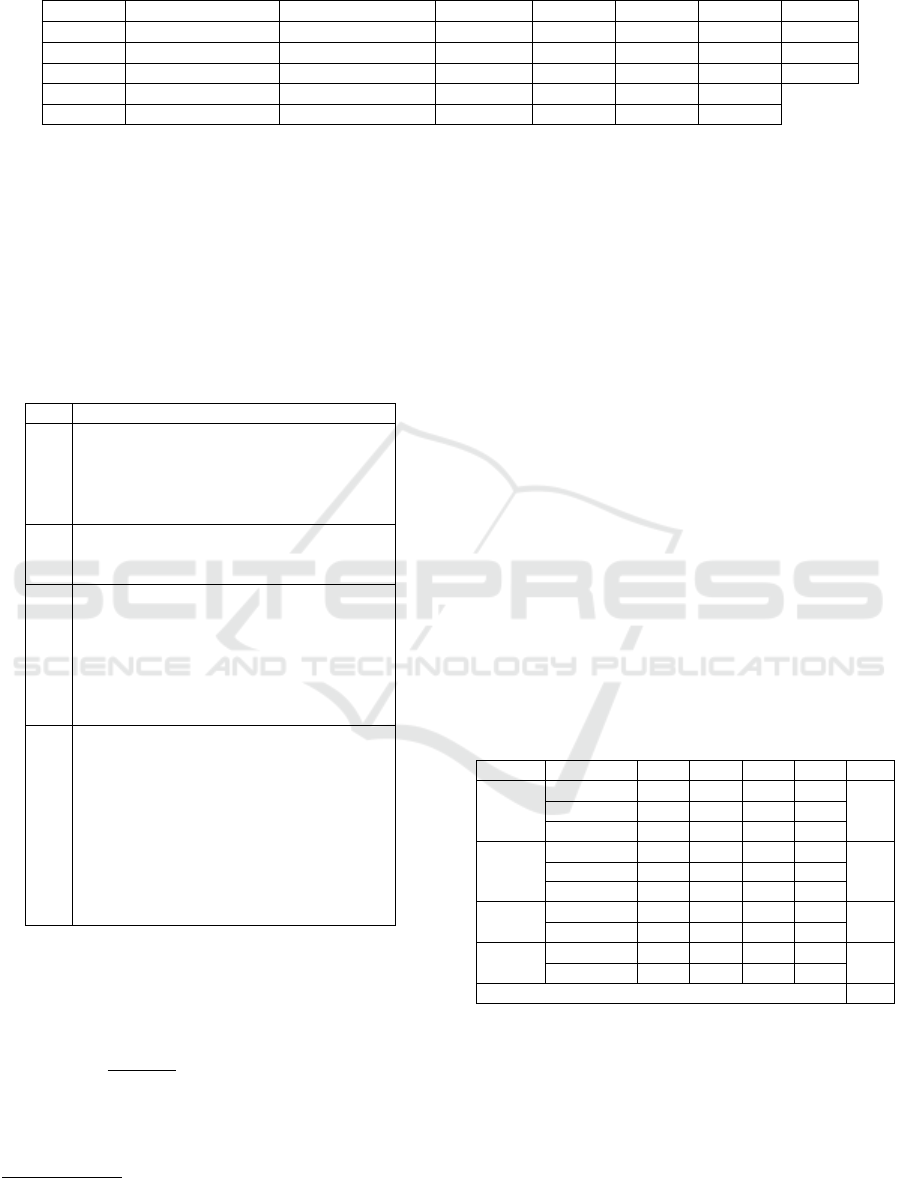
Table 3: ϕ adopted for each feature of driver monitoring.
Feature minDistHands
SW
maxDistHands
SW
distLH
SW
xLH
SW
yLH
SW
zRH
SW
xRH
SW
ϕ 1.69 1.62 1.66 8.11 4.09 1.72 4.94
Feature minDistHands
DH
maxDistHands
DH
distRH
SW
yRH
SW
zRH
SW
xLH
DH
yLH
DH
ϕ 2.86 2.62 1.61 5.35 1.68 7.89 3.32
Feature distLH
DH
distRH
DH
zLH
DH
xMD
CM
yMD
CM
zMD
CM
ϕ 2.62 2.75 2.76 5.12 3.32 2.97
Considering the Long-Term (LT), both periods,
140 and 280 frames, obtained the highest Findex
5
of
the 0.951, thus they were features and nLT candidates
for classi f ierLT. For short-term (ST or nST ), we
chose periods of 5 (minimum period tested) and 15
frames with Findex
5
of the 0.944 and 0.951, respec-
tively. The selected features for each candidate fre-
quency are shown in Table 4, where, @AV indicates
average and @SD standard deviation feature.
Table 4: All features selected for nLT and nST candidates.
Len Selected Features
5
xRH@AV
DH
, zLH@AV
SW
, BPlevel@AV , gY @AV ,
gY @DP, zRH@AV
DH
, aX@AV , yRH@DP
SW
,
sRoad@DP, minDistHands@DP
DH
, gZ@AV ,
aX@DP, lAngle@DP, zRH@AV
SW
and xRH@DP
DH
15
SPlevel@DP, xLH@AV
DH
, yRH@AV
SW
,
xLH@AV
SW
, accel@AV , zRH@SD
DH
,
distLH@AV
DH
, distLH@AV
SW
and xRH@AV
SW
140
minDistHands@AV
DH
, xLH@AV
DH
, gZ@SD,
BPlevel@AV , aY @AV , aY @SD, speed@SD,
gX@AV , SWangle@AV , gZ@AV , gX@SD, aZ@AV ,
lAngle@SD, zRH@DP
DH
, zLH@AV
DH
, distCL@SD,
zRH@AV
SW
, distLH@AV
DH
, yRH@DP
DH
, gZ@AV ,
sRoad@AV , BPlevel@SD, yRH@AV
DH
, aZ@SD and
xRH@AV
SW
280
maxDistHands@AV
DH
, xRH@AV
SW
, accel@SD,
aZ@AV , maxDistHands@SD
DH
, lAngle@AV ,
zLH@AV
DH
, zLH@AV
SW
, distLH@AV
SW
,
minDistHands@AV
SW
, yRH@MED
DH
, gY @AV ,
sRoad@SD, SWangle@SD, distLH@AV
DH
,
xRH@SD
SW
, distRH@AV
DH
, aX@AV , distCL@AV ,
aY @AV , aY @SD, lAngle@SD, BPlevel@AV ,
BPlevel@SD, gZ@AV , gX@SD, gZ@SD,
SWangle@AV , SPlevel@SD, sRoad@AV ,
xRH@SD
DH
and gX@AV
Using the NDBD training frames, Multilayer Per-
ceptron (MLP) (Jain et al., 1996) as the classification
technique, and Rprop (Riedmiller and Braun, 1992)
for training the network, we obtained the classifiers.
Two options of activation functions were used, Gaus-
sian (f (x) =
β(1−e
−αx
)
(1+e
−αx
)
) and Sigmoid (f (x) = βe
−αx
2
).
A binary coded Genetic Algorithm
3
(GA) (Gold-
berg, 1989) with 10 individuals and 400 generations,
with a crossover rate of 80%, the mutation rate of
3
The library GALib version 2.4.7 is used (available in
http://lancet.mit.edu/ga).
5%, and tournament selection (empirically defined)
was used for finding training and network parameters.
The GA chromosome code adopted has a length of
66 bits. The GA equation of the fitness is f itness =
κFindex
5
+ (1 − κ)A, where, A is the classifier accu-
racy, and κ is 0.6 for ST classifiers (5 and 15) and
0.9 for LT (140 and 280 frames). Table 5 shows the
boundings for each parameter and group of features
(and frequency), where α and β were parameters of
activation functions, HN was the number of neurons
in the hidden layer, and interac was used to define
the number of the interaction of the Rprop learning
method. The same number of neurons in the input
layer as the number of features that were used in each
test, one neuron was used for the output layer, and for
the hidden layer were used HN neurons as the net-
work constitution of classifiers. The highest f itness
(individual parameters) was adopted in each test for
each activation function/period length. GA was per-
formed three times for each test. Table 6 shows the
best parameters found by GA and Figure 3 shows the
training results. We can see that all classifiers are sta-
tistically similar for averages of Findex
5
and accu-
racy. Then, GA found statistically similar parameters
for them.
Table 5: Parameters obtained from GA for MLP.
Param. Groups –> 5 15 140 280 Bits
α
Minimum 10
−3
10
−3
10
−3
10
−3
25Maximum 10 10 10 10
Decimal 6 6 6 6
β
Minimum 10
−3
10
−3
10
−3
10
−3
25Maximum 10 10 10 10
Decimal 6 6 6 6
HN
Minimum 20 21 35 43
8
Maximum 30 31 45 53
interac
Minimum 100 100 100 100
8
Maximum 500 500 500 500
Genetic code size 66
Using the options for ST being: sigmoid (ss) and
gaussian (sg) as activation function, and nST with 5
and 15. For LT, gaussian (lg), and sigmoid (ls) with
nLT options of 140 and 280. Using nbST = 5, or in
other words, using 5 last predictions for ST to detect
risk pose, we could constitute eight distinct systems
that use the Safety System proposal of this paper. Fig-
ure 4 shows the results obtained for the system using
validation data of NDBD.
VISAPP 2022 - 17th International Conference on Computer Vision Theory and Applications
564
0.4
0.5
0.6
0.7
0.8
0.9
1
1.1
GAUSSIAN5
SIGMOID5
GAUSSIAN15
SIGMOID15
GAUSSIAN140
SIGMOID140
GAUSSIAN280
SIGMOID280
Figure 3: Graph of classifiers obtained from GA using the
training data (dark colors) of cross-validation and validation
data (light colors), where, the red bar is Findex
5
, the green
bar is the accuracy, and the boundings of standard deviation
are shown in gray.
Table 6: Parameters from AG to MLP classifiers.
Classifier α β HN interac
Gaussiana5 0.002 1.241 30 441
Sigmoide5 3.484 4.209 30 479
Gaussiana15 0.030 2.144 21 347
Sigmoide15 3.861 2.672 31 472
Gaussiana140 0.878 0.680 44 372
Sigmoide140 2.769 0.863 38 462
Gaussiana280 0.014 5.509 53 393
Sigmoide280 1.482 1.060 50 394
0
0.1
0.2
0.3
0.4
0.5
0.6
0.7
0.8
0.9
1
sg5#lg140
sg5#ls140
ss5#lg140
ss5#ls140
sg15#lg140
sg15#ls140
ss15#lg140
ss15#ls140
sg5#lg280
sg5#ls280
ss5#lg280
ss5#ls280
sg15#lg280
sg15#ls280
ss15#lg280
ss15#ls280
Figure 4: Results of Safe Systems, where, the red line is the
Findex
5
, the blue is the system alert accuracy, green is the
accuracy for risk detection (lowest and highest alarm), yel-
low is the accuracy for alarm off, brown is the accuracy for
lowest alarm, and purple is the accuracy for highest alarm.
The classi f ierST determines Findex
5
(it is just for
“no risk” situations) because ST system is responsi-
ble for indicating a “risk” or “no risk” situation and
LT system indicates the level of alarm. The high-
est Findex
5
were 0.97 the systems with sg15, which
in sg15#ls140 reached 76.08% of alarm accuracy, on
the other hand, ss15#ls140 reached the highest alarm
accuracy of 89.15% but with 0.92 of Findex
5
. For
sg15#ls140 just 0.81% was wrong prediction of risk
for normal situation, otherwise, for ss15#ls140 was
predicted 6.83% of normal situation as a risk.
Using sg5#ls140 reached 0.96 of Findex
5
with
79.65% of alarm accuracy and 1.8% of wrong predic-
tions for normal situations in NDBD. With nbST = 5,
the buffer of sg5#ls140 uses 2.5 s of data to de-
tect risk, otherwise, sg15#ls140 uses 7.5 s. The
sg5#ls140 has a higher accuracy of the lowest alarm
(re-education) than sg15#ls140.
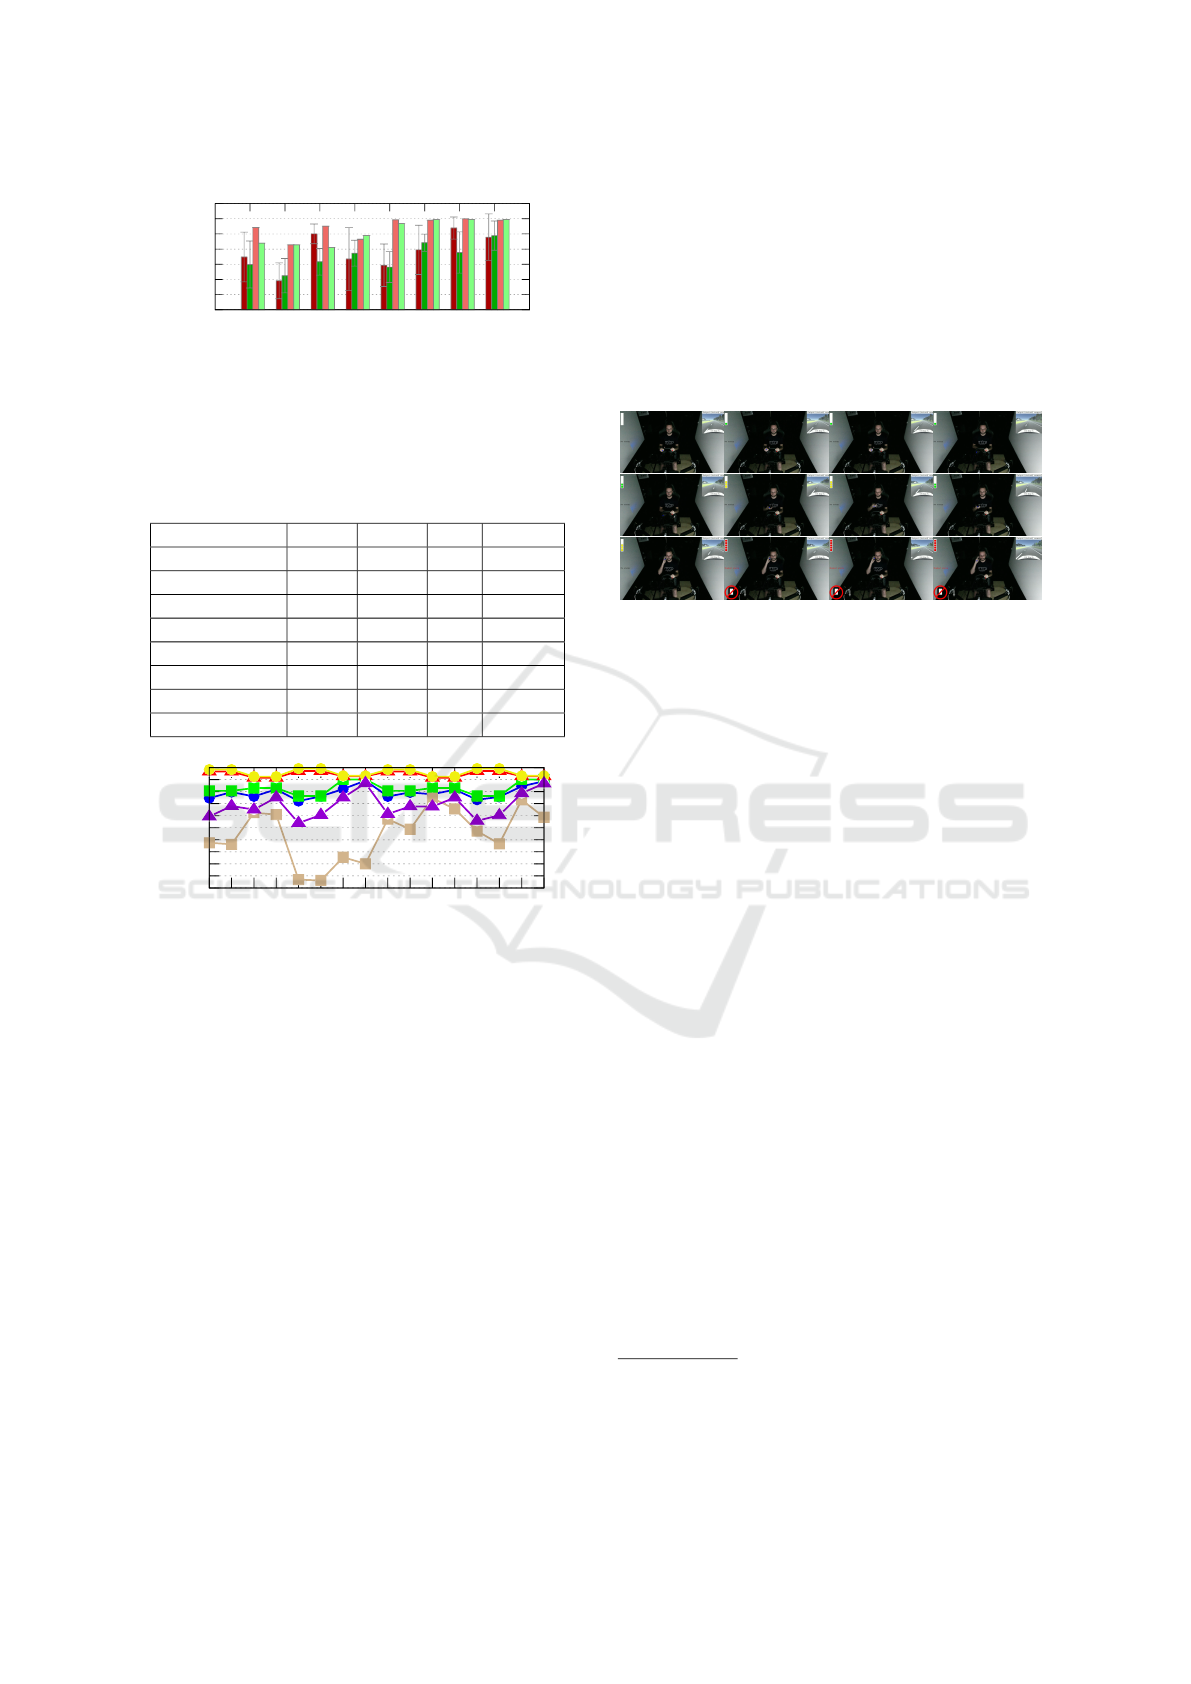
Then, the sg5#ls140 was the more advantageous
system obtained in the experiments because uses low-
est time to detect risk with similar Findex
5
and alert
accuracy than sg15#ls140. All data from NDBD
4
was processed by sg5#ls140 and Figure 5 shows some
samples of output frames.
Figure 5: The sample sequence of output of the sg5#ls140,
where the buffer of the lasts 5 predictions for risk is shown
at the top left, and the indication of the output alarm is on
center left (black text indicates no alarm, yellow is lowest
alarm, red is highest alarm).
We had some kind of prediction problems
5
, sim-
ilar at previous works of Berri and Os
´
orio of Driver
Monitoring (Berri and Os
´
orio, 2018a) and of Driv-
ing Qualification System (Berri and Os
´
orio, 2018b).
From driver monitoring, we have a non-critical prob-
lem (false positive) of prediction, this work detects
risk when a hand/arm of the driver is on face/head
for some time, then this approach can detect other
kinds of distractions than a cell phone being used
(near to the head) and drunkenness. But we have
other more severe problems as the system allows the
drivers to keep the hand near from the gearbox and in
a middle distance between the head and the steering
wheel, skeleton detection problems (wrong detection
of driver’s parts positions), and when the hands are
occluded. From driving behavior monitoring, we have
false positive problems when the driver drives the ve-
hicle during a long-time between two lanes and when
the driver can have problems staying in the center of
the lane in a great winding stretch of the road. As
problems, this approach can incorrectly predict when
a drunk driver is driving in a straight line, and do-
ing small zigzags at high speeds (which is less notice-
able).
4
All results videos of NDBD processing is available on
the link http://tiny.cc/60l8tz.
5
All problem of NDBD processing is available on the
link http://tiny.cc/2ek8tz.
ADAS Classifier for Driver Monitoring and Driving Qualification using Both Internal and External Vehicle Data
565

5 CONCLUSION
Detecting driver distractions is an essential task that
permits the vehicles to react in this situation, thus, it
can reduce the number of accidents caused by human
errors. Autonomous vehicles can need human help
for driving in some places. Then, the proposed Safety
System can grant a vehicle to identify improper driv-
ing, especially by cell phone usage and drunkenness
using data from driver monitoring (internal) and driv-
ing qualification (external). When improper driving is
detected, the system can notify the driver by an alarm
(lowest alarm) to return to a good pose or driving (re-
education), after some time of risk, the autonomous
parking system (Bruno et al., 2018) is enabled to step
in and act (highest alarm), then it will park the vehicle
in a safe position.
The Safety System validation uses the distraction
of cell phone handheld usage and drunk driver data.
The drunk data is from drivers that were using visual
impairment goggles (simulate drunkenness), so they
are just a bit disoriented in terms of visual percep-
tion, not really from the cognitive point of view. The
system sg5#ls140 achieved 79.65% of accuracy alarm
levels and only 1.8% of normal situations have wrong
predictions, contributing to the driver’s comfort when
he/she is using the system.
This novel safety system avoids some restrictions
of the related works (Section 2) as restrain passengers
besides the driver (Veeraraghavan et al., 2007), for ex-
ample, due to a wrong side camera for driver mon-
itoring. In some solutions (Minist
´
erio das Cidades,
2012), (Park et al., 2018), (Deshmukh and Dehzangi,
2017), (Haile, 1992), (Johnson and Trivedi, 2011),
and (Bergasa et al., 2014), they need of driver par-
ticipation in the system, for example, put electrodes
on his/her body or start a software in his/her cell
phone. Other works (Veeraraghavan et al., 2007),
(Berri et al., 2016), (Craye and Karray, 2015), (Se-
shadri et al., 2015), (Lenskiy and Lee, 2012), (Ku-
mar et al., 2012), (Berri et al., 2013), and (Lee et al.,
2006), needs illumination because it uses passive sen-
sors. In two works (Artan et al., 2014) and (Se-
shadri et al., 2015), the driver re-education is un-
available because they don’t use in-car cameras. The
driver may not be tested in some works (Carroll et al.,
2013), (Minist
´
erio das Cidades, 2012), and (Desh-
mukh and Dehzangi, 2017), where, some passengers
can be evaluated by the safety systems. The proposed
system uses a non-customized model for each driver
(instead of (Shirazi and Rad, 2014)) for detecting risk,
thus, the system can be more generalist, then, it can
work with any driver after a training step.
6 FUTURE WORK
We also intend to apply this system in practical sit-
uations and intelligent/autonomous vehicles. We are
working in adapting it to our own vehicles, developed
in the LRM Lab., an autonomous truck, and also in
CARINA 2 Project.
ACKNOWLEDGEMENTS
We thank CAPES/DS, projeto Rota2030-SegurAuto,
FAPESP (2013/25034-5), the volunteers who pro-
vided their time for creating the NDBD, Tiago Santos,
Ana Paula Larocca, and STI/EESC/USP.
REFERENCES
Amditis, A., Bimpas, M., Thomaidis, G., Tsogas, M., Netto,
M., Mammar, S., Beutner, A., M
¨
ohler, N., Wirthgen,
T., Zipser, S., Etemad, A., Da Lio, M., and Cicilloni,
R. (2010). A situation-adaptive lane-keeping support
system: Overview of the safelane approach. Intelli-
gent Transportation Systems, IEEE Transactions on,
11(3):617–629.
Artan, Y., Bulan, O., Loce, R. P., and Paul, P. (2014). Driver
cell phone usage detection from hov/hot nir images. In
Computer Vision and Pattern Recognition Workshops
(CVPRW), 2014 IEEE Conference on, pages 225–230.
Badger, E. (2015). 5 confounding questions that hold the
key to the future of driverless cars.
Bergasa, L. M., Almeria, D., Almazan, J., Yebes, J. J., and
Arroyo, R. (2014). Drivesafe: An app for alerting inat-
tentive drivers and scoring driving behaviors. In Intel-
ligent Vehicles Symposium Proceedings, 2014 IEEE,
pages 240–245.
Berri, R. and Os
´
orio, F. (2018a). A 3d vision system for
detecting use of mobile phones while driving. In 2018
International Joint Conference on Neural Networks
(IJCNN), pages 1–8.
Berri, R. and Os
´
orio, F. (2018b). A nonintrusive system for
detecting drunk drivers in modern vehicles. In 2018
Brazilian Conference on IS, pages 1–6.
Berri, R., Os
´
orio, F., Parpinelli, R., and Silva, A. (2016).
A hybrid vision system for detecting use of mobile
phones while driving. In 2016 International Joint
Conference on Neural Networks, pages 4601–4610.
Berri, R. A., Silva, A. G., Arthur, R., and Girardi, E.
(2013). Detecc¸
˜
ao autom
´
atica de sonol
ˆ
encia em con-
dutores de veıculos utilizando imagens amplas e de
baixa resoluc¸
˜
ao. Computer on the Beach, pages 21–
30.
Bruno, D. R., Santos, T. C., Silva, J. A. R., Wolf, D. F.,
and Os
´
orio, F. S. (2018). Advanced driver assistance
system based on automated routines for the benefit of
human faults correction in robotics vehicles. In 2018
VISAPP 2022 - 17th International Conference on Computer Vision Theory and Applications
566

Latin American Robotic Symposium, 2018 Brazilian
Symposium on Robotics (SBR) and 2018 Workshop on
Robotics in Education (WRE), pages 112–117.
Buckeridge, R. (2015). With autonomous, self-driving cars
likely to be commonplace by around 2025, these ve-
hicles will change our roads, our relationship with our
cars and society at large. buckle up, a revolution is
coming!
Carroll, J., Bellehumeur, D., and Carroll, C. (2013). System
and method for detecting and measuring ethyl alcohol
in the blood of a motorized vehicle driver transder-
mally and non-invasively in the presence of interfer-
ents. US Patent App. 2013/0027209.
CDC, U. (2015). Mobile vehicle safety-impaired driving.
Cortes, C. and Vapnik, V. (1995). Support-vector networks.
Machine learning, 20(3):273–297.
Craye, C. and Karray, F. (2015). Driver distraction detec-
tion and recognition using rgb-d sensor. arXiv preprint
arXiv:1502.00250.
De Boni, R., Pechansky, F., Silva, P. L. d. N., de Vasconcel-
los, M. T. L., and Bastos, F. I. (2012). Is the Preva-
lence of Driving After Drinking Higher in Entertain-
ment Areas? Alcohol and Alcoholism, 48(3):356–362.
Deshmukh, S. V. and Dehzangi, O. (2017). Ecg-based
driver distraction identification using wavelet packet
transform and discriminative kernel-based features. In
2017 IEEE International Conference on Smart Com-
puting (SMARTCOMP), pages 1–7.
Fernandes, L. C., Souza, J. R., Pessin, G., Shinzato, P. Y.,
Sales, D., Mendes, C., Prado, M., Klaser, R., Mag-
alh
˜
aes, A. C., Hata, A., Pigatto, D., Branco, K. C.,
Grassi Jr., V., Osorio, F. S., and Wolf, D. F. (2014).
Carina intelligent robotic car: Architectural design
and applications. Journal of Systems Architecture,
60(4):372–392.
Gehrig, S. K. and Stein, F. J. (1999). Dead reckoning and
cartography using stereo vision for an autonomous
car. In International Conference on Intelligent Robots
and Systems. IEEE.
Goldberg, D. E. (1989). Genetic Algorithms in Search, Op-
timization, and Machine Learning. Addison-Wesley
Professional.
Haile, E. (1992). Drunk driver detection system. US Patent
5,096,329.
Jain, A. K., Mao, J., and Mohiuddin, K. M. (1996). Ar-
tificial neural networks: A tutorial. IEEE computer,
29(3):31–44.
Johnson, D. A. and Trivedi, M. M. (2011). Driving style
recognition using a smartphone as a sensor platform.
In Intelligent Transportation Systems, 2011 14th In-
ternational IEEE Conference on, pages 1609–1615.
Kohavi, R. (1995). A study of cross-validation and boot-
strap for accuracy estimation and model selection.
In Ijcai, volume 14, pages 1137–1145. Montreal,
Canada.
Kumar, K., Alkoffash, M., Dange, S., Idarrou, A., Sridevi,
N., Sheeba, J., Shah, N., Sharma, S., Elyasi, G., and
Saremi, H. (2012). Morphology based facial feature
extraction and facial expression recognition for driver
vigilance. International Journal of Computer Appli-
cations, 51(2):17–24.
Lee, J., Li, J., Liu, L., and Chen, C. (2006). A novel driving
pattern recognition and status monitoring system. In
Chang, L. and Lie, W., editors, Advances in Image
and Video Technology, volume 4319 of Lecture Notes
in CS, pages 504–512. Springer Berlin Heidelberg.
Lenskiy, A. and Lee, J. (2012). Driver’s eye blinking detec-
tion using novel color and texture segmentation algo-
rithms. International Journal of Control, Automation
and Systems, 10(2):317–327.
Minist
´
erio das Cidades, B. (2012). Aplicativo m
˜
aos no
volante.
Park, H., Ahn, D., Park, T., and Shin, K. G. (2018). Auto-
matic identification of driver’s smartphone exploiting
common vehicle-riding actions. IEEE Transactions
on Mobile Computing, 17(2):265–278.
Riedmiller, M. and Braun, H. (1992). Rprop-a fast adaptive
learning algorithm. In Proc. of ISCIS VII, Universitat.
Citeseer.
Seshadri, K., Juefei-Xu, F., Pal, D. K., Savvides, M., and
Thor, C. P. (2015). Driver cell phone usage detection
on strategic highway research program (shrp2) face
view videos.
Shirazi, M. M. and Rad, A. B. (2014). Detection of in-
toxicated drivers using online system identification of
steering behavior. IEEE Transactions on Intelligent
Transportation Systems, 15(4):1738–1747.
Shotton, J., Sharp, T., Kipman, A., Fitzgibbon, A., Finoc-
chio, M., Blake, A., Cook, M., and Moore, R. (2013).
Real-time human pose recognition in parts from single
depth images. Commun. ACM, 56(1):116–124.
Strayer, D. L., Cooper, J. M., Turrill, J., Coleman, J.,
Medeiros-Ward, N., and Biondi, F. (2013). Measuring
cognitive distraction in the automobile. AAA Founda-
tion for Traffic Safety - June 2013, pages 1–34.
Strayer, D. L., Drews, F. A., and Johnston, W. A. (2003).
Cell phone-induced failures of visual attention during
simulated driving. Journal of experimental psychol-
ogy: Applied, 9(1):23.
Strayer, D. L., Watson, J. M., and Drews, F. A. (2011).
2 cognitive distraction while multitasking in the au-
tomobile. Psychology of Learning and Motivation-
Advances in Research and Theory, 54:29.
Veeraraghavan, H., Bird, N., Atev, S., and Papanikolopou-
los, N. (2007). Classifiers for driver activity monitor-
ing. Transportation Research Part C: Emerging Tech-
nologies, 15(1):51–67.
WHO, W.-H.-O. (2018). Global status report on road safety
2018. World Health Organization.
ADAS Classifier for Driver Monitoring and Driving Qualification using Both Internal and External Vehicle Data
567
