
A Prognostic Machine Learning Framework and Algorithm for
Predicting Long-term Behavioural Outcomes in Cancer Survivors
Anneliese Markus
1
, Amos Roche
2
, Chun-Kit Ngan
2
, Yin-Ting Cheung
3
and Kristi Prifti
2
1
Department of Statistics and Data Science, Cornell University, 129 Garden Ave., Ithaca, NY, U.S.A.
2
Data Science Program, Worcester Polytechnic Institute, 100 Institute Rd., Worcester, MA, U.S.A.
3
School of Pharmacy, Faculty of Medicine, The Chinese University of Hong Kong, Shatin, NT, Hong Kong SAR
Keywords: Machine Learning, Data-driven, Clinical Domain-guided Pipeline, Cancer Survivors, Behavioural Outcome
Predictions, Ensemble-based Feature Selection, Stacknet Regressor Architecture Algorithm.
Abstract: We propose a prognostic machine learning (ML) framework to support the behavioural outcome prediction
for cancer survivors. Specifically, our contributions are four-fold: (1) devise a data-driven, clinical domain-
guided pipeline to select the best set of predictors among cancer treatments, chronic health conditions, and
socio-environmental factors to perform behavioural outcome predictions; (2) use the state-of-the-art two-tier
ensemble-based technique to select the best set of predictors for the downstream ML regressor constructions;
(3) develop a StackNet Regressor Architecture (SRA) algorithm, i.e., an intelligent meta-modeling algorithm,
to dynamically and automatically build an optimized multilayer ensemble-based RA from a given set of ML
regressors to predict long-term behavioural outcomes; and (4) conduct a preliminarily experimental case study
on our existing study data (i.e., 207 cancer survivors who suffered from either Osteogenic Sarcoma, Soft
Tissue Sarcomas, or Acute Lymphoblastic Leukemia before the age of 18) collected by our investigators in a
public hospital in Hong Kong. In this pilot study, we demonstrate that our approach outperforms the traditional
statistical and computation methods, including Linear and non-Linear ML regressors.
1 INTRODUCTION
The number of cancer survivors is increasing
globally. The American Cancer Society recently
reported that in 2021, 1,898,160 new cancer cases
were projected to occur in the United States (Siegel et
al., 2021). Treatment advances have resulted in a
dramatic improvement in the survival rates of most
cancers, especially in developed countries/regions.
However, this growing population of cancer survivors
may develop a myriad of treatment-related adverse
effects that lead to a compromised health status.
Studies (Brinkman et al., 2013; Friend et al., 2018)
have also shown that cancer survivors are more likely
than the general population to experience negative
long-term behavioural outcomes, such as anxiety,
depression, attention problems, and sluggish
cognitive tempo, after cancer treatments. Thus,
developing an effective approach to identify crucial
factors and then detect these negative outcomes in
advance is needed so that medical therapists can
intervene early and take the appropriate actions and
treatments promptly to mitigate adverse effects on
cancer survivors.
Currently, to support the identification of relevant
factors and the early detection of those behavioural
outcomes for cancer survivors, clinical scientists
(Patel et al., 2013; Alias et al., 2020; Peng et al., 2021)
utilize various statistical analysis to understand the
relationship among those behavioural outcomes,
cancer treatments, chronic health conditions, and
socio-environmental factors. Specifically, the
traditional statistical methods (linear regression
analysis mainly) are used to extract those predictor
variables and then model the relationship between the
extracted predictor variables and the behavioural
outcomes. This analysis is based on the assumption
that the behavioural outcomes are for the most part
linearly correlated with those predictor variables.
However, this assumption may not always hold in this
complex and dynamic problem. Furthermore, the
predictors for those behavioural outcomes extracted
by statistical methods may have weak prediction
accuracy, as modeling human behavioural outcomes
is challenging due to its multifactorial nature (many
Markus, A., Roche, A., Ngan, C., Cheung, Y. and Prifti, K.
A Prognostic Machine Learning Framework and Algorithm for Predicting Long-term Behavioural Outcomes in Cancer Survivors.
DOI: 10.5220/0010893700003123
In Proceedings of the 15th International Joint Conference on Biomedical Engineering Systems and Technologies (BIOSTEC 2022) - Volume 5: HEALTHINF, pages 671-679
ISBN: 978-989-758-552-4; ISSN: 2184-4305
Copyright
c
2022 by SCITEPRESS – Science and Technology Publications, Lda. All rights reserved
671

predictors, as well as interactions among the
predictors affecting the outcome), heterogeneity
(differences across individuals), non-linearity of data,
multicollinearity (highly correlated variables), class
imbalance (few observations of the outcome of
interest) and missing data (Kliegr et al., 2020;
Turgeon et al., 2020). As a result, this class of linear
regressors can only account for a small proportion of
variance, with limited usability in a clinical setting.
Thus, developing an effective computational
methodology that can maximize the use of those data
for the purpose of prognostic and predictive
behavioural outcomes is highly desirable.
To address the above problems, we propose a
prognostic machine learning (ML) framework to
support the behavioural outcome prediction for
cancer survivors. Specifically, our contributions are
four-fold: (1) devise a data-driven, clinical domain-
guided pipeline to select the best set of predictors
among cancer treatments, chronic health conditions,
and socio-environmental factors to perform
behavioural outcome predictions; (2) use the state-of-
the-art two-tier ensemble-based technique to select
the best set of predictors for the downstream ML
regressor constructions; (3) develop a StackNet
Regressor Architecture (SRA) algorithm, i.e., an
intelligent meta-modeling algorithm, to dynamically
and automatically build an optimized multilayer
ensemble-based RA from a given set of ML
regressors to predict long-term behavioural
outcomes; and (4) conduct a preliminarily
experimental case study on our existing study data
(i.e., 207 cancer survivors who suffered from either
Osteogenic Sarcoma, Soft Tissue Sarcomas, or Acute
Lymphoblastic Leukemia before the age of 18)
collected by our investigators in a public hospital in
Hong Kong (HK). In this pilot study, we demonstrate
that our approach outperforms the traditional
statistical and computation methods, including Linear
and non-Linear ML regressors. Note that the
optimized SRA is the best SRA that can be built based
upon the given inputs to the algorithm.
The rest of the paper is organized as follows. In
Section 2, we briefly describe our prognostic ML
framework. We then explain our two-tier ensemble-
based technique to select the best set of predictors in
Section 3. In Section 4, we illustrate our developed
SRA algorithm with an example to show how an
optimized SRA is constructed for each outcome.
After that, we conduct an experimental analysis in our
case study, illustrate the results, and draw the
conclusions in Section 5. In Section 6, we summarize
and briefly outline our future work.
2 PROGNOSTIC ML
FRAMEWORK
In this section, we describe and explain our
prognostic ML framework that consists of five main
modules shown in Figure 1. First, medical records
from cancer survivors, including clinical data,
treatment protocols, biomarkers, chronic conditions,
and socioeconomic factors, are passed into the Data
Cleaner that "sanitizes" the records with the clinical
domain knowledge from our investigators. In this
case study, for example, it consists of replacing
missing values in a patient’s record by averaging the
existing values of the corresponding feature among
all the other patients’ records grouped by a specific
cancer type, age range, and biological sex. After the
records are cleaned, they are passed into the Feature
Transformer which transforms the categorical
variables into the numeric binary variables using the
one-hot encoding technique (Usman et al., 2015). For
instance, instead of using Male or Female categorical
value to indicate the biological sex, we use "1" and
"0" to indicate if a survivor is male and female,
respectively. The cleaned and transformed features of
our records are then normalized by the Feature
Normalizer using the min-max normalization
technique (Patro et al., 2015) to eliminate feature bias.
That is, a feature with a much higher magnitude
weighs in a lot more in the distance calculations than
a feature with a much lower magnitude. To suppress
this effect, we convert all the features to the same
range between "0" and "1" inclusively so that no
variable is dominated by the others. After the features
are normalized, they are fed into the Feature Selector.
Due to the diverse properties of medical datasets in
nature, we employ the state-of-the-art two-tier
ensemble-based technique (Chen et al., 2020). First,
features in a certain feature selection approach (i.e.,
Wrapper, Filter, and Embedded) are intersected
among multiple ML regressors by using the two-
thirds majority rule. That is, a feature is included in
the intersection of a feature selection approach if at
least two-thirds of the regressors in that approach pick
that feature. Then, the final set of features is selected
by intersecting the intersection sets from each
approach and applying the same two-thirds majority
rule. In addition, we also incorporate the clinical
domain knowledge from our investigators, who are
the medical experts in this field, by including
clinically relevant features (i.e., current age, age at
diagnosis, and types of cancer therapy) in the final
feature selection. Finally, the data corresponding to
the selected features is passed into our StackNet
Optimizer which utilizes our developed SRA
HEALTHINF 2022 - 15th International Conference on Health Informatics
672
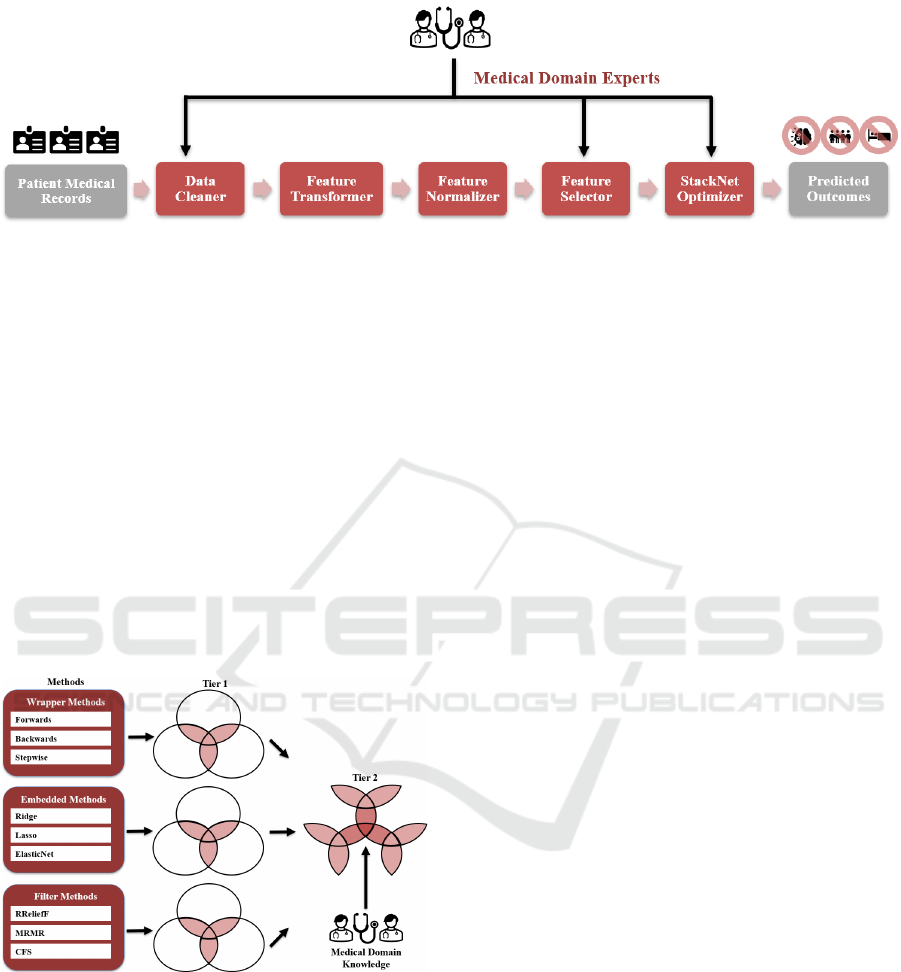
Figure 1: Prognostic ML Framework.
algorithm to dynamically and automatically construct
an optimized SRA from a set of given ML regressors
to predict long-term behavioural outcomes, measured
in T-score, in cancer survivors. Due to the distinct
nature of each behavioural outcome and its selected
features on the dataset, every SRA varies and delivers
more accurate prediction results (i.e., the lowest
prediction errors) in behavioural outcomes that are
targeted based upon the clinical domain knowledge
from our investigators. The Feature Selector and the
StackNet Optimizer are explained in greater detail in
Section 3 and 4.
3 TWO-TIER ENSEMBLE-BASED
FEATURE SELECTOR
Figure 2: Two-Tier Ensemble-Based Feature Selector.
Figure 2 is our two-tier ensemble-based feature
selector that consists of three main feature selection
methods, including Wrapper, Embedded, and Filter.
Each method contains its own three different ML
algorithms to select a set of features. The wrapper
methods incorporate a greedy search algorithm, i.e.,
stepwise regression, in which features are
sequentially added and/or removed from a pre-
selected ML regressor, based on its performant
quality, until the algorithm finds the best subset of the
features that result in constructing the best performant
regressor. In this approach, we employ three common
types of selection algorithms: (1) forward selection
that starts with no feature and then adds one at a time
iteratively until the mean squared error (MSE) of the
regressor stops improving, (2) backward selection
that starts with all the existing features and then
removes one feature at a time iteratively until the
regressor MSE is no longer decreasing, and (3)
bidirectional selection that performs both forward and
backward selection alternately to get the best subset
of the features that delivers the lowest regressor MSE.
To implement these three algorithms in our Feature
Selector, we employ a conventional three-layer
artificial neural network that has been widely used in
solving feature selection problems for many domains
and organizations (Joseph Manoj et al., 2019).
Unlike the wrapper methods that select the
features based on the regressor performance after it is
built, the embedded methods perform the feature
selection during the construction of a ML regressor.
In other words, they perform the feature selection
during the regressor training. Lasso, Ridge, and
Elastic-Net regressors are the three embedded
algorithms used in our Feature Selector that are
briefly explained in the following. The Lasso
regressor (Ranstam et al., 2018) is a Linear regressor
with the L1 regularization technique to add a penalty
(λ), i.e., the regularization parameter, to the absolute
value of the coefficient magnitude (|𝛽
|) of each input
feature 𝑥
, where 0 ≤ λ ≤ ∞, 0 ≤ j ≤ p, and p ∈ Z
+
. The
Lasso cost function 𝐽
(
𝜷
)
is defined by
𝑎𝑟𝑔𝑚𝑖𝑛
𝜷
(
∑
(𝑦
−𝑦
)
)=𝑎𝑟𝑔𝑚𝑖𝑛
𝜷
(
∑
(𝑦
−
∑
𝛽
𝑥
)
+𝜆
∑
|𝛽
|
) , where 𝜷=
[𝛽
,𝛽
,…,𝛽
], 𝑦
is the actual output, 𝑦
=
∑
𝛽
𝑥
is the predicted output, 1 ≤ i ≤ N, and N ∈ Z
++
. By
computing the gradient descent of 𝐽
(
𝜷
)
, if we keep
the value λ very small, e.g., λ = 0, 𝐽
(
𝜷
)
behaves
similar to MSE that the gradient descent will search
for the best set of 𝜷 such that MSE is the minimal. In
this case, no feature is removed. However, if we
A Prognostic Machine Learning Framework and Algorithm for Predicting Long-term Behavioural Outcomes in Cancer Survivors
673

increase λ to a very large number, in order to
minimize 𝐽
(
𝜷
)
, the gradient descent will try to make
some values of 𝜷 towards 0 to reduce the cost that
results in keeping some important features and
eliminating the others. Similar to the Lasso regressor,
the Ridge regressor (Hoerl, 2020) still uses a Linear
regressor but with the L2 regularization technique to
add the λ penalty to the square of 𝛽
, i.e.,
𝑎𝑟𝑔𝑚𝑖𝑛
𝜷
(
∑
(𝑦
−
∑
𝛽
𝑥
)
+𝜆
∑
𝛽
)
.
Instead of making some values of 𝜷 to absolute zero,
as compared to Lasso, Ridge never sets the values of
𝜷 to zero and only minimizes them by keeping and
removing the features respectively to obtain the
minimal cost. By taking advantage of both Lasso and
Ridge regression, the Elastic Net (Alhamzawi et al.,
2018) is an extension that is defined by
𝑎𝑟𝑔𝑚𝑖𝑛
𝜷
(
∑
(𝑦
−
∑
𝛽
𝑥
)
+𝜆
∑
|𝛽
|
+
𝜆
∑
𝛽
) to combine both L1 and L2
regularizations by searching the best penalty
combinations of 𝜆
and 𝜆
to minimize the cost and
find the best set of features.
Finally, the filter methods rank and select the
features based on the statistical measures with their
corresponding outcomes. Dissimilar to the Wrapper
and Embedded methods, this process is totally
independent of any ML regressor algorithms to select
the features. The three filter algorithms (Cherrington
et al., 2019) used in the Feature Selector include the
Relief for Regression (RReliefF), Maximum
Relevance — Minimum Redundancy (MRMR), and
Correlation-based (CFS). The RReliefF algorithm is
a family member of the Relief algorithms to select the
features for regression problems. The main objective
is to estimate the quality of features according to how
well their values distinguish between instances that
are near to each other. The MRMR algorithm selects
the K best features, at each iteration, which have
maximum relevance with respect to the target
variable and minimum redundancy with respect to the
features that have been selected at previous iterations.
The CFS algorithm is a heuristic technique to
evaluate the feature subset that can be either discrete
or continuous. If the feature is discrete, symmetric
uncertainty can be used. If the feature is continuous,
Pearson’s correlation can be applied.
Once these three feature sets are obtained from
their respective algorithms in their own feature
selection methods, they are intersected among them
by applying the same decision rule, i.e., at least two-
thirds of the algorithms picking that feature, to deliver
an intermediate feature set that is consented by these
three methods in Tier 1. Once these three intermediate
feature sets are generated by the Wrapper, Embedded,
and Filter methods, respectively, they are passed into
Tier 2 to select the final best subset of features that
are intersected by applying the same two-thirds
majority rule among all these three approaches. In
addition, we also incorporate the clinical domain
knowledge from our investigators, who are the
medical experts in this field, by including the
clinically relevant features (i.e., current age, age at
diagnosis, and types of cancer therapy) in the final set.
At the end, this final set, including the ML- and
domain-expert-selected features, is passed into the
downstream StackNet regressor building that is
described and explained in Section 4.
4 SRA ALGORITHM
Presently, a typical StackNet regressor (Scikit-Learn,
2021) is a two-layer ensemble-based architecture that
combines multiple ML regressors at the 1
st
layer as
the base with a regressor at the 2
nd
layer as the meta-
learner to perform predictions, where each base ML
regressor is constructed on the complete training
dataset and then the meta-regressor is fitted based
upon the outputs, i.e., the meta-feature of each base
ML regressor, as well as the input predictors of the
complete training set. This SRA has been widely used
to solve many problems in different domains and
organizations (Kao et al., 2019; Saikia et al., 2019;
Chen et al., 2021). However, this manually-
constructed architecture is always static and lacks the
dynamic and automatic properties to build an
architecture without considering each regressor
performance on the actual dataset. Specifically, the
main problems of this static architecture building
include: (1) the number of layers is fixed; (2) the 2
nd
layer always has one meta-regressor; (3) the position
arrangement of the regressors between the two layers
is pre-determined based upon users’ prior experience
and the experimental results in some literature
reviews (Kao et al., 2019; Saikia et al., 2019; Chen et
al., 2021); (4) the hyperparameters of all of the
regressors have to be found before the architecture is
being built; and (5) the hyperparameter tuning of the
meta-learner in some architectures may not consider
the meta-features of those base ML regressors. To
address the above issues, we develop the SRA
algorithm that dynamically and automatically
constructs an architecture in our optimizer. The
pseudocode algorithm of the optimizer is outlined in
Table 1.
Let us consider the example shown in Figure 3 to
illustrate how our SRA algorithm of the optimizer can
construct an optimized SRA, where the optimizer
HEALTHINF 2022 - 15th International Conference on Health Informatics
674

consists of two main modules: Architecture
Generator (AG) and Weight Optimizer (WO).
Suppose there are six ML regressors 𝑴
: [KNN, RF,
GR, BR, XGB, ET] and six sets of corresponding
hyperparameters 𝑷
: [𝑷
𝟏
, 𝑷
𝟐
, …, 𝑷
𝟔
], where KNN is
the K-Nearest Neighbours, RF is the Random Forest,
XGB is the XGBoost, BR is the Bayesian Ridge, GR
is the Gaussian Process, and ET is the Extra-trees.
First, the AG module takes the D_Train on 𝑭
, 𝑴
, 𝑷
,
B_Outcome (e.g., Attention Problems), and K = 5 as
the inputs and then process them in three distinct
phases, which we label them as "Stacking", "Un-
stacking", and "Recursive".
Stacking Phase – STEPs 1 ~ 3: This phase
consists of three steps, where each ML regressor in 𝑴
is trained and stacked at Lcurrent and Lnext
respectively. In STEP 1, it first finds the best set of
hyperparameters 𝑷
for KNN, RF, GR, BR, XGB, and
ET respectively at Lcurrent = 1 by using the RS
algorithm with 5-fold CV and RMSE on D_Train on
𝑭
and B_Outcome. In STEP 2, this example assumes
that the RMSE values of BR, XGB, and ET are the
lowest. Based on the RMSE values, the top half of the
ML regressors, i.e., BR, XGB, and ET, are stacked
into Lnext = 2. In STEP 3, it finds the best set of
corresponding hyperparameters 𝑷
for BR, XGB, and
ET respectively at Lnext = 2 by using the RS
algorithm with 5-fold CV and RMSE on D_Train on
𝑭
, the meta-feature of KNN, RF, GR respectively at
Lcurrent = 1, and B_Outcome.
Table 1: SRA Algorithm.
Input:
𝑴
: [M
1
, M
2
, …, M
n
], where 𝑴
is a set of input ML regressors M
i
s, for 1 ≤ i ≤ n and n ∈𝑍
𝑭
: [F
1
, F
2
, …., F
k
], where 𝑭
is a set of input searched features F
j
s of ∀𝑀
∈𝑴
, for 1 ≤ j ≤ k and k ∈𝑍
𝑷
𝒊
: [p
i1
, p
i2
,…, p
ij
], where 𝑷
𝒊
is a set of hyperparameters p
il
of 𝑀
∈𝑴
, for 1 ≤ i ≤ n, 1 ≤ l ≤ j, and n, j ∈𝑍
𝑷
: [𝑷
𝟏
, 𝑷
𝟐
, …, 𝑷
𝒏
], where 𝑷
is a set of 𝑷
𝒊
, for 1 ≤ i ≤ n
D_Train: Training Dataset on 𝑭
B_Outcome: Behavioural Outcome
K: The number of
g
rou
p
s that a
g
iven D_Train is to be s
p
lit into for
p
erformin
g
the cross-validation
(
CV
)
Output:
StackNetOptRegArch: Optimized SRA
Initialization:
StackNetRegArch = NULL # Set the current SRA as NULL
Lcurrent = 1 # Set the current layer of StackNetRegArch
Lnext = Lcurrent + 1 # Set the next layer of StackNetRegArch
StackNetRegArch[Lcurrent] = 𝑴
# Set the initial StackNetRegArch with 𝑴
RMSE[Lcurrent][M
] = 0 # Set Root Mean Square Error (RMSE) of 𝑀
at Lcurrent of StackNetRegArch, where 1 ≤ i ≤ n
RMSE[Lnext][M
] = 0 # Set Root Mean Square Error (RMSE) of 𝑀
at Lnext of StackNetRegArch, where 1 ≤ i ≤ n
Weıght
= NULL # Set Weıght
that stores a set of weights of all predicted B_Outcome values at the highest layer of
StackNetRe
g
Arch as NULL
Processing:
Module 1: Architecture Generator
STEP 1: Find the best 𝑷
𝒊
∈𝑷
for each M
i
at Lcurrent by using the Random Search (RS) algorithm with K-fold CV and
RMSE on D_Train on 𝑭
and B_Outcome, where 𝑀
∈𝑴
.
STEP 2: Move the top half of M
i
s, i.e., ⌊
⌋, that have the lowest RMSE from Lcurrent to Lnext
STEP 3: Find the best 𝑷
𝒊
∈𝑷
for each M
i
at Lnext by using the Random Search (RS) algorithm with K-fold CV and RMSE
on D_Train on 𝑭
, the meta-feature of each M
i
at Lcurrent, and B_Outcome, where 𝑀
∈𝑴
.
STEP 4: Compare the RMSE of each M
i
at Lnext with its RMSE at Lcurrnet
if RMSEs of ∀𝑀
∈𝑴
at Lnext < their RMSEs at Lcurrent:
Go To STEP 5
else if ∃𝑀
∈𝑴
, whose RMSE at Lnext >= its RMSE at Lcurrent:
Move M
i
back to Lcurrent from Lnext
Go To STEP 5
STEP 5: Evaluate if Weight Optimizer or STEPs 1 ~ 4 should be executed recursively based on the number of regressors
at Lcurrent and Lnext
if # of regressors of StackNetRegArch at Lnext = 0
StackNetRe
g
Arch = StackNetRe
g
Arch[Lcurrent]
A Prognostic Machine Learning Framework and Algorithm for Predicting Long-term Behavioural Outcomes in Cancer Survivors
675

Table 1: SRA Algorithm (cont.).
# Evaluate if Weight Optimizer should be executed based upon the number of regressors at Lcurrent
if # of regressors of StackNetRegArch at Lcurrent > 1
𝑊𝑒𝚤𝑔ℎ𝑡
= WeightOptimizer(StackNetRegArch, D_Train, 𝑭
, B_Outcome)
StackNetOptRegArch = StackNetRegArch with 𝑊𝑒𝚤𝑔ℎ𝑡
else
StackNetOptRegArch = StackNetRegArch
else
Lcurrent = Lnext
Lnext = Lcurrent + 1
if # of regressors of StackNetRegArch at Lcurrent ≥ 3
Repeat STEP 1 ~ 4.
else if # of regressors of StackNetRegArch at Lcurrent ≥ 2
𝑊𝑒𝚤𝑔ℎ𝑡
= WeightOptimizer(StackNetRegArch, D_Train, 𝑭
, B_Outcome)
StackNetOptRegArch = StackNetRegArch with 𝑊𝑒𝚤𝑔ℎ𝑡
else
StackNetOptRegArch = StackNetRegArch
Return StackNetO
p
tRe
g
Arch
Module 2: WeightOptimizer(StackNetRegArch, D_Train, 𝑭
, B_Outcome)
STEP 1: Use D_Train on 𝑭
to generate a set of predicted B_Outcome values 𝑦
= [𝑦
,𝑦
,…,𝑦
] of StackNetRegArch,
where 𝑦
is a predicted value of B_Outcome and m is the total number of regressors at the highest layer of
StackNetRegArch, for 1 ≤ i ≤ m and m ∈𝑍
STEP 2: 𝑊
= [w
1
, w
2
, ..., w
m
], where w
i
is the weight of 𝑦
, for 1 ≤ i ≤ m, 0 ≤ w
i
≤ 1 and w
1
+ w
2
+ ... + w
m
= 1
STEP 3: Define the objective function 𝑍=((
∑
𝑤
𝑦
)−𝑩_𝑶𝒖𝒕𝒄𝒐𝒎𝒆)
# It is the sum of square errors between the
actual B_Outcome value and the weighted sum of predicted values 𝑦
s of all the regressors at the highest layer of
StackNetRegArch
STEP 4: Formulate the minimization problem:
Minimize Z
s.t. w
1
+ w
2
+ ... + w
m
= 1
0 ≤ w
i
≤ 1, where 1 ≤ i ≤ m
STEP 5: Compute 𝑊
that minimizes Z by the convex optimizer
STEP 6: Return 𝑊
Un-stacking Phase – STEP 4: This phase is to
determine if a ML regressor could still stay at Lnext
and then move on to STEP 5 or need to move back to
Lcurrent, based upon its RMSE value. For this step
explanation, we assume that there are two possible
scenarios in this example: (1) the RMSEs of BR,
XGB, and ET at Lnext are all lower than those at
Lcurrent and (2) the RMSEs of some regressors, e.g.,
ET, at Lnext, equal to or higher than those at Lcurrent.
For Scenario 1, the BR, XGB, and ET regressors all
can stay at Lnext = 2 and move on to STEP 5, as they
perform better at a higher layer indicated in the green
colour. For Scenario 2, however, the ET regressor
needs to be moved back to Lcurrent = 1 as the base
regressor, called un-stacking, as its performance is
worse at Lnext = 2 indicated in the red colour. After
that, the algorithm goes to STEP 5.
Recursive Phase – STEP 5: This phase is to
decide whether or not the WO module or STEPs 1~4
should be executed recursively. For Scenario 1, as the
number of regressors at Lnext is not zero, Lcurrent
and Lnext are incremented to 2 and 3 respectively in
the "else" statement. Due to the number of regressors
at Lcurrent at least three, STEPs 1 ~ 4 are called again
in the process that has been described above. At the
end, the ET regressor is at the 3
rd
layer due to its
RMSE, which is lower than that at the 2
nd
layer. As
there is only one regressor at the highest layer, i.e.,
Lcurrent = 3, there is no need to call the WO module.
HEALTHINF 2022 - 15th International Conference on Health Informatics
676
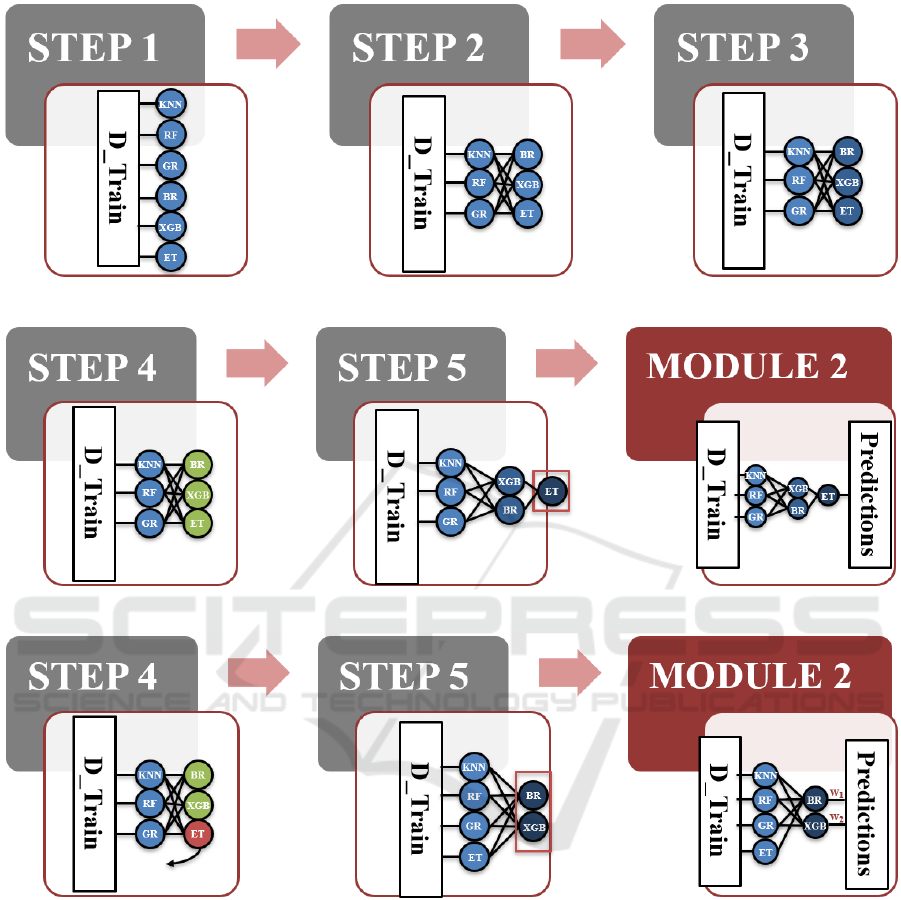
Scenario 1
Scenario 2
Figure 3: An Illustrative Example.
The final SRA is then composed of [KNN, RF, GR]
at the 1
st
layer, [BR, XGB] at the 2
nd
layer, and [ET]
at the 3
rd
layer. For Scenario 2, as the number of
regressors is more than one at Lcurrent = 2, the WO
module needs to be called to formulate the below
minimization problem using STEPs 1~4 in Module
2 and then learn the optimal weight of each output
from BR and XGB respectively in STEP 5. In STEP
6, 𝑊
= [w
1
, w
2
] is returned to STEP 5 in Module 1 to
construct the final SRA that consists of [KNN, RF,
GR, ET] at the 1
st
layer and [BR, XGB] at the 2
nd
layer
that combines the predicted outputs of BR and XGB,
i.e., (
∑
𝑤
𝑦
), to predict the behavioural outcome.
Minimize 𝑍=((
∑
𝑤
𝑦
)−𝑩_𝑶𝒖𝒕𝒄𝒐𝒎𝒆)
s.t. w
1
+ w
2
= 1
0 ≤ w
i
≤ 1, where 1 ≤ i ≤ 2
(1)
5 EXPERIMENTAL RESULT
AND DISCUSSION
The dataset for our preliminarily experimental case
study consists of 207 cancer patients' records
collected from a public hospital in HK between 2018
– 2021. All the records came from the patients who
A Prognostic Machine Learning Framework and Algorithm for Predicting Long-term Behavioural Outcomes in Cancer Survivors
677
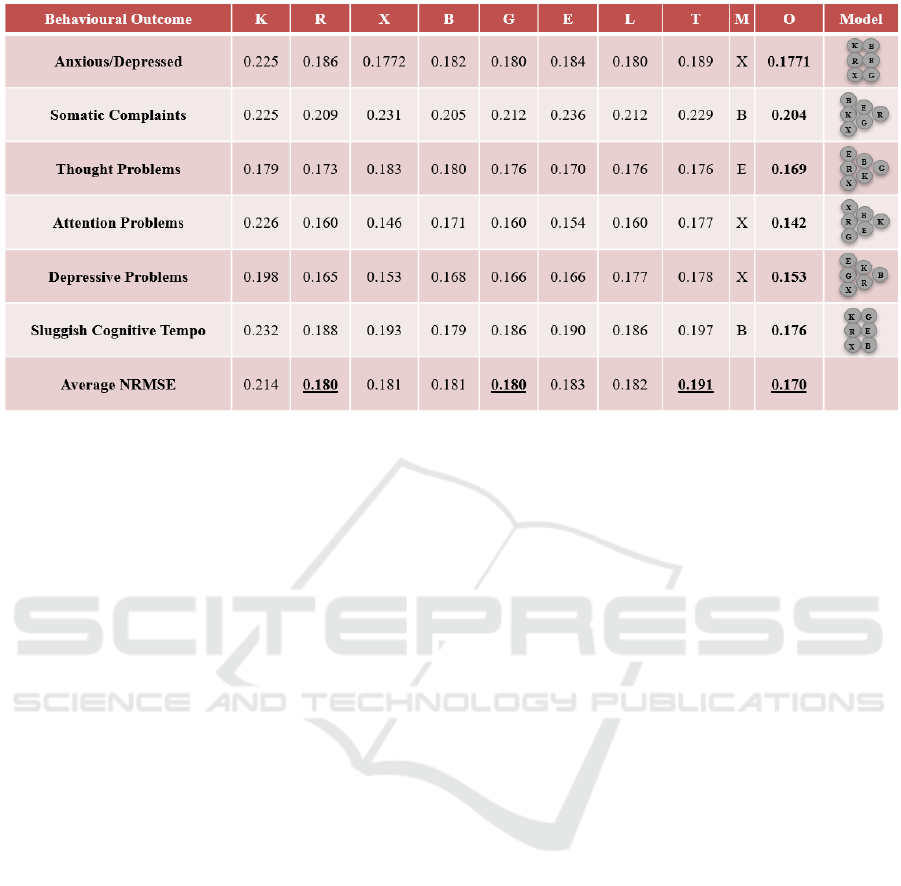
Figure 4: Experimental Results on the Study Data.
suffered either Osteogenic Sarcoma, Soft Tissue
Sarcomas, or Acute Lymphoblastic Leukemia before
the age of 18. In each record, there are more than 60
features that include biomarkers, treatments, chronic
health conditions, socio-environmental factors, and
behavioural outcomes. After processing those
features in our Feature Selector and getting the
clinical consultation from our investigators, we have
approximately 20 features per outcome, i.e.,
Anxious/Depressed, Somatic Complaints, Thought
Problems, Attention Problems, Depressive Problems,
and Sluggish Cognitive Tempo, which the clinical
experts would like to target on. In this pilot study, the
K-Nearest Neighbours (K), Random Forest (R),
XGBoost (X), Bayesian Ridge (B), Gaussian Process
(G), and Extra-trees (E) regressors with 5-CV are
employed in our Optimized StackNet (O) regressor.
Compared its normalized RMSE (NRMSE) of each
outcome with the Linear (L) regressor’s and the
Typical StackNet (T) regressor’s, the results are
summarized in Figure 4. Note that each T regressor is
constructed by using the same six ML regressors. One
of them is the meta-regressor (M) that is chosen based
on users’ prior experience and the experimental
results in some literature reviews (Kao et al., 2019;
Saikia et al., 2019; Chen et al., 2021). The rest of them
are the base ML regressors.
In Figure 4, we can see that our optimized
StackNet regressor for each outcome has the lowest
NRMSE that outperforms all the other individual
benchmarks, where each optimized StackNet
regressor has its own distinct architecture for each
outcome shown in the "Model" column. Further than
that, on the average NRMSE among all the
considered outcomes per regressor, our optimized
StackNet regressor’s is 0.170 that is 5.6% lower than
the R and G regressors’ (0.180) and almost 11%
lower than the T regressor’s (0.191), which is the
second worse performance among all the regressors.
It can be proved that without performing the StackNet
architecture optimization, the performance may even
worse than the individual regressors.
6 CONCLUSIONS AND FUTURE
WORK
In this paper, we propose a prognostic ML framework
to support the behavioural outcome prediction for
cancer survivors. Specifically, our contributions are
four-fold: (1) devise a data-driven, clinical domain-
guided pipeline to select the best set of predictors
among cancer treatments, chronic health conditions,
and socio-environmental factors to perform
behavioural outcome predictions; (2) use the state-of-
the-art two-tier ensemble-based technique to select
the best set of predictors for the downstream ML
regressor constructions; (3) develop a SRA algorithm,
i.e., an intelligent meta-modeling algorithm, to
dynamically and automatically build an optimized
multilayer ensemble-based RA from a given set of
ML regressors to predict long-term behavioural
outcomes; and (4) conduct a preliminarily
experimental case study on our existing study data
collected by our investigators in a public hospital in
HK. In this pilot study, we demonstrate that our
approach outperforms the traditional statistical and
HEALTHINF 2022 - 15th International Conference on Health Informatics
678

computation methods, including Linear and non-
Linear ML regressors. However, there is still a lack
of many important research questions, e.g., what
other feature selection approaches should be used to
select a better set of features for the outcome
prediction, how the proposed algorithm could be
enhanced to reduce the time and space complexity,
and what other available datasets should be collected
for the performance evaluations.
ACKNOWLEDGEMENTS
This research study is supported by the U.S. National
Science Foundation (ref no: 1852498) awarded to
Chun-Kit Ngan and partially supported by the Hong
Kong Research Grant Council Early Career Scheme
(ref no: 24614818) awarded to Yin-Ting Cheung. We
would also like to acknowledge Professor Chi-Kong
Li (Department of Paediatrics, Faculty of Medicine,
The Chinese University of Hong Kong) for medical
domain knowledge support and advice.
REFERENCES
Alhamzawi, R. & Ali, H.T.M. (2018). The Bayesian Elastic
Net Regression. Communications in Statistics -
Simulation and Computation, 47(4), 1168-1178. DOI:
10.1080/03610918.2017.1307399.
Alias, H., Morthy, S.K., & Zakaria, S.Z.S. et al. (2020).
Behavioral Outcome among Survivors of Childhood
Brain Tumor: A Case Control Study. BMC Pediatrics.
https://doi.org/10.1186/s12887-020-1951-3.
Brinkman, T., Zhu, L., Zeltzer, L. et al. (2013).
Longitudinal Patterns of Psychological Distress in
Adult Survivors of Childhood Cancer. British Journal
of Cancer, 109, 1373–1381. https://doi.org/10.1038/
bjc.2013.428.
Chen, C.W., Tsai, Y.H., Chang, F.R., & Lin, W.C. (2020).
Ensemble Feature Selection in Medical Datasets:
Combining Filter, Wrapper, and Embedded Feature
Selection Results. Expert Systems, 37(5).
https://doi.org/10.1111/exsy.12553.
Chen, L., Guan, Q., Chen, N., & YiHang, Z. (2021). A
StackNet Based Model for Fraud Detection. The 2021
International Conference on Education, Knowledge
and Information Management. doi: 10.1109/ICEKIM
52309.2021.00079.
Cherrington, M., Thabtah, F., Lu, J., & Xu, Q. (2019).
Feature Selection: Filter Methods Performance
Challenges. The 2019 International Conference on
Computer and Information Sciences. doi:
10.1109/ICCISci.2019.8716478.
Friend, A.J., Feltbower, R.G., Hughes, E.J., Dye, K.P.,
Glaser, A.W. (2018). Mental Health of Long-term
Survivors of Childhood and Young Adult Cancer: A
Systematic Review. International Journal of Cancer,
143(6), 1279-1286. doi: 10.1002/ijc.31337.
Hoerl, R.W. (2020) Ridge Regression: A Historical
Context. Technometrics, 62(4), 420-425. DOI:
10.1080/00401706.2020.1742207.
Joseph Manoj, R., Anto Praveena, M.D. & Vijayakumar, K.
(2019). An ACO–ANN Based Feature Selection
Algorithm for Big Data. Cluster Computing, 22, 3953–
3960. https://doi.org/10.1007/s10586-018-2550-z.
Kao, P.Y., Zhang, A., Goebel, M., Chen, J.W., &
Manjunath, B.S. (2019). Predicting Fluid Intelligence
of Children Using T1-Weighted MR Images and a
StackNet. Adolescent Brain Cognitive Development
Neurocognitive Prediction. ABCD-NP 2019. Lecture
Notes in Computer Science. https://doi.org/10.1007/
978-3-030-31901-4_2.
Kliegr, T., Bahník, Š., Fürnkranz, J. (2020). Advances in
Machine Learning for the Behavioural Sciences.
American Behavioural Scientist, 64(2), 145-175.
doi:10.1177/0002764219859639.
Patel, S. K., Lo, T. T., Dennis, J. M., Bhatia, S., & PADRES
Contra El Cáncer (2013). Neurocognitive and
behavioral outcomes in Latino childhood cancer
survivors. Pediatr Blood Cancer, 60(10), 1696–1702.
https://doi.org/10.1002/pbc.24608.
Patro, S.G., & Sahu, K.K. (2015). Normalization: A
Preprocessing Stage. ArXiv, abs/1503.06462.
Peng, L., Yang, L.S., Yam, P., Lam, C.S., Chan, A.S., Li,
C.K., & Cheung, Y.T. (2021). Neurocognitive and
Behavioral Outcomes of Chinese Survivors of
Childhood Lymphoblastic Leukemia. Frontiers in
Oncology. doi: 10.3389/fonc.2021.655669.
Ranstam, J. & Cook, J.A. (2018). LASSO Regression.
British Journal of Surgery, 105(10). https://doi.org/
10.1002/bjs.10895.
Saikia, P. & Baruah, R.D. (2019). Investigating Stacked
Ensemble Model for Oil Reservoir Characterisation.
The IEEE International Conference on Systems, Man
and Cybernetics. doi: 10.1109/SMC.2019.8914488.
Scikit-Learn. (2021). sklearn.ensemble.StackingClassifier.
https://scikit-learn.org/stable/modules/generated/
sklearn.ensemble.StackingClassifier.html.
Siegel, R.L, Miller, K.D., Fuchs, H.E., & Jemal, A. (2021).
Cancer Statistics. A Cancer Journal for Clinicians,
71(1), 7-33. https://doi.org/10.3322/caac.21654.
Turgeon, S., Lanovaz, M.J. (2020). Tutorial: Applying
Machine Learning in Behavioural Research.
Perspectives on Behaviour Science, 43, 697–723.
https://doi.org/10.1007/s40614-020-00270-y.
Usman, A.U., Hassan S. Abdulkadir, H.S., & Tukur, K.
(2015). Application of Dummy Variables in Multiple
Regression Analysis. International Journal of Recent
Scientific Research, 6(11), 7440-7442.
A Prognostic Machine Learning Framework and Algorithm for Predicting Long-term Behavioural Outcomes in Cancer Survivors
679
