
Discovery of Effective Spectrum for Classifying iPS Cells
Taken with CARS Microscope
Ryouichi Furukawa
1
, Yohei Hayashi
2
, Hideaki Kano
3
,
Junichi Matsumoto
4
, Shoichi Honda
4
and Kazuhiro Hotta
1
1
Meijo University, Nagoya-shi, Japan
2
RIKEN, Tsukuba-shi, Japan
3
Department of Chemistry, Faculty of Science, Kyushu University, Fukuoka-shi, Japan
4
KATAOKA CORPORATION, Kyoto-shi, Japan
Keywords: CARS Microscope, iPS Cells, Effective Spectrum, Automatic Discovery.
Abstract: There is a technique using the CARS (Coherent Anti-Stokes Raman Scattering) microscope to identify iPS
cells. CARS microscope can visualize the different molecular structures of iPS cells in each spectrum, so it is
possible to identify iPS cells without destroying them. However, the information on molecules in the spectrum
obtained by the CARS microscope is so diverse that it takes a great deal of time and effort to identify them.
We propose a method to automatically identify the spectrum, which is effective for iPS cell identification,
thereby reducing the time and effort required for identification using the CARS microscope. In this paper, we
propose a network that handles multi-resolution information in parallel to learn both image classification and
segmentation simultaneously. Moreover, the effective spectrum for classifying iPS cells are discovered by
using the network gradients and the F-measure for cell segmentation. By the experiments on four kinds of iPS
cells, we confirmed that the accuracy of the proposed method for classifying iPS cells achieved 99%.
Furthermore, the effective spectrum for each iPS cell could be automatically identified.
1 INTRODUCTION
iPS cells (Takahashi et al., 2006) are capable of
transforming into almost any types of cells, and
regenerative medicine research (Hideyuki et al.,
2019) using their characteristics is actively
conducted. To use iPS cells for regenerative medicine,
it is necessary to transform them into other cell types
(called “differentiation”). However, because of the
variability in the efficiency and direction of
differentiation of iPS cells into the other cells, when
iPS cells are differentiated from iPS cells, cell types
other than the intended ones or cells that have not
been fully differentiated may be mixed in.
Furthermore, when cells differentiated from iPS cells
are transplanted into an organism, it is known that
tumors can be formed if undifferentiated iPS cells are
mixed in.
There is a method using CARS (Coherent Anti-
Stokes Raman Scattering) microscope (Cheng et al.,
2004) to identify iPS cells and their differentiated
cells. CARS (Begley et al., 1974) is a phenomenon in
which two different spectra of light are irradiated on
a material, and light with a spectrum different from
both is generated. CARS microscope allows us to
visualize the molecular structure of the cell in each
spectrum. Therefore, CARS microscopy makes it
possible to identify iPS cells without destroying
(killing) cells. However, the information on
molecules in the spectrum obtained by the CARS
microscopy is so diverse that it takes a great deal of
time and effort to identify them. Therefore, it reduces
the time and effort required for identification using
the CARS microscope by automatically identifying
the spectra that are effective for iPS cell
identification. We perform automatic classification
using CNN from spectrum images obtained by the
CARS microscope. Furthermore, from the results of
the classification, we discover the effective spectrum
for classifying each iPS cell.
There is a method using Grad-CAM (Selvaraju et
al., 2017) to identify the spectrum that is effective for
identification. By using Grad-CAM, it is possible to
identify the effective spectrum as the one with a large
importance value in the feature maps (Takeshi et al.,
228
Furukawa, R., Hayashi, Y., Kano, H., Matsumoto, J., Honda, S. and Hotta, K.
Discovery of Effective Spectrum for Classifying iPS Cells Taken with CARS Microscope.
DOI: 10.5220/0010900200003123
In Proceedings of the 15th International Joint Conference on Biomedical Engineering Systems and Technologies (BIOSTEC 2022) - Volume 4: BIOSIGNALS, pages 228-235
ISBN: 978-989-758-552-4; ISSN: 2184-4305
Copyright
c
2022 by SCITEPRESS – Science and Technology Publications, Lda. All rights reserved
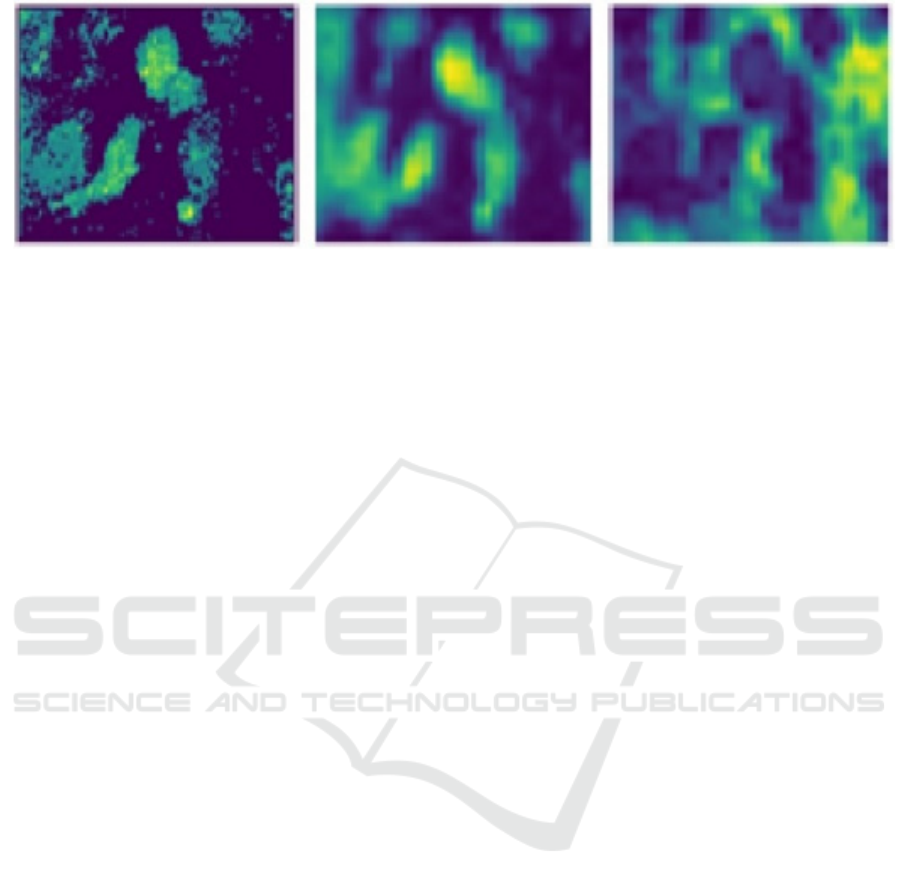
(a) (b) (c)
Figure 1: Example of visualization results for the portion of each spectrum that was identified as effective for classification.
(a) Visualization of the location of cells in the input image. (b) Example of a visualization result in which cells are captured
by the portion that is considered effective for classification. (c) Example of a visualization result in which cells are not
captured by the portion that is considered effective for identification.
2019). However, as shown in Figure 1, this method
judges an object to be effective even when the
effective spectrum for classification does not capture
the cells such as a culture medium.
We proposed the automatic detection method of
the effective spectrum shown in Figure 2 to solve the
shortcomings of the Grad-CAM based effective
spectrum identification. The multi-scale network
learns by handling feature maps with multiple
resolutions in parallel. The effective spectrum
calculation module uses the gradients like Grad-CAM
to calculate the important feature map and then
multiplies it by the F-measure for cell segmentation
obtained from the multi-scale network. By
multiplying F-measures, we can reduce the
importance of the spectrum that does not capture
cells.
In experiments, we classify four types of iPS cells
using images captured by the CARS microscope. We
also identify the effective spectrum from the
classification results. As a result, we were able to
successfully classify iPS cells with 99% accuracy and
discover class-specific effective spectrum.
This paper is organized as follows. Section 2
describes the related works. The details of the
proposed are presented in section 3. Section 4 shows
experimental results. Finally, conclusion and future
works are described in section 5.
2 RELATED WORKS
2.1 Identification of iPS Cells using
CARS Microscope
Researches on the application of iPS cells to
regenerative medicine are actively conducted. A
method for identifying high-quality iPS cells is to use
the CARS microscope (Michiel et al., 2007). CARS
microscope utilizes the phenomenon of CARS which
is the generation of light with a spectrum different
from that of either light when two lights with different
spectra are incident on a material. CARS microscope
allows us to visualize the molecular structure of iPS
cells in a non-destructive, non-invasive, non-staining,
and non-labelling manner. Thus, we can identify the
cells in their living state. However, the spectrum
obtained by the CARS microscope contains a variety
of molecular information, and it is very costly to
obtain all the molecular information. Therefore, we
reduce the cost by discovering the effective spectrum
for classifying cells. In this paper, we propose a
classification method of iPS cells using the CNN
which has a structure like the HR-net (Saad et al.,
2017), and an effective spectrum for classifying iPS
cells is discovered automatically.
2.2 Effective Spectrum Discovery using
Grad-CAM
There is a method for discovering the effective
spectrum for classification by using Grad-CAM
(Takeshi et al., 2019). This method identifies
effective spectrum by comparing the average of the
gradients of the convolutional layers computed in the
same way as Grad-CAM for each feature map.
However, in this method, the spectrum may be judged
to be effective even when the result is shown in Figure
1(c). In other words, when the gradient of a
convolutional layer is computed for the input cell
image and the gradient of non-cell pixels shows a
large value, this spectrum is erroneously judged to be
effective.
Discovery of Effective Spectrum for Classifying iPS Cells Taken with CARS Microscope
229
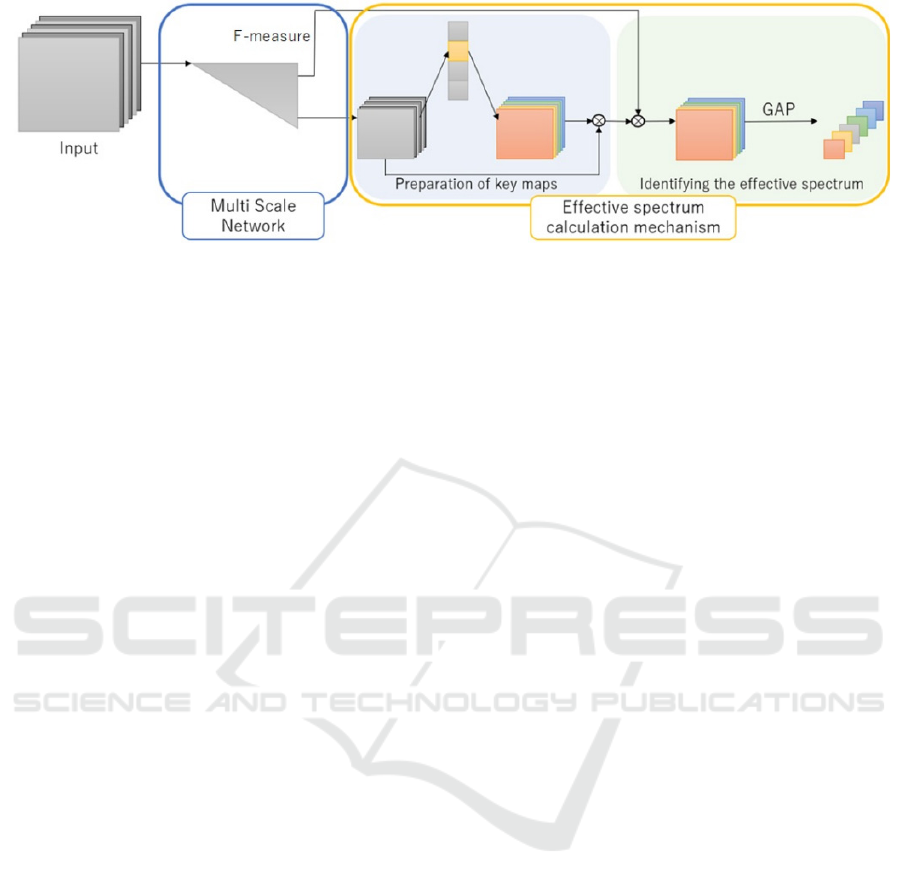
Figure 2: Overview of the proposed method. It consists of a multi-scale network and an effective spectrum calculation module,
and it identifies the effective spectrum for classifying the input cell by the magnitude of the final output value.
In this paper, we use segmentation (Long et al.,
2015) to solve this problem. Segmentation becomes
more accurate as the per-pixel accuracy improves.
Therefore, when the cell locations are recognized
more accurately, the F-measure becomes large. When
cell segmentation does not work well, the F-measure
becomes small. By multiplying the F- measure for
segmentation with the gradients of feature maps, it is
possible to suppress the importance values when the
gradients of non-cell pixels are large, and we discover
effective spectrum correctly. Therefore, by using the
result of cell segmentation, we can prevent the
example as shown in Figure 1(c).
3 PROPOSED METHOD
The proposed effective spectrum identification
network shown in Figure 2 consists of a multi-scale
network shown in Figure 3 and an effective spectrum
calculation module. Section 3.1 describes the multi-
scale network. Section 3.2 describes the effective
spectrum calculation module.
3.1 Multi-scale Network
The purpose of the multiscale network is to learn the
features while focusing on the location of cells. Multi-
scale networks have two characteristics. The first one
is the network structure used to learn by handling the
features of multiple resolutions in parallel. The
second one is the skip connection to compensate for
the information in the input spectrum.
The structure of the multiscale network is shown
in Figure 3. The reason for training multiple
resolutions in parallel (Sun et al., 2019) is to
efficiently learn the classification and segmentation at
the same time. Segmentation is the task that class
labels are assigned to each pixel in an image, and it is
possible to learn cell location information by
incorporating segmentation learning. Therefore, we
expected that the network would learn to use much
information of cells during classification because it
would understand the location of the cells better than
the case without segmentation learning. The
multiscale network used convolution with a kernel
size of 3 with stride 2 to reduce the resolution, and
bilinear interpolation to increase the resolution. In the
multiscale network, depth wise convolution was
applied to only the first layer, and normal convolution
was applied to the remaining layers. To perform
image classification, all feature maps of the input
image are aggregated into a feature map with a
reduced resolution of 1∕4. To perform segmentation,
all feature maps are aggregated into a feature map of
the same size as the input image. We also introduce
attention in the channel direction during training to
make it easier to identify the spectrum that is effective
for classification.
Multi-scale networks used convolution to extract
features. The convolution calculates the output of one
channel by multiplying all the input channels by their
weights. Since the information of all spectra is mixed,
it is impossible to identify effective spectrum from
the feature maps. To solve this problem, we used the
skip connection like ResNet (He et al., 2016), and
added the input features to the output feature maps of
the multi-scale network. By using the skip
connection, it is possible to compensate the original
spectrum for the output features and identify which
spectrum is effective. To match the size of the input
image and the output feature maps from the multi-
scale network, we used average pooling with filter
size 4 and stride 4.
3.2 Effective Spectrum Calculation
Module
The effective spectrum calculation module identifies
the effective spectrum for classification from the
BIOSIGNALS 2022 - 15th International Conference on Bio-inspired Systems and Signal Processing
230
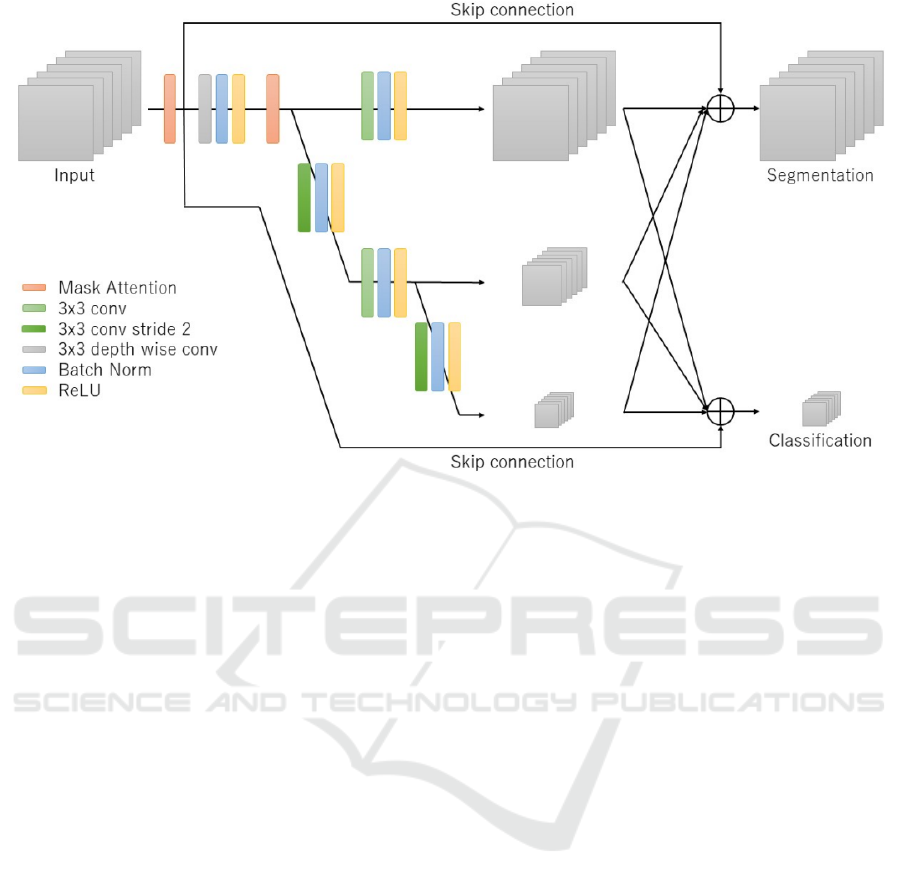
Figure 3: Overview of multi-scale networks.
feature maps in the multi-scale network. This module
can identify the effective spectrum while suppressing
the spectrum that does not capture cells as shown in
Figure 1(c). The module consists of the preparation of
keymaps and identification of the effective spectrum.
The keymaps indicate the importance of each
spectrum. The preparation of a keymap is performed
in the following three steps. First, we obtain the final
convolutional layer with the lowest resolution in the
multi-scale network. Second, we calculate the
gradient of the convolutional layer for the correct
class. Third, by multiplying the calculated gradient
value by the feature map, a keymap is created that
identifies the important areas for identification. By
multiplying the feature map by the gradient value, the
keymap has larger values for important pixels for
classification.
Identification of the effective spectrum is
performed in the following three steps. First, we
obtain the feature maps with the highest resolution in
the multi-scale network and evaluate whether the cell
locations are segmented well by using the F-measure
or not. Second, the keymaps for each spectrum are
multiplied by the F-measure for each spectrum. The
effective spectrum is identified by the magnitude of
the multiplied values. By multiplying the F-measure,
the spectrum that does not capture cells is suppressed,
and the shortcomings of the existing methods are
improved.
The creation of the segmentation labels required
to learn segmentation in section 3.1 and to obtain the
F- measure in section 3.2 is described in section 4.2.
4 EXPERIMENTS
In this section, we show the experimental results.
Section 4.1 describes the dataset and augmentation
used in this study. Section 4.2 gives the overview of
experiments. Section 4.3 presents the results of
evaluation experiments.
4.1 Dataset and Experimental Setup
The experiments were conducted using multi-
spectrum images of iPS cells captured by the CARS
microscope. The classes in the dataset consist of four
classes; ectoderm (ECT), mesoderm (MES),
endoderm (END), and undifferentiated (UND). The
total number of data for each class is 100; 25 for ECT,
25 for END, 25 for MES, and 25 for UND. These data
were originally from the same cell line and were
imaged after 1 week of incubation under different
culture conditions. The number of spectra visualized
per sample was 609, and the size of each image was
70x110 pixels. Due to the small number of images,
we use 5-hold cross-validation. We use 80 images for
training and 20 images for validation.
Data augmentation is proven to be an efficient
technique to improve the overall model performance.
In our experiments, data augmentation was used to
improve the performance of the multiscale network.
Discovery of Effective Spectrum for Classifying iPS Cells Taken with CARS Microscope
231

Table 1: The overview of experiments.
Processes
Ⅰ Create a simplified segmentation label
Ⅱ Learning Multiscale Networks
Ⅲ Back propagation of the final convolutional
layer using a trained multiscale network
Ⅳ Multiply the gradient by the convolutional layer
of the final layer
Ⅴ Calculating F-measure from high-resolution
feature maps of multiscale networks
Ⅵ Multiply the results of IV and V
Ⅶ Sum up the results for each class
In training, we performed random horizontal and
vertical flipping after random cropping of the image
to a size of 64 x 64 pixels. In validation, the image
size was changed to 72 x 112 by zero padding to make
the calculation easier.
We used the Pytorch library and trained the
network with Adam for 100 epochs. The base
learning rate (lr_base) was set to 0.01, and when there
were 50 epochs, the learning rate was set to 0.001 and
the network was trained. We use a batch size of 40
and a momentum of 0.9. The loss function is a
combination of Cross entropy loss during training for
discrimination and Dice loss during training for
segmentation.
4.2 Overview of Experiments
In this section, we describe the flow of experiments.
The overview is given in Table 1. A simplified label
for segmentation is created by summing all 609
spectra and then binarizing Otsu’s method (Otsu,
1979) because it is only necessary to distinguish cells
from the background. The network is trained in Table
1, II to create a model to identify iPS cells. All
operations below III in Table 1 are performed using
the trained model. Table 1 VII sums up the results of
the 5-fold cross-validation up to Table 1 VI. Cells that
are misclassified by the multiscale network is
excluded from the calculation.
4.3 Experimental Results
We conducted experiments on the dataset obtained by
the CARS microscope, and the classification results
of the four kinds of iPS cells are shown in Table 2.
We compared the accuracy of the network with and
without multiple resolutions. The network without
multiple resolutions is a standard CNN that classifies
the cells with only feature maps of low-resolution.
Table 2 demonstrated the effectiveness of usage of a
multi-scale network structure. This result suggests
Table 2: Comparison results. “Single” shows the result
without using multiple resolutions, and “Multi” shows the
result with multiple resolutions.
Acc
(
%
)
ECT END MES UND Mean
Sin
g
le 92 100 96 96 96
Multi 96 100 100 100 99
Table 3: Confusion matrix of the multiscale network.
Label
ECT END MES UND
ECT 24 0 0 0
END 1 25 0 0
MES 0 0 25 0
UND 0 0 0 25
that it is more effective to learn the feature maps while
retaining location information.
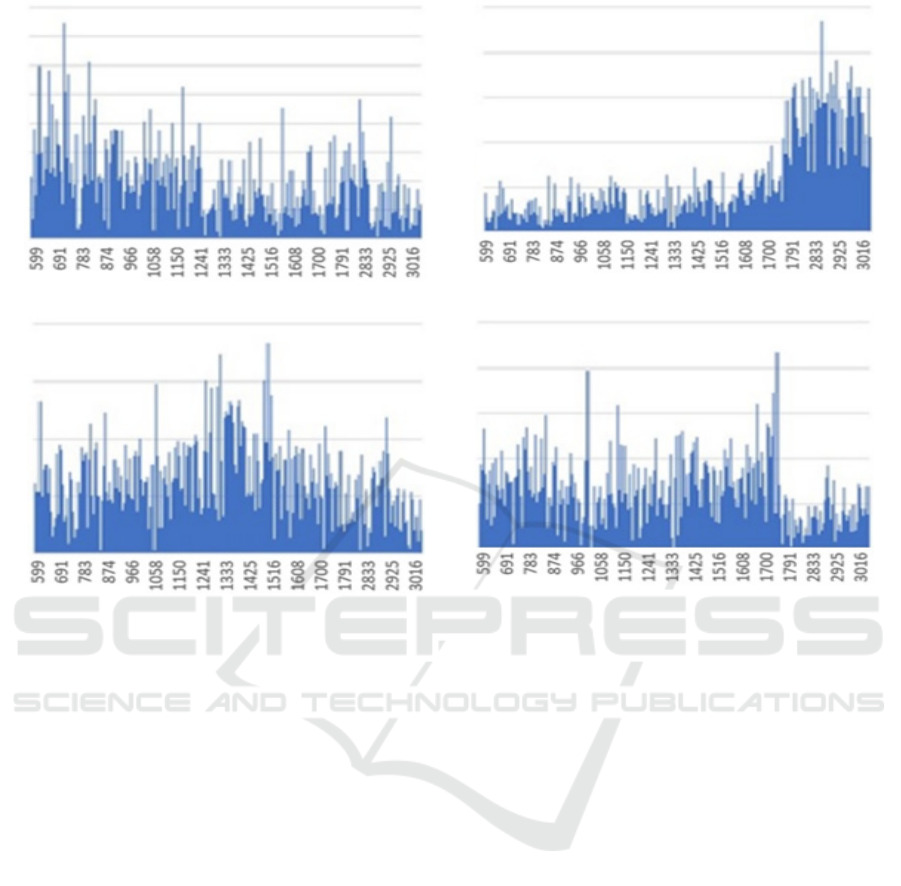
We compared the results of identifying effective
spectrum by the proposed method and
the conventional method using Grad-CAM. Figure 4
shows the importance of each class of iPS cells for the
proposed method and Figure 5 shows the importance
of each spectrum for the conventional method. Figure
4 demonstrated that the spectrum around 850𝑐𝑚
,
1200 𝑐𝑚
, and 1750 𝑐𝑚
for ectoderm (ECT),
1800𝑐𝑚
and later for mesoderm (MES), 1300𝑐𝑚
and 1500𝑐𝑚
for endoderm (END), and the first half
of the spectrum around 750𝑐𝑚
for undifferentiated
(UND) are effective for classification. When we
compare Figure 4 with Figure 5, the proposed method
makes it easier to identify the differences in the
effective spectrum of each cell.
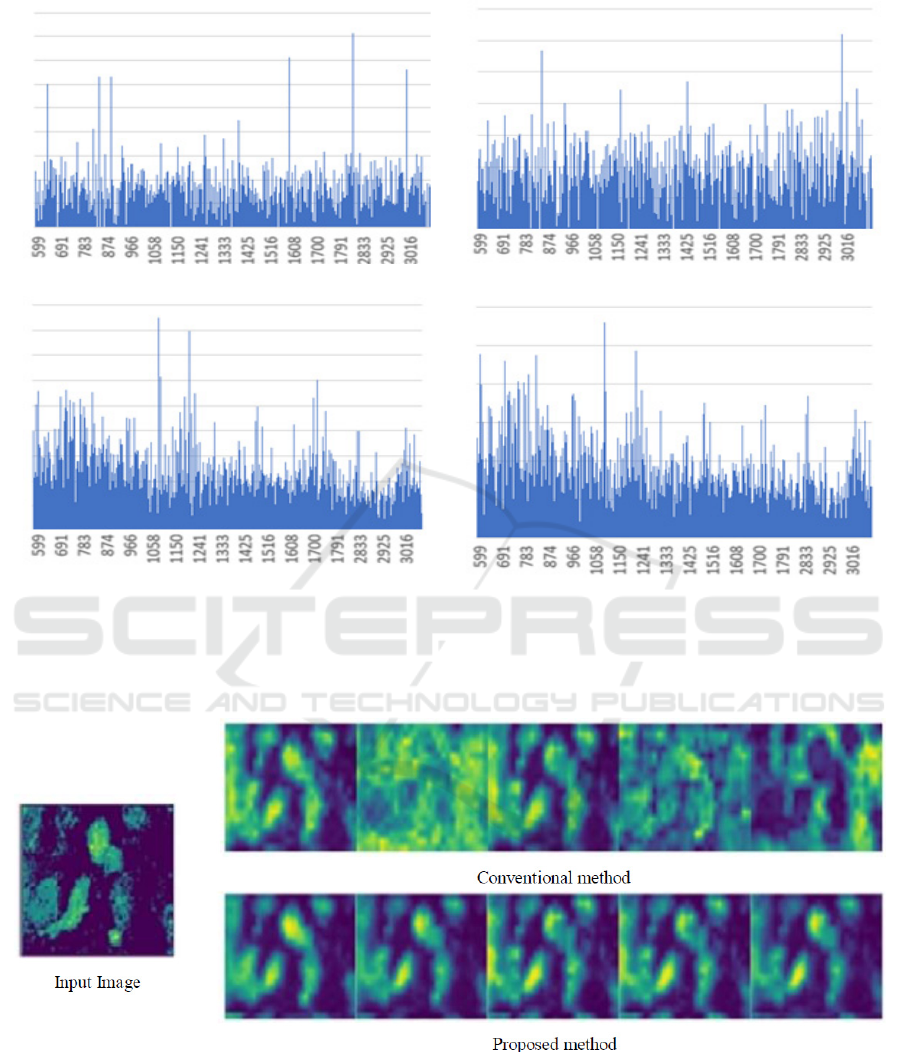
Figure 6 showed the feature maps that correspond
to top five effective spectra discovered by the
proposed method and the conventional method
(Takeshi et al., 2019). As the result of the
conventional method, the feature maps that non-cells
have high value were ranked high. On the other hand,
in the case of the proposed method, only the feature
maps that captured cells were ranked high. This result
demonstrated the effectiveness of our method using
both the F-measure for segmentation and the
gradients of feature maps. However, the results in
Figure 4 showed that the ECT and END classes have
similar values when the importance of the spectrum
is not high. This may show that the features of ECT
and END classes are more similar than those of the
other two classes, and the ECT class is misclassified
as END class in Table 3.
BIOSIGNALS 2022 - 15th International Conference on Bio-inspired Systems and Signal Processing
232
(a)
(b)
(c)
(d)
Figure 4: The importance of each class of iPS cells by the proposed method. The result is the sum of all values from samples
in each class. The vertical axis of the figure shows the total importance value, and the horizontal axis shows the spectrum
(𝑐𝑚
). (a) Results from of cells in the ectoderm (b) Results of cells in the mesoderm (c) Results of cells in the endoderm (d)
Results of undifferentiated cells.
5 CONCLUSION
In this paper, we propose the multi-scale network for
classifying iPS cells from the CARS microscopy
images. Effective spectrum is identified by
multiplying the F-measure based on cell
segmentation and the importance based on gradients
of feature maps. By using the proposed method, we
were able to identify the effective spectrum for the
classification of four kinds of iPS cells. This result
means that it is possible to suggest the molecular
information that characterizes each cell type from the
imaging data of the CARS microscope without any
prior information or prejudice. In the future, we
would like to make it possible to obtain similar results
when there are multiple iPS cells in an image.
ACKNOWLEDGMENTS
This work was supported by the SAPOIN
“Development of non-staining and non-invasive cell
characterization technology”.
REFERENCES
Takahashi Kazutoshi, and Shinya Yamanaka. "Induction of
pluripotent stem cells from mouse embryonic and adult
fibroblast cultures by defined factors." cell 126.4,
pp.663-676, 2006
Hideyuki Okano and Shinya Yamanaka. “iPS cell
technologies: significance and applications to CNS
regeneration and disease.” Molecular brain, 7.1, pp.1–
12, 2014.
Ji-Xin Cheng and X Sunney Xie. “Coherent anti-stokes
raman scattering microscopy: instrumentation, theory,
and applications.” The Journal of Physical Chemistry
B, 108.3, pp.827–840, 2004.
Discovery of Effective Spectrum for Classifying iPS Cells Taken with CARS Microscope
233
(a)
(b)
(c)
(
d
)
Figure 5: The importance of each class of iPS cells by the conventional method. The result is the sum of all values from
samples in each class. The vertical axis of the figure shows the total importance value, and the horizontal axis shows the
spectrum (𝑐𝑚
). (a) Results from of cells in the ectoderm (b) Results of cells in the mesoderm (c) Results of cells in the
endoderm (d) Results of undifferentiated cells.
Figure 6: Visualization results of the top five important spectrum. The left column shows the input image, the top row shows
the results by conventional method, and the bottom row shows the results by the proposed method. From left to right images
shows the feature maps with the first to the fifth important spectrum.
Michiel Müler and Andreas Zumbusch. “Coherent anti-
stokes raman scattering microscopy.” ChemPhysChem,
8.15, pp.2156–2170, 2007.
Begley, R. F., A. B. Harvey, and Robert L. Byer. "Coherent
anti‐Stokes Raman spectroscopy." Applied Physics
Letters 25.7, pp.387-390, 1974.
Saad Albawi, Tareq Abed Mohammed, and Saad Al-Zawi.
“Understanding of a convolutional neural network.” In
2017 International Conference on Engineering and
Technology (ICET), pp.1–6, 2017.
BIOSIGNALS 2022 - 15th International Conference on Bio-inspired Systems and Signal Processing
234

Ramprasaath R. Selvaraju, Michael Cogswell, Abhishek
Das, Ramakrishna Vedantam, Devi Parikh. “Grad-cam:
Visual explanations from deep networks via gradient-
based localization.” In Proceedings of the IEEE
international conference on computer vision, pp. 618–
626, 2017.
Takeshi Uemori, Atsushi Ito, Yusuke Moriuchi, Alexander
Gatto, and Jun Murayama. “Skin-based identification
from multispectral image data using cnns.” In
Proceedings of the IEEE/CVF Conference on
Computer Vision and Pattern Recognition, pp.12349–
12358, 2019.
Sun, Ke., Xiao, Bin., Liu, Dong., and Wang, Jingdong.
“Deep highresolution representation learning for
human pose estimation.” In Proceedings of the IEEE
conference on Computer Vision and Pattern
Recognition, pp. 5693-5703, 2019.
He, Kaiming., Zhang, Xiangyu., Ren, Shaoqing., and Sun,
Jian. “Deep residual learning for image recognition.” In
Proceedings of the IEEE conference on computer vision
and pattern recognition, p. 770-778, 2016.
Long, Jonathan, Evan Shelhamer, and Trevor Darrell.
"Fully convolutional networks for semantic
segmentation." Proceedings of the IEEE conference on
computer vision and pattern recognition, pp. 3431-
3440, 2015.
Otsu, Nobuyuki. "A threshold selection method from gray-
level histograms." IEEE transactions on systems, man,
and cybernetics 9.1, pp.62-66, 1979.
Discovery of Effective Spectrum for Classifying iPS Cells Taken with CARS Microscope
235
