
A Subset of Acoustic Features for Machine Learning-based and
Statistical Approaches in Speech Emotion Recognition
Giovanni Costantini
a
, Valerio Cesarini
b
and Daniele Casali
c
1
Department of Electronic Engineering, University of Rome Tor Vergata, Italy
Keywords: Emotions, Speech, Machine Learning, Arousal, Valence, Categorical, Dimensional.
Abstract: In this paper, a selection of acoustic features, derived from literature and experiments, is presented for emotion
recognition. Additionally, a new speech dataset is built by recording the free speech of six subjects in a
retirement home, as part of a pilot project for the care of the elder called E-Linus. The dataset is employed
along with another widely used set (Emovo) for testing the effectiveness of the selected features in automatic
emotion recognition. Thus, two different machine learning algorithms, namely a multi-class SVM and Naïve
Bayes, are used. Due to the unbalanced and preliminary nature of the retirement home dataset, a statistical
method based on logical variables is also employed on it. The 24 features prove their effectiveness by yielding
sufficient accuracy results for the machine learning-based approach on the Emovo dataset. On the other hand,
the proposed statistical method is the only one yielding sufficient accuracy and no noticeable bias when testing
on the more unbalanced retirement home dataset.
1 INTRODUCTION
A rigorous and universally accepted definition of
emotion does not currently exist. In general, we can
say that it is an internal state that is somewhat more
ancestral than feeling, but still rather complex, which
depends on external events but also on the way in
which the subject interprets and responds to these
events. Given the strong subjective value, it is
difficult to describe the emotional state objectively,
and to associate it with clear external manifestations
of this state. Particularly useful for this purpose are
the studies of Plutchik and Ekman (Plutchik, 1970,
1991, Ekman, 1999). Works of study and description
of emotions can be divided into two large groups: on
the one hand, those in which it is assumed that there
is a set of basic functions and that all the others are in
some way attributable to some variant or combination
of the emotions of base. However, there is no
agreement on which and how many basic emotions
are. This is what we call the categorical model. The
other set of theories, called the dimensional model, is
based on the assumption that what we call "emotion"
is actually a combination of two or more independent
a
https://orcid.org/0000-0001-8675-5532
b
https://orcid.org/0000-0002-8305-3604
c
https://orcid.org/0000-0001-8800-728X
factors. The key aspect is that these factors, called
dimensions, can vary continuously, giving rise to an
infinite amount of different shades. In this study, the
categorical model is considered along with principles
based on the Dimensional (or Circular Complex)
model to derive some acoustic features able to
differentiate emotions. The paper is organized as
follows: in the following section a description of the
categorical and dimensional models for speech
emotions is given; Section 3 describes the datasets,
Section 4 the acoustic features and classification
method and Section 5 presents the experimental
results. Finally, a discussion and conclusions section
ends the paper.
2 MODELS OF EMOTIONAL
SPEECH
In this work, we use the Categorical Model: we
assume that emotions are a well-defined set of
reactions to well-defined situations. Reactions innate
and in some way encoded in our own organism,
Costantini, G., Cesarini, V. and Casali, D.
A Subset of Acoustic Features for Machine Learning-based and Statistical Approaches in Speech Emotion Recognition.
DOI: 10.5220/0010912500003123
In Proceedings of the 15th International Joint Conference on Biomedical Engineering Systems and Technologies (BIOSTEC 2022) - Volume 4: BIOSIGNALS, pages 257-264
ISBN: 978-989-758-552-4; ISSN: 2184-4305
Copyright
c
2022 by SCITEPRESS – Science and Technology Publications, Lda. All rights reserved
257

which allow us to respond immediately, without
going through the mediation of the cerebral cortex.
This range of theories, as argued by Plutchik or
Ekman, affirm that emotions derive from “universal”
purposes, i.e., related to the survival of the species
(Palmero Cantero et al., 2011). The exact number and
type of basic emotions that are considered can vary
from author to author. In our work, the emotions
considered are fear, anger, joy and sadness. The
neutral state is also considered.
Fear is the emotion felt in front of a danger that
the subject is not considered able to face, and
therefore prepares himself to escape. The breathing
rate increases, as does the heartbeat, in order to bring
greater oxygenation to the muscles. The sympathetic
system is activated. A tremor can also be found at the
vocal level, both in the form of pitch and intensity
oscillations and, mostly, with characteristic
interruptions on the emission of the utterance.
Anger occurs when there is a danger that the
subject believes he can face: in this case, the
individual is not predisposed to escape, but to attack.
The reaction is in many respects similar to that of fear,
due to the activation of the sympathetic system, but
the pitch of the voice tends to be more stable, the
tremor less pronounced, and the volume stronger.
Joy occurs when there is no danger but rather the
prospect of gain where, however, a certain physical
effort is still required. Therefore, many of the
characteristics of the two emotions described above
are found. The difference from anger and fear is that
in this case the situation is perceived as positive and
pleasant.
Sadness, unlike the three emotions considered
above, occurs when there is no immediate need for
physical effort or a high reaction rate. Muscles relax,
breathing is slow. The subject is resigned and does
not prepare for either attack or flight, but passively
accepts the events that are happening.
Other emotions are considered by some authors,
for example disgust or contempt. Surprise is an
emotion that, depending on the case, can be
associated with joy, anger, or fear, but which has
some traits, especially regarding the facial
expression, which would lead to consider it an
emotion in its own right.
The Categorical Model has the advantage of being
very close to our usual way of describing emotions,
and at the same time easily applicable in classification
systems such as neural networks and, more generally,
machine learning. However, its rigidity makes it
unsuitable for a systematic approach that can
consider, in a scientific way, all the various nuances
between different emotions. For example, serenity
cannot be assimilated to joy, but not even to sadness.
For these reasons, an alternative, more
quantitative model has been proposed, the so-called
Dimensional Model that involves one, two or three
different dimensions that are judged sufficient to
quantify an emotion (Scherer 1984, 2001; Sander et
al., 2004, 2005; Watson et al., 1988; Schlosberg 1941,
1954; Wundt, 1896, Osgood et al., 1957; Russell,
1980; Cowie, 2000; Devillers et al., 2005; Devillers
et al., 2005). The most complex version of this model
is based on three parameters that qualify emotions:
Arousal: the grade of excitation in the subject.
High values are associated to “strong” feelings
like those experienced with anger.
Valence: the quality of the associated feeling,
which is referred to the way the subject reacts to a
certain situation: if it goes towards his
expectations, the valence is positive, otherwise it
is negative.
Insecurity: the grade of uncertainty that the
subject experiences about his own state of mind.
High values, like those associated to sadness, are
related to a feeling of dubiety and anxiety.
Although we did experiment on this very model, it is
not suitable for machine learning-based analyses as it
is. It is also worth noting that the choice of categorical
of dimensional model for describing emotions may
affect the completeness of the description, as some
parameters cannot be shared between models
(Parada-Cabaleiro et al., 2018). This explains our
need to find a reliable set of features, which can be
based on some principles underlined by the
Dimensional model, as will be explained in the
“Methods” section.
3 MATERIALS
Two datasets of emotional speech, recorde in Italian,
have been considered for the present study. The first
one is Emovo (Costantini et al., 2014) which consists
of a carefully recorded set of utterances by six actors
who were asked to read the same sentences
expressing different emotions. It is well balanced
with 84 recordings per emotion.
The second dataset is part of a pilot project called
E-Linus and is still in the preliminar phase of its
construction. The E-Linus project, supported by the
Lazio Region in 2021, aims to develop an Active &
Independent Living solution that operates through a
network of non-invasive IoT devices. The goal is to
build a new framework that integrates Artificial
BIOSIGNALS 2022 - 15th International Conference on Bio-inspired Systems and Signal Processing
258

Intelligence algorithms in a system of "Multimodal
Detection of mental states", identifying states of
isolation and depression in the elderly and improving
the level of home care. More info on E-Linus can be
found in the Acknowledgements section.
A voice recording framework has been
established in a retirement home, where the free
speech of five different subjects is being recorded in
time. However, it’s common for the subjects not to be
experiencing strong emotions, due to their life
conditions in the recovery home, as confirmed by
psychologists who are part of the project. Thus, a
huge unbalance towards “Neutral”-labeled emotions
can be observed, and no reliable recordings of “Fear”
being experienced have been collected. Due to the
different nature of the two sets, Emovo has been
chosen in order to also test the goodness of our
methods on a balanced and widely used dataset. Table
1 shows the number of instances for each emotion in
each dataset.
Table 1: Number of total instances for every emotion in
each dataset.
Emovo Retirement Home
Joy 84 20
Anger 84 27
Sadness 84 87
Fear 84 0
Neutral 84 676
Total 420 810
4 METHODS
4.1 Acoustic Features
Taking into consideration a categorical model where
each emotion corresponds to a “class”, our first aim
was to identify a generalized and optimal feature set
for the automatic identification of emotions. Said
features are acoustic properties of the voice signal,
and span from prosodic attributes to considerations on
the spectral and cepstral domains (Bogert et al.,
1963). In order to give a first idea of how emotions
are in fact related to acoustic features of the voice,
three diagrams are shown in Figure 2, based on an
actress enunciating the same sentence with five
different emotions. The sentence is in Italian: “I vigili
sono muniti di pistola”. The energy vs. time (seconds
are shown in the abscissa), the pitch of the sound and,
at the bottom, the power spectrum are shown. In the
first diagram (energy) the peaks correspond to the
syllables: it is possible to note that in anger they are
closer together, while in the neutral and in sadness
they are very far apart. This is confirmed by literature
(Katarina et al., 2016) and shows how prosodic
features are related to the emotion. In the second plot,
we can see joy bringing much higher pitch, while it
becomes much lower in sadness. The last plot shows
how the frequency content (spectrum) of the voice,
although still obeying to a similar power law, is due
to change when different emotions are experienced.
As an example, the high-mid frequency content when
expressing a neutral state is much higher than that
when fear is present.
Despite the categorical model being useful to
actually describe the emotions as speech-related
“classes”, the Dimensional model comes to help
when searching for concrete and quantifiable
parameters for emotion recognition. The three-
dimensional model is based on arousal, valence and
insecurity, which impose thresholds that allow an
emotion to be categorized. The three dimensions can
be associated to artifacts that can be heard in the
voice: this leads to the possibility of describing
similar indexes as arousal, valence and insecurity
with the use of acoustic features.
High arousal level (as in joy, fear, anger) is
generally characterized by higher sound pressure and
fast tempi, but also presence of vibrato (Jansens et al.,
1997). This basically means that energy and pitch are
relevant features for emotion recognition, which
anticipates most of the attributes that we chose to
consider as a selected set.
Valence is also reflected in voice quality: we can
describe voices with adjectives as tense, breathy, etc.
These kinds of parameters are mainly related to the
intensity of the harmonics and, in general, to the
shape of the power spectrum. Some of the most used
parameters to describe voice quality are the
Hammargberg index (Hammargberg et al., 1980) and
the spectral slope, which has been shown to be related
to stress (Shukla et al., 2011). Another feature that is
related to the spectral slope is the Hi to Low
frequency ratio of energy within the spectrum.
Moreover, studies on dysphonia showed that features
related to the cepstral domain (Alpan et al., 2009),
namely the Cepstral Peak Prominence, or CPP, and
the the Rahmonics-to-Noise Ratio, can be a measure
of voice quality especially regarding “breathiness”.
Cepstrum is the inverse transform of the logarithm of
the square module of the Fourier transform of the
signal. It is a reliable way of measuring pitch and
intelligibility of the fundamental frequency.
A set of features is dedicated to the measure of
speech and articulation rate, as well as duration and
number of silences, which are shown to be related to
A Subset of Acoustic Features for Machine Learning-based and Statistical Approaches in Speech Emotion Recognition
259
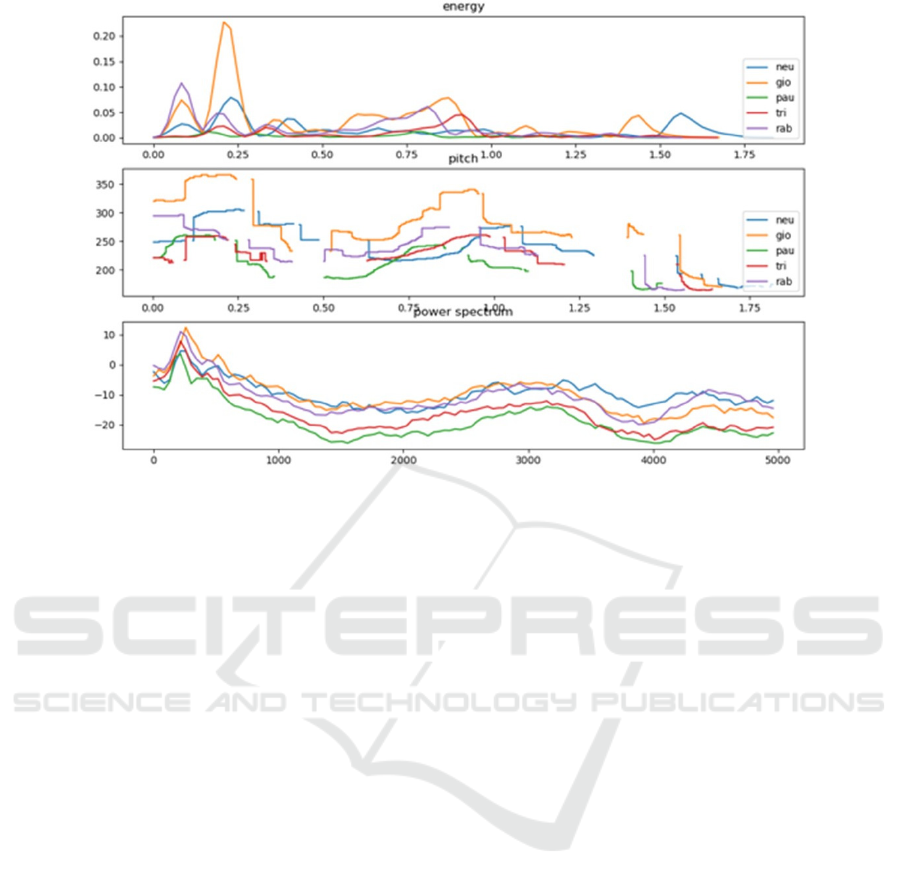
Figure 1: Energy and pitch vs. time and power spectrum of an actress pronouncing the same sentence “I vigili sono muniti di
pistola” with five different emotions. Legend: “neu” (blue) = neutral; “gio” (yellow) = happiness; “pau” (green) = fear; “tri”
(red) = sadness; “rab” (purple) = anger.
anxiety (Heman-Ackah et al., 2016).
Finally, consideration in the energy domain
regarding the spoken and silent time, and general
features regarding articulation and prosody are also
considered (Mencattini et al., 2014).
24 features have been selected for the extraction,
considered sufficient to summarize all information
regarding prosodic, pitch-related and spectral features
of emotional speech as shown in Figure 1.
An array of custom Python scripts (Van Rossum
and Drake, 2009) has been used to extract the
following features:
1. pm: pitch mean, i.e., the average of the pitch
calculated over the entire range of the vocal
signal.
2. pv: pitch variance, representing the variance that
characterizes the pitch within the emotional
expression.
3. pr: pitch range (max-min) calculated over the
entire range of the vocal signal.
4. dpm: delta pitch mean, mean value of the
derivative of the pitch.
5. dpv: delta pitch variance, which is the variance of
the derivative of the pitch.
6. dpr: delta pitch range, range of the derivative of
the pitch.
7. fin: ratio between the last pitch and the pitch
mean. It is a parameter that affects the valence: a
sad person, for example, tends to lower the pitch
of the voice in the final part of the sentences and,
therefore, the fin parameter will have a lower
value.
8. sprate: speech rate, which is a prosodic parameter
indicative of the speed of speech.
9. arate: articulation rate, similar to speech rate with
all silences cut out before measurement.
10. sdm: silence duration mean, which is the average
duration of silences (in seconds) occurring during
speech.
11. sdv: silence duration variance.
12. sdt: standard deviation of the silence duration.
13. ns: number of silences. 14. hilow: high
frequency to low frequency ratio. It divides the
spectrum into two bands (high frequency band
from 0 to 2000Hz, low frequency band from
2000Hz to 5000Hz) and calculates the ratio
between the average energy.
15. ham: Hammarberg index, as the difference
between the amplitude in dB of the spectral peak
in the 2000-5000Hz range and the one in the 0-
2000Hz range.
16. slope: angular coefficient of the linear regression
line of the power spectrum.
17. jittastd: standard deviation of the Jitter.
18. enm: mean of the energy in the whole signal.
19. enstd: standard deviation of the energy.
20. cppm: average value of CPP (Cepstral Peak
Prominence), which is the distance in dB between
BIOSIGNALS 2022 - 15th International Conference on Bio-inspired Systems and Signal Processing
260
the peak of the cepstrum and the linear regression
line of the cepstrum.
22. cppsm: average value of the CPP filtered with a
moving average filter.
23. cppsv: variance of the CPP filtered with a moving
average filter.
24. rbrm: average value of the Rahmonics to Noise
Ratio, i.e, the difference in dB between the peak
of the cepstrum and its average value.
For all features that involve Cepstrum, it has been
calculated on 23.2ms windows, at 10ms intervals.
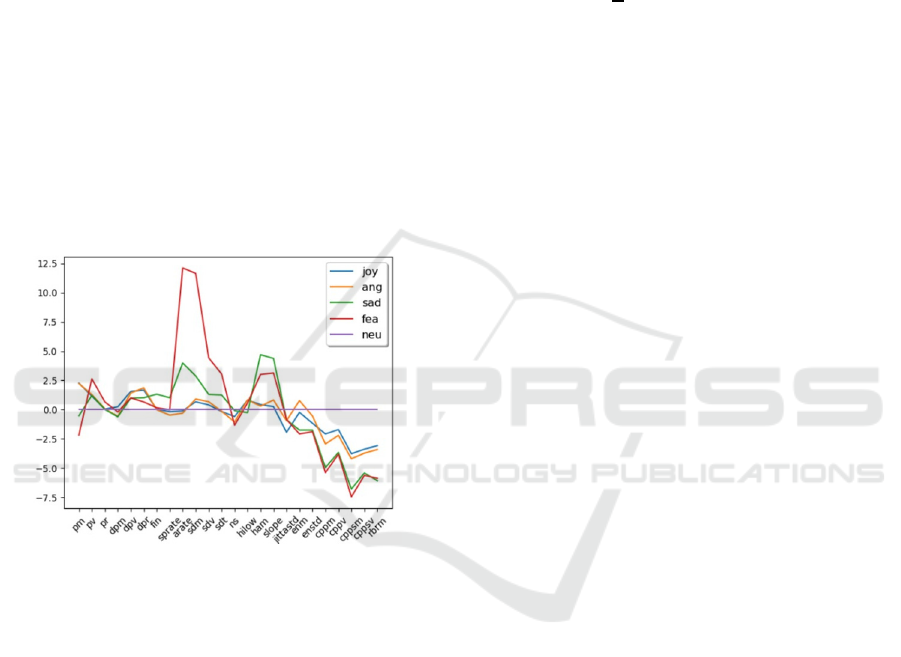
The way in which these parameters are related to
emotions can be guessed from the graph in Figure 2,
where the difference in standard deviations of the
average value of each parameter in all the recordings
of the same actress with respect to the average value
of the neutral is shown. It can be seen, for example,
how the articulation rate increases significantly (more
than six standard deviations from the average) when
experiencing fear.
Figure 2: Difference between the average of each feature
for each emotion and the average of the neutral, measured
in standard deviations. See Figure 1 for the Legend.
4.2 Machine Learning Approach
The 24 features, extracted as numbers, have been
used associated to labelled data in the training of two
different machine learning algorithms. The
environment chosen is Weka by the University of
Waikato (Eibe et al, 2016), and the algorithms have
been chosen based on considerations of the state-of-
the-art for speech and emotion analysis.
The first algorithm employed is a multi-class
SVM with a soft-margins linear kernel (Cortes and
Vapnik, 1995). This translates to the following
optimization problem: for a binary classification, let
y
0
=1 and y
1
=-1 be the two possible target functions,
each representing a class. With x being the data
points, the aim of the classifier is to find the best
hyperplane for linear separation of the data. Since our
SVM has a linear kernel, no higher-dimensional
projections are required. However, a “penalty”
parameter C (Wainer, 2016) can be introduced in
order to allow for outliers to fall outside of the
“correct” classification margins. This allows the
classifier to be more generalized, and prevents
overfit. The final optimization can be expressed as:
𝐶
|
𝑤
|
+
1
𝑛
max(0,1−𝑦
𝐻)
(1)
Where 𝐻=𝑤
𝑥−𝑏 represents the usual
maximum margin hyperplane function, with n being
the number of samples, w being the normal vector to
the hyperplane and b determines the offset.
Support Vector Machines have often proved
themselves as very effective in solving complex
problems, like that of audio classification, with scarce
datasets. Specifically, many studies have successfully
employed SVM classifiers for speech and audio
classification (Cesarini et al., 2021; Sellam and
Jagadeesan, 2014; Asci et al., 2020, Suppa et al.,
2020, Suppa et al., 2021). Although it’s an originally
binary classifier, multi-class approaches are possible
for SVM’s implementing a one-vs-one comparison
for each pair of classes, which is then unified thanks
to a majority voting mechanism.
The other algorithm of choice was the Naïve
Bayes (Webb, 2011), which is purely based on
probability and outputs the predicted class focusing
on the posterior probability calculated with Bayes’
theorem with the assumption that the features are
unrelated.
4.3 Statistical Approach
Machine learning models rely heavily on large
amounts of training data. Although they have proven
their effectiveness in many speech analysis tasks, the
complexity of a multi-class problem like the
identification of emotions led us to explore another
approach not based on learning.
A subset of macroscopic logical variables has
been obtained from the 24 numerical features, based
on the three-dimensional model with the aim to
parametrize Arousal, Valence and Insecurity, along
with other utility variables. Each variable is based on
thresholds of Z-scores (number of standard deviations
from the mean) with respect to neutral and is deemed
“True” when all the considered features are above a
certain Z-score threshold.
The variables are labelled as: aro, ins, pos, neg,
dep.
A Subset of Acoustic Features for Machine Learning-based and Statistical Approaches in Speech Emotion Recognition
261

Based on the dimensional model, emotions are
calculated from the five variables hierarchically as
such:
Anger: aro=True, neg=True.
Sadness: dep=True, att=False.
Happiness: aro=True, pos=True.
Fear: ins=True.
Neutral: none of the above conditions are met.
Note that this occurs whenever features cannot
overcome the thresholds of a sufficient amount of
standard deviations, which is in line with a neutral
state representing both the case when no specific
emotion is experienced, and when the strength of
the feeling is too mild.
5 EXPERIMENTAL RESULTS
5.1 Retirement Home Dataset
We first show the results of the two machine learning
approaches and the statistical one obtained on the
dataset collected during the project in retirement
homes. The accuracy for both machine learning
algorithms has been obtained by means of a 10-fold
cross-validation, by averaging the test performances
over each of the ten folds. The results are shown in
Tables 2, 3 and 4.
Table 2: Confusion matrix for classification with SVM on
the free-speech dataset. The emotions identified by the
operators are shown on the lines, the emotion recognized by
the system are in the columns.
Joy Anger Sad. Fear Neut.
Joy 0% 0% 0% 0% 100%
Anger 0% 0% 0% 0% 100%
Sadness 0% 0% 12% 0% 88%
Neutral 0% 0% 0% 0% 100%
Table 3: Confusion matrix for classification with Bayesian
classifier on the free-speech dataset.
Joy Anger Sadness Fear Neutral
Joy 70% 5% 5% 0% 20%
Anger 19% 48% 15% 0% 19%
Sadness 7% 9% 45% 0% 39%
Neutral 27% 16% 12% 0% 45%
Unweighted mean accuracy is 69.7% for the
SVM, 45.6% for the Naïve Bayes and 66.3% for the
statistical approach. However, it is evident upon
examination of the confusion matrices that the SVM
classifier is biased towards the neutral class, and the
accuracy value is in turn biased by the huge unbalance
Table 4: Confusion matrix for classification with manual
selection of thresholds for the free-speech dataset.
Joy Anger Sad. Fear Neut.
Joy 70% 10% 0% 0% 20%
Anger 7% 59% 15% 0% 19%
Sadness 2% 7% 62% 1% 28%
Neutral 6% 4% 23% 1% 67%
of training examples pertaining to said class.
5.2 Emovo Dataset
We tested the same machine learning system on the
Emovo database; however, due to the profoundly
different nature of the two databases, especially with
respect to vocal tasks, age and strength of the
emotions, no preliminary results of the statistical
model can be shown, as the model itself should be
revised and studied deeper.
It is worth noting that all of these aspects do
influence the general quality of the voice and of the
features that can be extracted from it (Saggio and
Costantini, 2020).
The mean accuracy achieved with the SVM
classifier is 73%, while that obtained with the Naïve
Bayes is 74.5%. Table 5 and Table 6 show confusion
matrices.
Table 5: Confusion matrix for classification with SVM for
the Emovo dataset. Accuracy is 73%.
Joy Anger Sad. Fear Neut.
Joy 63% 15% 2% 14% 6%
Anger 20% 63% 5% 7% 5%
Sadness 0% 0% 88% 2% 10%
Fear 12% 15% 11% 62% 0%
Neutral 3% 0% 7% 10% 80%
Table 6: Confusion matrix for classification with Bayesian
classifier for the Emovo dataset. Accuracy is 74.5%.
Joy Anger Sad. Fear Neut.
Joy 67% 19% 1% 7% 6%
Anger 18% 75% 4% 2% 1%
Sadness 2% 0% 81% 7% 10%
Fear 18% 8% 10% 63% 1%
Neutral 7% 2% 1% 2% 87%
6 DISCUSSION AND
CONCLUSIONS
A set of 24 acoustic features has been built, by
selecting the attributes based on literature on speech
emotion recognition and psychology.
BIOSIGNALS 2022 - 15th International Conference on Bio-inspired Systems and Signal Processing
262

Moreover, a pilot project involving the care for
elders in retirement homes led to the preliminary
construction of a speech emotion dataset of free
speech for five elder subjects. Said dataset, still in the
very early stages, is unbalanced towards the “neutral”
class, and presents a general trend of mild emotions
experienced by the subjects, possibly due to their
psycho-physical conditions and to the environment.
Thus, along with a dual machine learning based-
approach training on the 24 features, a statistical
approach is preliminarily experimented on the
retirement home dataset, where learning is not
optimal due to the nature of the set.
On the other hand, the well-known Emovo dataset
is considered for the test of the effectiveness of the 24
features, in the sole machine learning environment.
Experimental results show that the machine
learning models, although generally desirable for
performance, are almost inapplicable to the
retirement home dataset. In fact, the SVM approach
reached a sufficient unweighted mean accuracy, but it
appears to be heavily biased on the neutral class.
Weighted accuracy, in fact, falls to 28% which is just
slightly better than random guessing (over 5 classes).
On the other hand, the Naïve Bayes classifier, despite
not being biased, brings to a measly 45.6%. The
statistical model, in the end, yielded the best results
with an unweighted mean accuracy of 66.3%, and a
comparable weighted mean accuracy of 64.5%.
On the other hand, the 24 features appear as a
partially reliable set for the balanced Emovo dataset,
with 73% and 74.5% accuracies for the SVM and
Naïve Bayes classifiers, and no noticeable biases.
A well-defined, concise, dataset-independent set
of acoustic features is desirable for the future of
speech emotion recognition (Tahon and Devillers,
2016), and, since the introduction of models like the
circum-complex and three-dimensional one, it’s
reasonable to try and build the feature set upon it.
Preliminary results show that the feature set is
sufficiently effective for a machine learning based
approach. However, a refinement of the very features
and a possible enlargement of the emotion/class pool
is foreseeable. Besides, other datasets (Parada-
Cabaleiro et al., 2020) exist which we consider of
relevance regarding the quality of the recordings,
expressed emotions and homogeneity, and testing our
methods on those is definitely something to focus on,
especially for the improvement of preliminary and yet
unexplored methods like the statistical one.
On the other hand, the pilot study involving elders
in retirement homes is hopefully going to expand,
with the collection of more data by more subjects.
Preliminary analyses show that heavily unbalanced
datasets like that can benefit from the introduction of
a purely statistical method based on the
reconstruction of circumplex dimensions with the 24
extracted features.
ACKNOWLEDGEMENTS
This work has been supported in part by VoiceWise
within the E-Linus project. More info about the
project can be found at: https://datawizard.it/e-linus-
integrazione-sociale-anziani/.
REFERENCES
Alpan, A., Schoentgen, J., Maryn, Y., Grenez, F., Murphy,
P. (2009). Cepstral analysis of vocal dysperiodicities in
disordered connected speech. Proceedings of the
Annual Conference of the International Speech
Communication Association, INTERSPEECH. 959-
962.
Asci, F., Costantini, G., Di Leo ,P., Zampogna ,A.,
Ruoppolo ,G., Berardelli ,A., Saggio ,G., Suppa ,A.
(2020). Machine-Learning Analysis of Voice Samples
Recorded through Smartphones: The Combined Effect
of Ageing and Gender. Sensors. 20(18):5022. https://
doi.org/10.3390/s20185022
Bogert, B.P., Healy, M.J.R., Tukey J.W. (1963). The
Quefrency Alanysis [sic] of Time Series for Echoes:
Cepstrum, Pseudo Autocovariance, Cross-Cepstrum
and Saphe Cracking, Proceedings of the Symposium on
Time Series Analysis.
Cesarini, V., Casiddu, N., Porfirione, C., Massazza, G.,
Saggio, G., Costantini, G. (2021). A Machine Learning-
Based Voice Analysis for the Detection of Dysphagia
Biomarkers, In: 2021 IEEE MetroInd4.0&IoT.
Chandran R., Abaza S., Lyons M, Divi K., Lott
V., Johnson, J., & Hillenbrand, J. (2014). Quantifying
the cepstral peak prominence, a measure of dysphonia.
Journal of Voice: Official Journal of the Voice
Foundation, 28(6), 783–788.
Cortes, Corinna; Vapnik, Vladimir N. (1995). "Support-
vector networks" (PDF). Machine Learning.
Costantini, G., Iaderola, I., Paoloni, A., & Todisco, M.
(2014). Emovo Corpus: an Italian Emotional Speech
Database. In Proceedings of the Ninth International
Conference on Language Resources and Evaluation
(LREC'14)-
Cowie, R. (2000). Describing the emotional states
expressed in speech. In: Proceedings of ISCA ITRW on
Speech and Emotion: Developing a Conceptual
Framework for Research, pp. 224–231.
Devillers, L. - Vidrascu, L. - Lamel, L. (2005). Challenges
in real-life emotion annotation and machine learning
based detection. Neural Networks, 18, 407–422.
Eibe F., Hall, M. and Witten, I. (2016). The WEKA
Workbench. Online Appendix for Data Mining:
A Subset of Acoustic Features for Machine Learning-based and Statistical Approaches in Speech Emotion Recognition
263

Practical Machine Learning Tools and Techniques,
Morgan Kaufmann, Fourth Edition, 2016.
Ekman, P. (1999). Basic emotions. In: T. Dalgleish - M. J.
Power (Eds.), Handbook of cognition and emotion,
John Wiley and Sons Ltd, New York, pp. 301–320.
Hammargberg, Britta, et al. (1980). Perceptual and acoustic
correlates of abnormal voice qualities. Acta oto-
laryngologica, vol. 90, no 1–6, p. 441–451.
Heman-Ackah, Y. D., Sataloff, R. T., Laureyns, G., Lurie,
D., Michael, D. D., Heuer, R., Rubin, A., Eller,
Harrigan, J.A., Wilson, K., Rosenthal, R. (2016).
Detecting State and Trait Anxiety from Auditory and
Visual Cues: A Meta-Analysis, Personality and Social
Psychology Bulletin, 30, 1, (56-66).
Jansens, S., Bloothooft, G., de Krom, G., (1997). Perception
and acoustics of emotions in singing. In: Proceedings
of the 5th Eurospeech.
Katarina, B., Jouvet, D., Delais-Roussarie, E. (2016).
Prosodic parameters and prosodic structures of French
emotional data. 644-648. Speech Prosody.
Mencattini, A., Martinelli, E., Costantini, G., Todisco, M.,
Basile, B., Bozzali, M., Di Natale, C. (2014). Speech
emotion recognition using amplitude modulation
parameters and a combined feature selection procedure.
Knowledge-based Systems, vol. 63, p. 68-81, ISSN:
0950-7051, doi: 10.1016/j.knosys.2014.03.019
Osgood, C. E. - Suci, G. J. - Tannenbaum, P. H. (1957). The
measurement of meaning, University of Illinois Press,
Urbana, USA.
Palmero Cantero, F. - Guerrero Rodríguez, C. - Gómez
Iñiguez, C. - Carpi Ballester, A. - GORAYEB, R. (Eds.)
(2011). Manual de teorías emocionales y
motivacionales, Publicacions de la Universitat Jaume I.
Parada-Cabaleiro ,E., Costantini ,G., Batliner ,A., Baird ,A.,
Schuller ,B.W. (2018). Categorical vs dimensional
perception of Italian emotional speech. In: Proceedings
of the Annual Conference of the International Speech
Communication Association, INTERSPEECH.
Parada-Cabaleiro, E., Costantini, G., Batliner, A., Schmitt,
M., & Schuller, B.W. (2020). DEMoS: an Italian
emotional speech corpus: Elicitation methods, machine
learning, and perception. Language Resources and
Evaluation, ISSN: 1574-020X.
Plutchik, R. (1970). Emotion, evolution and adaptative
processes. In: Feelings and Emotions: The Loyola
Symposium, Academic Press, New York.
Plutchik, R. (1991). The Emotions, University Press of
America, New York.
Plutchik, R. (2001). The Nature of Emotions. American
Scientist, 89 (4), 344–350.
Russell, J. A. (1980). A Circumplex Model of Affect.
Journal of Personality and Social Psychology.
Saggio G, Costantini G (2020). Worldwide Healthy Adult
Voice Baseline Parameters: A Comprehensive Review.
Journal of Voice, ISSN: 0892- 1997
Sander, D. - Grandjean, D. - Scherer, K. (2005). A Systems
Approach to Appraisal Mechanisms in emotion. Neural
Networks 18, 317–352.
Scherer, K. R. - Wranik, T. - Sangsue, J. - Tran, V. -
Scherer, U. (2004). Emotions in Everyday Life:
Probability of Occurrence, Risk Factors, Appraisal and
Reaction Patterns.
Social Science Information.
Scherer, K. R. (1984). Emotion as a multicomponent
process: a model and some cross-cultural data. Review
Personality and Social Psychology, 5, 37–63.
Scherer, K. R. (2001). Appraisal considered as a process of
multi-level sequential checking. In: K. Scherer - A.
Schorr - T. Johnstone (Eds.), Appraisal Processes in
emotion: theory, methods, research.
Schlosberg, H. (1941). A Scale for the Judgement of facial
expressions. Journal of experimental psychology.
Schlosberg, H. (1954). Three Dimensions of Emotion.
Psychological Review, 61 (2), 81–88.
Sellam, V., Jagadeesan, J. (2014). Classification of Normal
and Pathological Voice Using SVM and RBFNN.
Journal of Signal and Information Processing.
Shukla, S., Dandapat, S., Prasanna, S.R.M. (2011): Spectral
slope based analysis and classification of stressed
speech. International Journal of Speech Technology,
14(3), 245–258
Suppa, A., Asci, F., Saggio, G., Marsili, L., Casali, D.,
Zarezadeh, Z., Ruoppolo, G., Berardelli, A., Costantini,
G. (2020). Voice analysis in adductor spasmodic
dysphonia: Objective diagnosis and response to
botulinum toxin. Parkinsonisms and Related Disorders,
ISSN: 1353-8020
Suppa A, Asci F, Saggio G, Di Leo P, Zarezadeh Z,
Ferrazzano G, Ruoppolo G, Berardelli A, Costantini G
(2021). Voice Analysis with Machine Learning: One
Step Closer to an Objective Diagnosis of Essential
Tremor. Movement Disorders, vol. 36, p. 1401-1410,
doi: http://dx.doi.org/10.1002/mds.28508
Tahon, M., Devillers, L. (2016). Towards a Small Set of
Robust Acoustic Features for Emotion Recognition:
Challenges. IEEE/ACM Transactions on Audio, Speech
and Language Processing.
Van Rossum, G., Drake, F. L. (2009). Python 3 Reference
Manual. Scotts Valley, CA: CreateSpace.
Wainer, Jacques (2016). Coefficients in Support Vector
Machine, URL (version: 2016-11-25):
stats.stackexchange.com/q/247895.
Watson, D. - Clark, L. A. - Tellegen, A. (1988).
Development and validation of brief measures of
positive and negative affect: the panas scales. Journal
of personality and social psychology, 54 (6), 1063–
1070.
Webb G.I. (2011). Naïve Bayes. In: Sammut C., Webb G.I.
(eds) Encyclopedia of Machine Learning.
Wundt, W. (1896). Grundriss Der Psychologie, Verlag Von
Wilhelm Engelmann, Leipzig.
BIOSIGNALS 2022 - 15th International Conference on Bio-inspired Systems and Signal Processing
264
