
Short-term Glucose Prediction based on Oral Glucose Tolerance Test
Values
Elias Dritsas, Sotiris Alexiou, Ioannis Konstantoulas and Konstantinos Moustakas
Department of Electrical and Computer Engineering, University of Patras, 26504 Rion, Greece
Keywords:
OGTT, Glucose, Diabetes, Regression, Short-term Prediction.
Abstract:
Abnormal glucose metabolism increases the risk for cardiovascular disease and mortality. A key motivation for
investigating this topic is Diabetes prevalence, which is the most common example of metabolic disorder that
concern humans all over the world. The oral glucose tolerance test (OGTT) constitutes a traditional medical
screening tool for all types of diabetes such as prediabetes, gestational, type 2 diabetes, insulin resistance
or discrimination of Impaired Glucose Tolerance (IGT) from Natural Glucose Tolerance (NGT) individuals.
Another motivation for this study is that a plethora of studies has shown the effectiveness of machine learning
in glycemic control and improvement of diabetic’s management. This research study aims to evaluate the
adequacy of machine learning on the short-term prediction of glucose levels. The main contribution of this
analysis is a Random Forest regression tree model which, has been trained considering various risk factors and
glucose samples obtained by a 2-hour OGTT, after a fast and then after an oral intake of glucose, at intervals
of 30 minutes. The research outcomes verify the efficacy of Random Forest (RF).
1 INTRODUCTION
The analysis of blood glucose levels is a crucial task
for the assessment of glucose metabolic control and
the definition of the therapeutic protocol. Patients
with Impaired Glucose Tolerance (IGT) are more
likely to have type 2 diabetes (Knowler et al., 2009),
(Fiorentino et al., 2015) and are at a higher car-
diovascular disease risk (Abdul-Ghani et al., 2017),
(Baranowska-Jurkun et al., 2020). IGT in the litera-
ture is commonly defined as a cutoff of 7.8 mmol/L
of the plasma glucose levels measured after spe-
cific strenuous physical activity and 2 hours after an
Oral Glucose Tolerance Test (OGTT) of 75g of glu-
cose (World-Health-Organization, 1999), (Kerner and
Br
¨
uckel, 2014). As the most common method of test-
ing glucose tolerance, the OGTT is used to screen for
diabetes like type 2, prediabetes and gestational dia-
betes. The OGTT provides data that can also quan-
tify insulin sensitivity versus tolerance (Altuve et al.,
2016). These types of diabetes may be accountable
for either long-term, such as kidney disease, heart dis-
ease, stroke, or short-term, like, hyperglycemia or hy-
poglycemia. Hence, the early identification of undi-
agnosed diabetic patients or those at high risk is an
emergency.
Machine learning, as a tool in data science, has
seen major successes in the healthcare sector (Bide
and Padalkar, 2020). The availability of data and the
quality and quantity of them increase the accuracy of
any data-driven approach of the field. In the case of
blood glucose quantification and, more generally, di-
abetes risk monitoring, more data becomes available
each year. In this research area, there is an increase
in interest (Islam et al., 2021), (Refat et al., 2021) and
there is no doubt that machine learning can be used
as an evaluation tool of blood glucose measurement
datasets.
In the literature, we have seen that machine learn-
ing can be used for predicting glucose levels dur-
ing or after an OGTT (Maeta et al., 2018) improv-
ing the quantity and quality of data in datasets asso-
ciated with glucose, insulin and diabetes in general.
While improving the data of a dataset, in general, is
a very useful science, more specifically, predicting
risk for diabetes in individuals improves health and
well-being, as prevention and prediction are usually
instrumental to better treatment. For this reason, in
this work, we aim to apply machine learning and data
science principles to implement a method that could
predict the risk of diabetes in individuals.
Body mass index (BMI) is a risk factor that is
utilized by experts for the identification of over-
Dritsas, E., Alexiou, S., Konstantoulas, I. and Moustakas, K.
Short-term Glucose Prediction based on Oral Glucose Tolerance Test Values.
DOI: 10.5220/0010974200003123
In Proceedings of the 15th International Joint Conference on Biomedical Engineering Systems and Technologies (BIOSTEC 2022) - Volume 5: HEALTHINF, pages 249-255
ISBN: 978-989-758-552-4; ISSN: 2184-4305
Copyright
c
2022 by SCITEPRESS – Science and Technology Publications, Lda. All rights reserved
249
weight or obese individuals given that these groups
are more prone to occur insulin resistance and dia-
betes (Charoentong et al., 2004). Besides, BMI is
strictly connected with the individual weight, which,
in turn, is impacted by physical activity, meals pattern
and general lifestyle. Of course, the list of diabetes-
related risk factors is not restricted to them. In the
context of this paper, a naive methodology is pre-
sented that could be used for the short-term risk pre-
diction of IGT, gestational diabetes or type 2 diabetes
(as shown in Table 1 (Rong et al., 2021)) based on his-
torical glucose values obtained from an OGTT. As a
first approach, a random forest regression tree is em-
ployed with satisfactory prediction performance.
The elaborated method for the short-term predic-
tion of OGTT glucose levels is being developed in-
dependently with publicly available data and, in par-
allel, as part of the SmartWork project with data
pending from pilots of the project. The SmartWork
project (Fazakis et al., 2021) is a distributed system
of e-health management and aims to improve an indi-
vidual’s quality of life through serving interventions
and suggestions based on biometric data and analysis
done on said data. This work will be integrated into
the wider health improvement interventions and sug-
gestions system of the SmartWork system. This work
is also to be integrated in the GATEKEEPER architec-
ture, as the aim of the project is to provide smart solu-
tions for early risk detection and prevention among
the senior population. The GATEKEEPER project
is an e-health ecosystem to enable collaboration be-
tween healthcare providers, industry and public ad-
ministration.
The next sections of this paper are organized as
follows. In Section 2, the blood glucose sampling
scheme is introduced. Next, the proposed machine
learning-based methodology is presented. In Section
3, the necessary details on the evaluated dataset are
given. Section 5 presents experiments information,
implementation details and definitions of the perfor-
mance metrics. Section 6 makes a critical review and
discussion on the results. Finally, Section 7 summa-
rizes the main outcomes of the analysis and future re-
search directions.
2 DATASET
For the purpose of the current analysis, we considered
the dataset derived by the authors in (Edinburgh et al.,
2018). Therefore, we will present some useful infor-
mation concerning the preparation made before the 2-
h OGTT, as shown in Figure 1, under three different
conditions.
Table 1: OGTT results in mmol/L according to the Ameri-
can Diabetes Association (ADA) criteria.
No Diabetics IGT Diabetics
Fasting
value
< 6 6.0 −7.0 > 7.0
(before
test)
At 2
hours
< 7.8 7.9 − 11.0 > 11.0
2.1 Blood Glucose Sampling Scheme
Participants arrive at the laboratory with a deviation of
one hour before or after 08:00 in the morning. After
taking a 5 minute expired gas sample and a baseline
muscle sample from vastus lateralis, the Breakfast-
Excercise (BE) and Breakfast-Rest (BR) participant
groups consume a 431 kcal porridge breakfast while
the Fasting-Excercise (FE) group is allowed only wa-
ter, at that point and every 60 minutes, therefore, both
groups have expired gas samples taken.
After 1 hour 40 minutes of rest a [6.6
2
H
2
] glu-
cose infusion is initiated on the participants. After 20
minutes, BE and FE participants initiate a 60 minute
cycling exercise at 50% Peak Power Output (PPO)
on an ergometer, BR participants rest instead of ex-
ercising, while both groups have expired gas samples
taken every 15 minutes and blood samples every 40 to
50 minutes. Then a 2-h OGTT is done, with arterial-
ized blood sampling every 10 minutes and expired gas
sampling every 60 minutes. The administered OGTT
is 73g of glucose. A final sample is taken 2 hours after
the start of the OGTT.
2.2 Features Description
Participants features include age, height and body
mass which are measured in years, centimetres (cm)
and kilograms (Kg), respectively. An important
feature-risk factor that relates to obesity is body mass
index (BMI) which is calculated as the body mass
divided by squared height (Kg/m
2
). Moreover, the
Fat mass is measured, in Kg, by a whole-body dual-
energy x-ray absorptiometry scan and, the fat mass
index is calculated as the ratio of fat mass divided by
squared height (kg/m
2
). Body fat percentile is cal-
culated as fat mass divided by body mass and fat-
free mass is calculated as subtraction of fat mass from
body mass.
Peak power output is measured in Watt and cal-
culated as the work rate final stage on an endurance
workout stress test with increasing intensity, plus a
fraction of time spent in the other stages multiplied
by their respective work rate increment. HRmax is the
HEALTHINF 2022 - 15th International Conference on Health Informatics
250
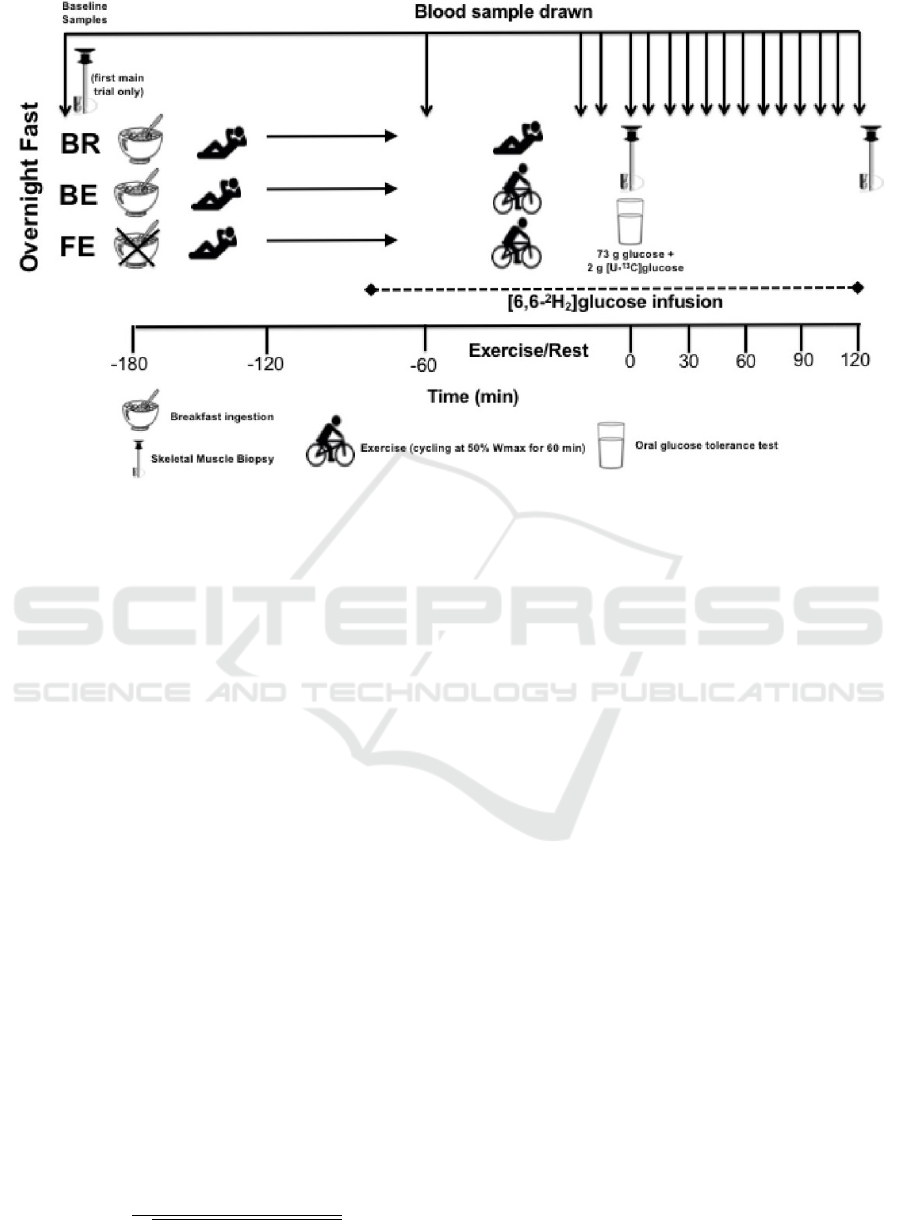
Figure 1: Blood Glucose Sampling Scheme(Edinburgh et al., 2018).
maximum heart rate measured throughout all the exer-
cises. VO
2
peak measures VO
2
and is calculated as the
highest average VO
2
over a 30 second period. Blood
glucose is measured in millimoles per litre (mmol/L)
by administering an OGTT at different points during
the day.
For each participant, the dataset consists of age,
height, body mass, body mass index, fat mass, fat
mass index, body fat percentile, fat-free mass, peak
power output, HRmax which are single values. Blood
glucose is measured every 10 minutes with differen-
tiation to before and after exercises of varying inten-
sity creating a discrete series of results for the subject
throughout the timeline of the study.
2.3 Dataset Preprocessing
In machine learning, feature selection is a key com-
ponent in developing accurate and trustworthy pre-
diction models. It is well known that the correlation
coefficient of the prediction improves as the attributes
dimension increases until the optimal number of fea-
tures is obtained. Therefore to avoid overfitting and
to achieve better prediction results we used the most
correlated attributes according to an attribute ranker,
which is a proven technique for selecting the most rel-
evant attributes from a dataset based on the Pearson’s
correlation coefficient (CC) (Mukaka, 2012) defined
as
CC =
∑
N
i=1
(x
i
− ¯x)(y
i
− ¯y)
q
∑
N
i=1
(x
i
− ¯x)
2
∑
(y
i
− ¯y)
2
, (1)
where x
i
and y
i
are the values of features x and y
for the i-th individual. More specific, the attribute
ranker only selects attributes that have a moderate-to-
high positive or negative correlation (close to -1 or 1)
and drops any attributes with a low correlation (value
close to zero).
For the purposes of the specific OGTT experi-
ment, a publicly available dataset consisting of mostly
invasive data had been engaged. In the final dataset,
which is a subset of the AJP dataset, we included all
participants’ demographic, anthropometric and clin-
ical data like age (years), stature (cm), body mass
(kg), body mass index (kg/m2), fat mass (kg), fat
mass index (kg/m2), body fat (%), fat-free mass (kg),
VO
2
peak(l/min), VO
2
peak (ml/ kg·min), peak power
output (W), HRmax (beats/min) and oral glucose tol-
erance test glucose samples for each participant, one
every 10 minutes for each one of the three trials: BR,
BE, and FE. A statistical description of the dataset is
outlined in Table 2. Notice that two of the twelve par-
ticipants belong to the overweight class (25 ≤ BMI <
30) while the rest are healthy (18.5 ≤ BMI < 25)
(Kakoly et al., 2019).
3 METHODOLOGY
In the context of this analysis, the aim is to present a
methodology for short-term glucose prediction based
on OGTT values and make lifestyle interventions to
avoid either short- or long-term effects of diabetes-
Short-term Glucose Prediction based on Oral Glucose Tolerance Test Values
251
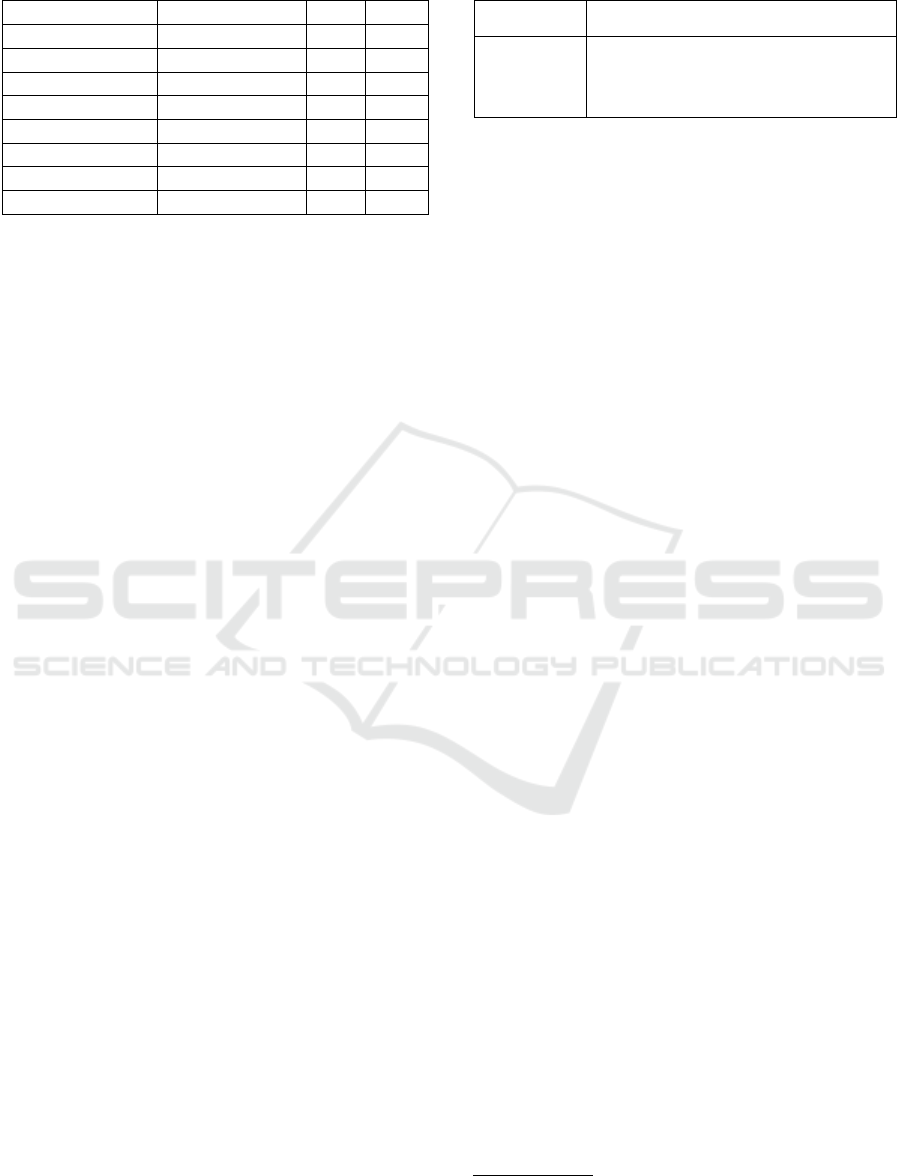
Table 2: Dataset Statistical Characteristics.
Feature Mean ± std Min Max
Age 22.6 ± 2.8 21 26
BMI 23.5 ± 1.9 21.1 27.2
Fat Mass Index 3.27 ± 1.13 1.7 5.6
Body Fat % 13.76 ± 4.44 8 23.6
PPO 317.17 ± 66.97 200 421
HR max 189.3 ± 10.40 170 206
VO2peak 3.99 ± 0.72 2.65 5.06
VO2peak2 53.09 ± 9.85 37 70.8
related metabolic disorder. In particular, machine
learning has been employed for the prediction of
OGTT values. Here, it should be noted that it
is a widely used test suitable for the identifica-
tion/diagnosis of pre-diabetes, gestational diabetes in
pregnant women, insulin resistance and reactive hy-
poglycemia.
The prediction model was trained with the fea-
tures of twelve healthy and physically active men
(that obtained from the publicly available dataset de-
scribed in Section 2.3), such as twelve glucose mea-
surements collected from an OGTT test, BMI, heart
rate and exercise-related parameters. The role of
breakfast meal, fasting and exercise on how the body
metabolises the intake of sugar/carbohydrate is also
assessed. The application of this model aims to
support health care management. In the context of
this study, the forecasting performance of a machine
learning model is presented under different cases as
described in Section 2. In particular, the RF tree is uti-
lized to estimate the upcoming glucose values (Alex-
iou et al., 2021) of each participant by constructing a
global model.
The RF method builds prediction models using
regression trees, which are usually unpruned to give
strong predictions. The bootstrap sampling method
is used on the regression trees which should not be
pruned. Only the optimal nodes are sampled to form
the optimal splitting feature. The random sampling
technique used in selecting the optimal splitting fea-
ture lowers the correlation and hence, the variance of
the regression trees. It improves the predictive capa-
bility of distinct trees in the forest. The sampling us-
ing bootstrap also increases independence among in-
dividual trees (Denil et al., 2014), (Ye et al., 2020).
Bagging and random feature selection are two
powerful machine-learning techniques used by RF.
Each tree is trained on a bootstrap sample of the train-
ing data in bagging, and predictions are made by a
majority vote of the trees. RF is a step forward from
bagging. When developing a tree, RF randomly se-
lects a subset of features to divide at each node rather
than using all of them. It uses out-of-bag (OOB) sam-
Table 3: Model Hyperparameters.
Algorithm Parameters
Random
Forests
Size of each bag = 100%
Maximum tree depth = Unlimited
Number of iterations = 100
ples to do a type of cross-validation in tandem with
the training process to check the RF algorithm’s pre-
diction ability. Specifically, each tree is generated us-
ing a unique bootstrap sample during the training pro-
cess. Some sequences will be ’left out’ of the sam-
ple, while others will be repeated in the sample, be-
cause bootstrapping involves sampling with replace-
ment from the training data. The OOB sample is
made up of the sequences that were left out. OOB
sequences can be utilized to measure prediction per-
formance because they were not used in tree construc-
tion (Khan et al., 2021).
4 EXPERIMENTS SETUP
The data preprocessing was evaluated using WEKA
1
and Stata V.14 tool kits. WEKA is a JAVA-based data
mining toolkit created at the University of Waikato in
New Zealand. It’s a free software tool distributed un-
der the GNU General Public License. WEKA toolkit
provides a large library of methods and models for
classification, clustering, prediction, attribute selec-
tion, and data display after an investigation. Stata
2
is
a general-purpose statistical software package devel-
oped by StataCorp for data manipulation, visualiza-
tion, statistics, and automated reporting. Stata has al-
ways employed an integrated command-line interface
and can import data in a variety of formats including
ASCII data formats.
For the purposes of the specific experiment, we
developed a regression tree model using a machine
learning algorithm whose parameters are illustrated
in Table 3. The random Forest R package was used
to develop the prediction model. We also used as in-
put the 23 most important attributes according to the
ranking selection method. In addition, we evaluate the
effectiveness of the Random Forest regression tree,
considering mean squared error (RMSE) and mean
absolute error (MAE) (Mohebbi et al., 2020) as per-
formance metrics of the prediction model.
1
https://www.cs.waikato.ac.nz/ml/weka/
2
https://www.stata.com/
HEALTHINF 2022 - 15th International Conference on Health Informatics
252
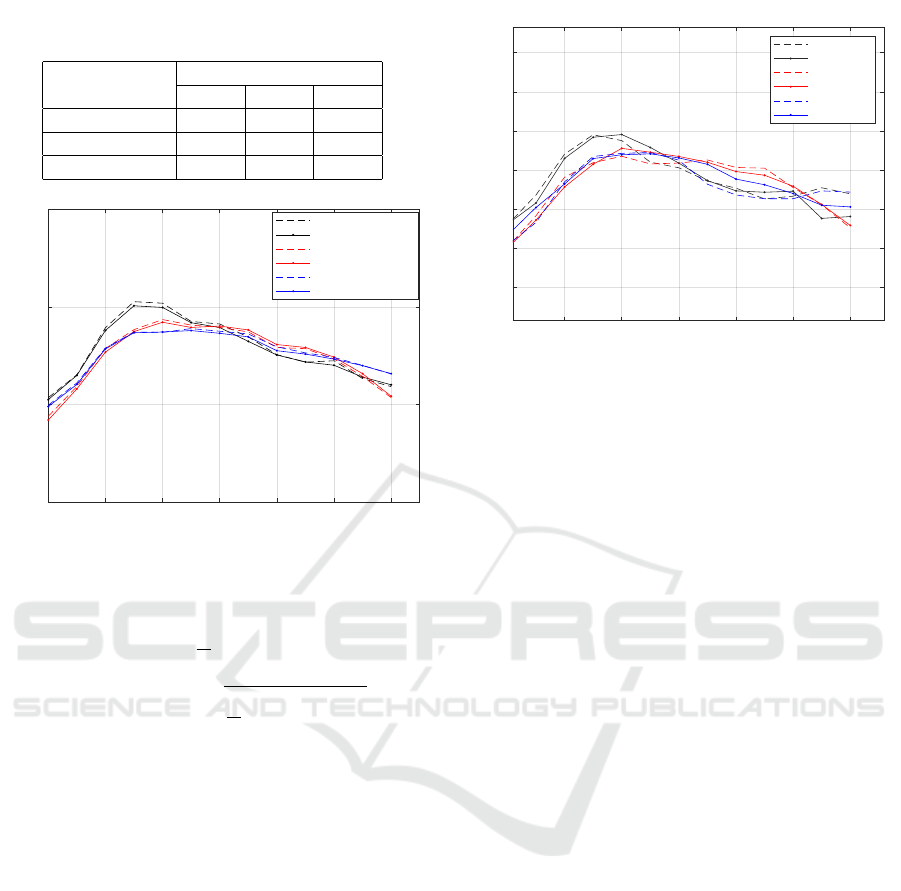
Table 4: Glucose Prediction evaluation under 3 meal-
exercise cases.
Performance Random Forest
Metrics BR BE FE
CC 0.785 0.867 0.709
MAE 1.13 0.901 0.852
RMSE 1.47 1.22 1.07
0 20 40 60 80 100 120
Sampling time-minutes
0
5
10
15
OGTT Values-mmol/L
Average Actual BR
Average Predicted BR
Average Actual BE
Average Predicted BE
Average Actual FE
Average Predicted FE
Figure 2: Avearage OGTT values prediction under 3 meal-
exercise cases.
MAE(g
j
,
b
g
j
) =
1
N
N
∑
i=1
g
i, j
− ˆg
i, j
(2)
RMSE(g
j
,
b
g
j
) =
s
1
N
N
∑
i=1
(g
i, j
− ˆg
i, j
)
2
(3)
Considering the methodology previously de-
scribed in Section 3, the experiments’ settings and
performance evaluators presented here, in the follow-
ing section, we will demonstrate the obtained research
outcomes.
5 RESULTS AND DISCUSSION
Delayed meals and exercise are two factors that in-
crease the risk of hypoglycemias. The investigated
dataset examines the impact of two workout (rest, cy-
cling exercise) and meal (breakfast, fasting) patterns
on glycaemic control based on the OGTT 1h post the
rest/exercise session. It should be emphasised that the
current problem in monitoring glucose supply is the
control of eating habits of the participants, which are
the basis of healthy living — with or without diabetes.
However, for those who have been diagnosed with di-
abetes, it is important to know how food affects their
blood glucose levels.
20 40 60 80 100 120
Sampling time-minutes
2
4
6
8
10
12
14
OGTT Values-mmol/L
Participant 10
Actual-BR
Predicted-BR
Actual-BE
Predicted-BE
Actual-FE
Predicted-FE
Figure 3: Participant 10 OGTT values prediction 3 meal-
exercise cases.
In Table 4, we summarize the machine learning
model performance in terms of three metrics under
three different trials, as discussed above (see Section
2). The curves in Figure 2 depict the average actual
and predicted values by the Random Forest regressor.
These curves were drawn by plotting the time-course
change of glucose concentrations during an OGTT on
a 2-h interval, 0 to 120 minutes, with a sampling rate
of 1 sample per 10 minutes. From the relevant lit-
erature, the shape of the glucose response curve is
monophasic (Kim et al., 2016).
Observing Figure 2, we see higher reductions in
glucose levels combined with 60 min exercise and/or
fasting diet. Also, the improved (lower) glucose con-
centrations at 30 min post-OGTT were associated
with exercise. Figure 3 focuses on a specific partic-
ipant. The glucose pattern of that user follows the
average behaviour.
The main purpose of this analysis is to mon-
itor OGTT glucose to prevent the future develop-
ment or delay the complications of diabetes (Alyass
et al., 2015). The collection and forecasting of OGTT
data will help assess the body’s ability to use glu-
cose, screen diabetes, and make interventions rec-
ommended by primary care groups, such as person-
alized health advice and digital coaching informa-
tion. The intervention may also strengthen the self-
management of those diagnosed with diabetes and
promote healthy habits. Finally, this methodology
will be part of the Artificial Intelligence (AI) services
of the SmartWork and GATEKEEPER architecture
to improve the independence and ability of the older
people where diabetes disease is more prevalent.
Short-term Glucose Prediction based on Oral Glucose Tolerance Test Values
253

6 CONCLUSIONS
In conclusion, our work shows that machine learning
is capable of making a short-term prediction of the
OGTT glucose values. The outcomes of the study
may provide useful support to health care providers
in early detection of diabetes, making more informed
decisions for the prevention of serious consequences
and overall management of diabetes.
A limitation of this research paper is its small sam-
ple of historical OGTT data. Hence, to establish a
more accurate and reliable prediction model follow-
up OGTT data should be considered in the analysis.
As future work, we aim to evaluate the perfor-
mance of more regression models like Support Vector
Machine (SVM) and Neural Networks. Furthermore,
our purpose is to investigate the OGTT data from in-
dividuals diagnosed with either diabetes or IGT. Fi-
nally, it would be challenging to study the usefulness
of machine and/or deep learning on the same prob-
lem on elderly individuals, women with gestational
diabetes (de Wit et al., 2019) and, also emphasize the
shape of the OGTT glucose curves since the shape
has been used as a predictor of treatment outcomes
(Jagannathan et al., 2020).
ACKNOWLEDGEMENTS
This work has been partially supported by the
European Union’s H2020 research and innovation
programme SmartWork under grant agreement No
826343, SC1-DTH-03-2018 - Adaptive smart work-
ing and living environments supporting active and
healthy ageing and GATEKEEPER under grant
agreement No 857223, SC1-FA-DTS-2018-2020 -
Smart living homes-whole interventions demonstra-
tor for people at health and social risks.
REFERENCES
Abdul-Ghani, M., DeFronzo, R. A., Del Prato, S., Chilton,
R., Singh, R., and Ryder, R. E. (2017). Cardiovascular
disease and type 2 diabetes: has the dawn of a new era
arrived? Diabetes care, 40(7):813–820.
Alexiou, S., Dritsas, E., Kocsis, O., Moustakas, K., and
Fakotakis, N. (2021). An approach for personalized
continuous glucose prediction with regression trees.
In 2021 6th South-East Europe Design Automation,
Computer Engineering, Computer Networks and So-
cial Media Conference (SEEDA-CECNSM), pages 1–
6. IEEE.
Altuve, M., Perpi
˜
nan, G., Severeyn, E., and Wong, S.
(2016). Comparing glucose and insulin data from
the two-hour oral glucose tolerance test in metabolic
syndrome subjects and marathon runners. In 2016
38th Annual International Conference of the IEEE En-
gineering in Medicine and Biology Society (EMBC),
pages 5290–5293.
Alyass, A., Almgren, P., Akerlund, M., Dushoff, J., Isomaa,
B., Nilsson, P., Tuomi, T., Lyssenko, V., Groop, L.,
and Meyre, D. (2015). Modelling of ogtt curve iden-
tifies 1 h plasma glucose level as a strong predictor of
incident type 2 diabetes: results from two prospective
cohorts. Diabetologia, 58(1):87–97.
Baranowska-Jurkun, A., Matuszewski, W., and Bandurska-
Stankiewicz, E. (2020). Chronic microvascular com-
plications in prediabetic states—an overview. Journal
of Clinical Medicine, 9(10):3289.
Bide, P. and Padalkar, A. (2020). Survey on diabetes mel-
litus and incorporation of big data, machine learning
and iot to mitigate it. In 2020 6th International Con-
ference on Advanced Computing and Communication
Systems (ICACCS), pages 1–10.
Charoentong, P., Naiyanetr, P., and Neatpisanvanit, C.
(2004). Effects of body mass on ogtt-derived insulin
sensitivity indexes in healthy subjects. In 2004 IEEE
Region 10 Conference TENCON 2004., volume B,
pages 446–449 Vol. 2.
de Wit, L., Bos, D., van Rossum, A., van Rijn, B., and
Boers, K. (2019). Repeated oral glucose tolerance
tests in women at risk for gestational diabetes melli-
tus. European Journal of Obstetrics & Gynecology
and Reproductive Biology, 242:79–85.
Denil, M., Matheson, D., and De Freitas, N. (2014). Nar-
rowing the gap: Random forests in theory and in prac-
tice. In International conference on machine learning,
pages 665–673. PMLR.
Edinburgh, R. M., Hengist, A., Smith, H. A., Travers,
R. L., Koumanov, F., Betts, J. A., Thompson,
D., Walhin, J.-P., Wallis, G. A., Hamilton, D. L.,
et al. (2018). Preexercise breakfast ingestion ver-
sus extended overnight fasting increases postpran-
dial glucose flux after exercise in healthy men.
American Journal of Physiology-Endocrinology and
Metabolism, 315(5):E1062–E1074.
Fazakis, N., Kocsis, O., Dritsas, E., Alexiou, S., Fakotakis,
N., and Moustakas, K. (2021). Machine learning tools
for long-term type 2 diabetes risk prediction. IEEE
Access, 9:103737–103757.
Fiorentino, T. V., Marini, M. A., Andreozzi, F., Arturi,
F., Succurro, E., Perticone, M., Sciacqua, A., Hribal,
M. L., Perticone, F., and Sesti, G. (2015). One-
hour postload hyperglycemia is a stronger predic-
tor of type 2 diabetes than impaired fasting glucose.
The Journal of Clinical Endocrinology & Metabolism,
100(10):3744–3751.
Islam, M. S., Belhaouari, S. B., Abdul-Ghani, M., and
Qaraqe, M. K. (2021). Data mining techniques for
prediction of type 2 diabetes leading to cardiovascular
disease. In 2021 IEEE 7th World Forum on Internet of
Things (WF-IoT), pages 321–325.
Jagannathan, R., Neves, J. S., Dorcely, B., Chung, S. T.,
Tamura, K., Rhee, M., and Bergman, M. (2020). The
oral glucose tolerance test: 100 years later. Diabetes,
HEALTHINF 2022 - 15th International Conference on Health Informatics
254

Metabolic Syndrome and Obesity: Targets and Ther-
apy, 13:3787.
Kakoly, N. S., Earnest, A., Teede, H. J., Moran, L. J., and
Joham, A. E. (2019). The impact of obesity on the
incidence of type 2 diabetes among women with poly-
cystic ovary syndrome. Diabetes Care, 42(4):560–
567.
Kerner, W. and Br
¨
uckel, J. (2014). Definition, classification
and diagnosis of diabetes mellitus. Diabetologie und
Stoffwechsel, 122:384–6.
Khan, Z., Gul, N., Faiz, N., Gul, A., Adler, W., and Lausen,
B. (2021). Optimal trees selection for classification
via out-of-bag assessment and sub-bagging. IEEE Ac-
cess, 9:28591–28607.
Kim, J. Y., Michaliszyn, S. F., Nasr, A., Lee, S., Tfayli, H.,
Hannon, T., Hughan, K. S., Bacha, F., and Arslanian,
S. (2016). The shape of the glucose response curve
during an oral glucose tolerance test heralds biomark-
ers of type 2 diabetes risk in obese youth. Diabetes
care, 39(8):1431–1439.
Knowler, W., Fowler, S., Hamman, R., Christophi, C., Hoff-
man, H., Brenneman, A., Brown-Friday, J., Gold-
berg, R., Venditti, E., and Nathan, D. (2009). 10-year
follow-up of diabetes incidence and weight loss in the
diabetes prevention program outcomes study. Lancet,
374:1677–86.
Maeta, K., Nishiyama, Y., Fujibayashi, K., Gunji, T.,
Sasabe, N., Iijima, K., and Naito, T. (2018). Predic-
tion of glucose metabolism disorder risk using a ma-
chine learning algorithm: pilot study. JMIR diabetes,
3(4):e10212.
Mohebbi, A., Johansen, A. R., Hansen, N., Christensen,
P. E., Tarp, J. M., Jensen, M. L., Bengtsson, H.,
and Mørup, M. (2020). Short term blood glucose
prediction based on continuous glucose monitoring
data. In 2020 42nd Annual International Conference
of the IEEE Engineering in Medicine & Biology Soci-
ety (EMBC), pages 5140–5145. IEEE.
Mukaka, M. M. (2012). A guide to appropriate use of corre-
lation coefficient in medical research. Malawi medical
journal, 24(3):69–71.
Refat, M. A. R., Amin, M. A., Kaushal, C., Yeasmin, M. N.,
and Islam, M. K. (2021). A comparative analysis of
early stage diabetes prediction using machine learn-
ing and deep learning approach. In 2021 6th Interna-
tional Conference on Signal Processing, Computing
and Control (ISPCC), pages 654–659.
Rong, L., Luo, N., Gong, Y., Tian, H., Sun, B., and Li, C.
(2021). One-hour plasma glucose concentration can
identify elderly chinese male subjects at high risk for
future type 2 diabetes mellitus: A 20-year retrospec-
tive and prospective study. Diabetes Research and
Clinical Practice, 173:108683.
World-Health-Organization (1999). Definition, diagnosis
and classification of diabetes mellitus and its compli-
cations : report of a who consultation. part 1, diagno-
sis and classification of diabetes mellitus.
Ye, Y., Xiong, Y., Zhou, Q., Wu, J., Li, X., and Xiao, X.
(2020). Comparison of machine learning methods and
conventional logistic regressions for predicting gesta-
tional diabetes using routine clinical data: a retrospec-
tive cohort study. Journal of diabetes research, 2020.
Short-term Glucose Prediction based on Oral Glucose Tolerance Test Values
255
