Event Data Downscaling for Embedded Computer Vision
Am
´
elie Gruel
1 a
, Jean Martinet
1 b
, Teresa Serrano-Gotarredona
2 c
and Bernab
´
e Linares-Barranco
2 d
1
Universit
´
e C
ˆ
ote d’Azur, CNRS, I3S, France
2
Instituto de Microelectr
´
onica de Sevilla IMSE-CNM, Sevilla, Spain
Keywords:
Event Cameras, Computer Vision, Data Reduction, Preprocessing, Visualisation.
Abstract:
Event cameras (or silicon retinas) represent a new kind of sensor that measure pixel-wise changes in brightness
and output asynchronous events accordingly. This novel technology allows for a sparse and energy-efficient
recording and storage of visual information. While this type of data is sparse by definition, the event flow
can be very high, up to 25M events per second, which requires significant processing resources to handle and
therefore impedes embedded applications. Neuromorphic computer vision and event sensor based applications
are receiving an increasing interest from the computer vision community (classification, detection, tracking,
segmentation, etc.), especially for robotics or autonomous driving scenarios. Downscaling event data is an
important feature in a system, especially if embedded, so as to be able to adjust the complexity of data to
the available resources such as processing capability and power consumption. To the best of our knowledge,
this works is the first attempt to formalize event data downscaling. In order to study the impact of spatial
resolution downscaling, we compare several features of the resulting data, such as the total number of events,
event density, information entropy, computation time and optical consistency as assessment criteria. Our code
is available online at https://github.com/amygruel/EvVisu.
1 INTRODUCTION
Event-based camera are slowly but surely integrating
many embedded systems, such as autonomous vehi-
cles and other robotic applications. However, this
novel type of asynchronous data comes with a heavy
flow of information which can be too much to han-
dle and not always relevant for the task at hand. In
order to optimize the information carried by events,
we believe that it is necessary to formalize the dif-
ferent methods for event data spatial downscaling, as
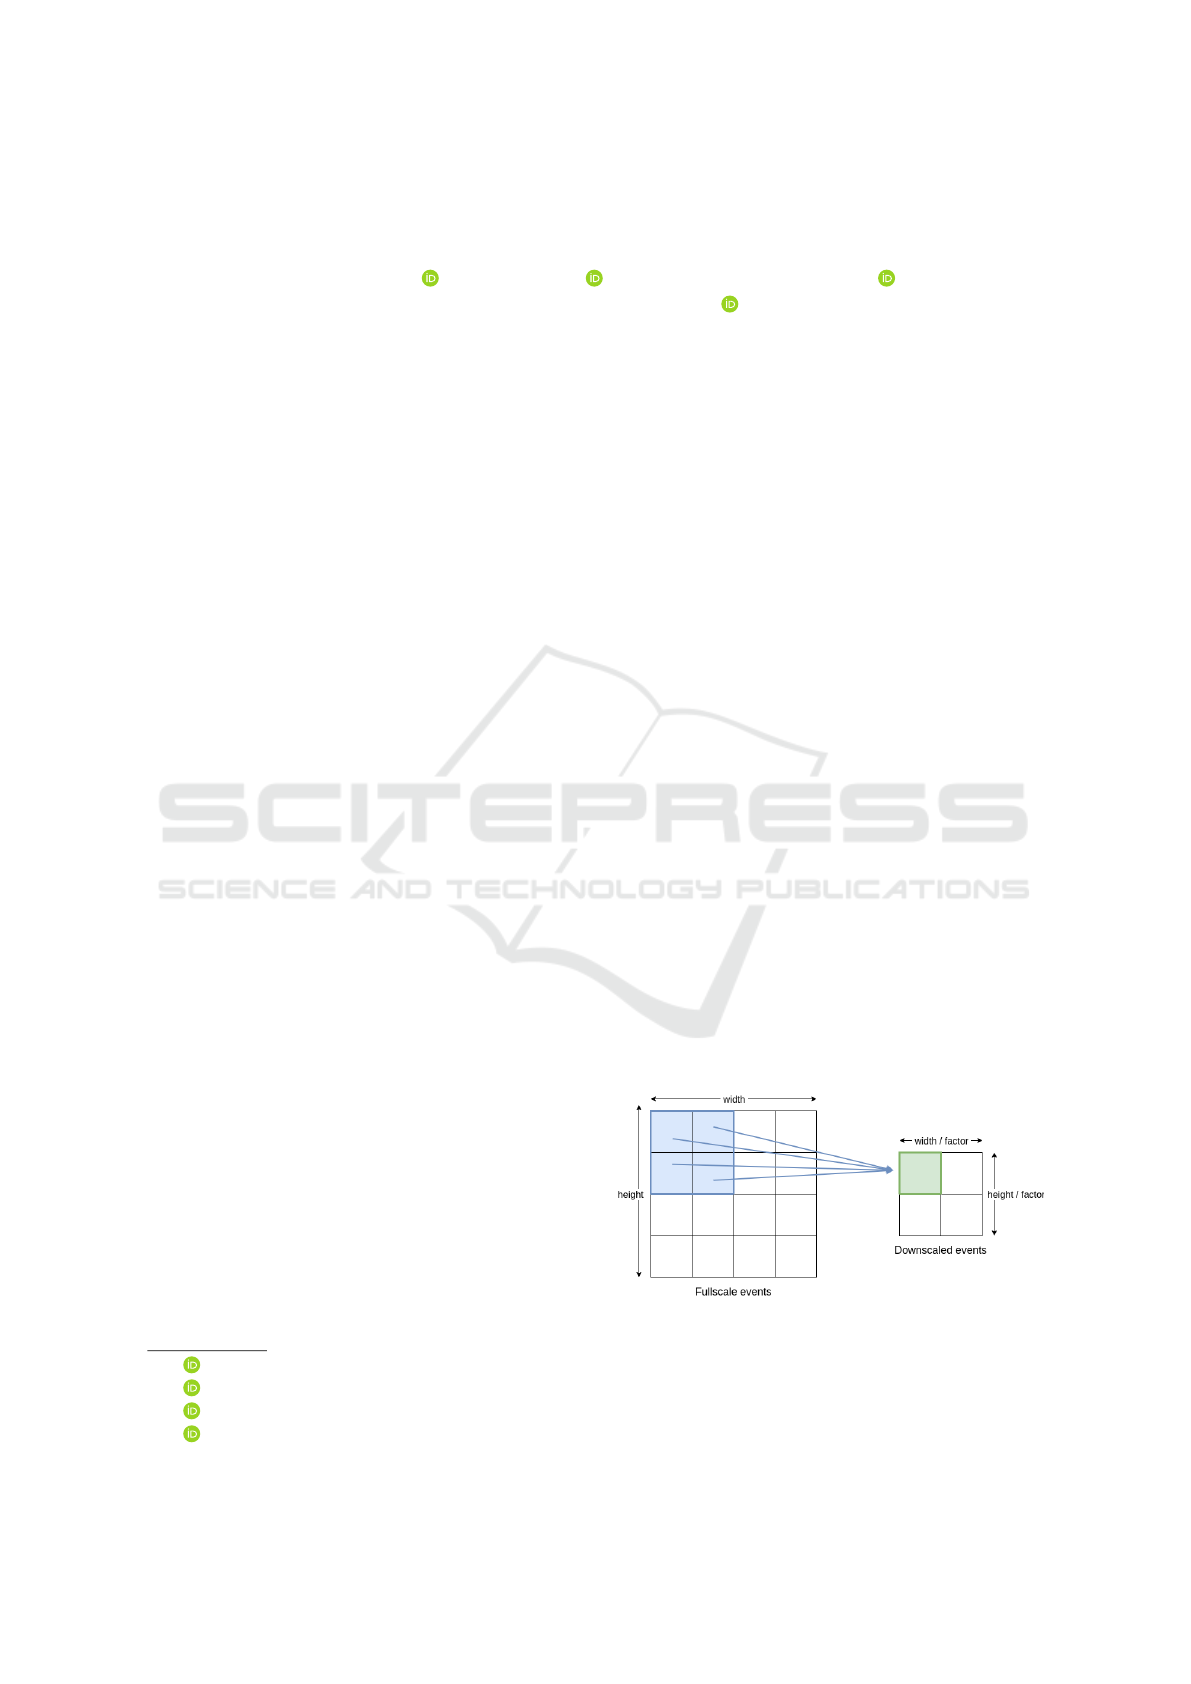
defined in Fig 1.
1.1 Event Cameras
The idea of a novel bio-inspired event-based sen-
sor, akin to a ”silicon retina” (Mahowald and Mead,
1991), has been developed since the 1990s. In bio-
inspired retinas, the transmitted information is coded
as spikes. Pixels emit spikes whenever relevant infor-
a
https://orcid.org/0000-0003-3916-0514
b
https://orcid.org/0000-0001-8821-5556
c
https://orcid.org/0000-0001-5714-2526
d
https://orcid.org/0000-0002-1813-4889
mation is captured in the visual field. Retinas con-
verting luminance to spike frequency, spatial con-
trast retinas as well as retinas implementing some
spatio-temporal filtering have been proposed. In
2008, Lichtsteiner, Posch and Delbruck presented the
first complete design of a Dynamic Vision Sensor
(DVS) (Lichtsteiner et al., 2008) responding only to
temporal brightness change in a scene with no con-
sideration for colours, similar to the organic retina.
Figure 1: A set of fullscale events captured by a sensor of
size width × height is downscaled according to a downscal-
ing factor f actor, set to 2 in this example. Here, all the
events of the original sample occurring in the blue area’s
pixels will correspond to the events occurring in the red
pixel after reduction.
Gruel, A., Martinet, J., Serrano-Gotarredona, T. and Linares-Barranco, B.
Event Data Downscaling for Embedded Computer Vision.
DOI: 10.5220/0010991900003124
In Proceedings of the 17th International Joint Conference on Computer Vision, Imaging and Computer Graphics Theory and Applications (VISIGRAPP 2022) - Volume 4: VISAPP, pages
245-253
ISBN: 978-989-758-555-5; ISSN: 2184-4321
Copyright
c
2022 by SCITEPRESS – Science and Technology Publications, Lda. All rights reserved
245
The main advantages of such an artificial retina
are (Gallego et al., 2020):
• the high temporal resolution, thanks to which an
event can be emitted on the timescale of microsec-
onds and avoiding motion blur,
• the high dynamic range, which makes it possible
to use them for extremely dim as well as under
bright sun illumination,
• the high contrast range which allows for highly
contrasted images avoiding dazzling effect caused
by sudden illumination changes, thus scenes with
illumination expanding over 120dB can be sensed
without suffering saturation,
• the low latency and asynchronicity enabled by the
independence between each pixel,
• the absence of redundancy in the information
transmitted, as compared to frame-based sensors,
• the low power consumption, following the model
of biological retinas and substituting the biologi-
cal photoreceptors by photodiodes in the electrical
circuits.
Figure 2: Block diagram of an event camera pixel.
Fig. 2 shows the conceptual schematic of an event
camera pixel. A photosensor produces a current I
ph
proportional to the illumination. A transimpedance
logarithmic circuitry converts the detected current
into a voltage V
log
= A
T
log(I
ph
) which depends log-
arithmically on the photocurrent. This voltage is the
input to a differencing capacitive amplifier, so that the
voltage difference
∆V
di f f
= −C
1
/C
2
∆V
log
= −C
1
/C
2
A
T
∆I
ph
/I
ph
(1)
That way voltage V
di f f
is proportional to the relative
temporal variation of the photocurrent. Voltage V
di f f
is compared with an upper and a lower voltage thresh-
olds. Each time it goes over the upper (or below the
lower) threshold, the pixel will generate an output ON
(or OFF) event and voltage V
di f f
is reset to a resting
value V
R
.
Fig. 3 illustrates the resulting behavior of the event
camera pixel. The upper subfigure plots the variation
of a pixel photocurrent along time, while the lower
subfigure illustrates the generated ON and OFF out-
put events. As can be observed, each time the pho-
tocurrent increases (or decreases) by a certain relative
variation given by,
∆I
ph
/I
ph
= C
2
(V
t
−V
R
)/(C
1
A
T
) (2)
the pixel generates an ON (OFF) output event.
Figure 3: Illustration of event-based encoding of visual
signals with respect to the predefined threshold ∆I, from
(Lagorce et al., 2015). The luminance captured by the sen-
sor varies over time, and an event is only produced when
its log intersects with lines of equation y = ∆I. The corre-
sponding event is positive when the log-luminance’s slop is
positive at the intersection, and negative otherwise. The in-
terval between each t
i
and t
i+1
is not monotonous, which is
consistent with the event data asynchronicity.
The event cameras’ particularities described
above grant them advantages in many application
cases compared to more traditional visual sensors
(Gallego et al., 2020). A significant field of appli-
cations is robotics: autonomous vehicles, drones and
other embedded systems requiring low latency and
low power data handling. Furthermore, they evolve in
uncontrolled lightning conditions thus require a high
dynamic range and high contrast range.
Because of their operating mode, event based
cameras are useful in tasks featuring movements, such
as object tracking (Glover and Bartolozzi, 2016), ges-
ture recognition (Amir et al., 2017), optical flow
estimation (Orchard et al., 2013; Paredes-Valles
et al., 2020), Simultaneous Localization and Mapping
(SLAM) (Kim et al., 2016; Vidal et al., 2018), etc.
Their high resolution and contrast range also valuable
for astronomical studies (Cohen et al., 2017; Chin
et al., 2019). Research on their combined use with
traditional RGB camera becomes more common, with
applications on high-resolution image reconstruction
(Zhang et al., 2021b; Rebecq et al., 2021) and video
deblurring (Zhang et al., 2021a).
VISAPP 2022 - 17th International Conference on Computer Vision Theory and Applications
246

1.2 Motivations
While desktop event vision solutions can afford large
amount of computing resources, embedded applica-
tion typically face limitations in CPU, memory, and
energy usage. Event data is sparse, and yet in some
highly dynamic and textured scenes, the event flow
can be very high, up to 25M event per second, which
requires significant processing resources to handle.
Most existing event vision approaches preprocess
event data by simply downscaling the pixel coordi-
nates, which is actually a max-pooling operation in
the event domain. One obvious issue of this sim-
ple event funnelling is that the resulting event density
drastically increases in the reduced spatial dimension,
causing an important information loss.
In embedded systems, only relevant information
should be stored and processed under the form of
downscaled event data. For example, event-based
odometry applied to robotics requires only movement
information in order to process the information in real
time: this need is typically answered by pooling the
events in frames (Rebecq et al., 2017), resulting in the
loss of the data’s asynchronicity.
In neuromorphic machine learning, spiking neu-
ral networks usually can’t handle the flow of informa-
tion the event data represents and downscale this input
by a first preprocessing layer, before actually learning
anything.
We can also mention the residual graph convolu-
tionnal techniques which handles each input event as
a node in the graph (Bi et al., 2019): this leads to a
low computational efficiency and a substantial simu-
lation run, which can be improved solely by spatially
reducing the input neuromorphic data.
The aforementioned examples are just a few rea-
sons why event downscaling is a real challenge in
neuromorphic computer vision and needs to be for-
malized.
The contributions of this paper are twofold: we
design and implement a number of methods to reduce
the size of event data and we assess the proposed re-
duction methods by analysing reduced data and also
based on the classification results.
The remainder of the paper is organized as fol-
lows: firstly an introduction to event-based cameras
and the motivations behind this work, then a review
of previous use of event data, followed by a com-
plete description of the 6 spatial downscaling meth-
ods implemented in this work, and finally a a compar-
ison summarising the advantages and disadvantages
of each method.
2 RELATED WORK
Reducing the size of visual data is straightforward for
grayscale and RGB images with interpolation. When
it comes to event data, size reduction is much less triv-
ial. And yet, many papers discussing neuromorphic
computer vision are faced with a substantial event
flow, sometimes too great to perform the task at hand.
In those case, the authors address this issue with vari-
ous techniques presented bellow.
A first solution simply consists in creating event
frames, then processing this data as standard visual
images, as seen in (Fang et al., 2021) and (Huang,
2021). This enables the same model to be applied to
any king of visual data, neuromorphic or not. How-
ever its main drawback is that all the data’s asyn-
chronicity, which is a real advantage of event data,
is disregarded; all events are gathered and their times-
tamps discretised.
Spiking neural networks handling event data can
consider each pixel as an input neuron, and each event
produced as an input spike to the neural model. How-
ever this first layer is often too important for effi-
cient computation, thus most authors applying this
type of neuromorphic computing on event data re-
solve to convolve the input. For example, (Cordone
et al., 2021) apply multiple convolution layers to the
dataset DVS128 Gesture before processing it.
The non uniform sampling employed by (Bi
et al., 2019) can also be mentioned, although it only
produces satisfying results on a sparse dataset with
well-defined empty areas like the one they use. This
simply amounts to implement a non-uniform grid
sampling inspired from traditional data processing to
event data.
To the best of our knowledge, the only existing
tool for event data downscaling is Tonic’s ”Downsam-
ple” method (Lenz et al., 2021). Tonic is a Python
library for neuromorphic data handling, which has
been created on an original idea dating back from
the 2019 Telluride neuromorphic workshop. It facili-
tates dataset downloads and its conversion to different
event representations (frames, time surfaces, voxel
grids, etc). It also proposes event transformation, such
as denoising, event dropping, polarities merging, spa-
tial and temporal jittering and downsampling.
The ”Downsample” method simply multiplies the
event coordinates by a spatial factor without dropping
any event. It can also be applied to temporal down-
sampling following the same mechanism. Although
it is extremely fast, it has the major flaw of keeping
all the original events thus leading to an increasingly
high density in the produced visual data.
Event Data Downscaling for Embedded Computer Vision
247
3 PROPOSED METHODS
The following subsections present the 7 methods con-
sidered in this work to downscale spatially the data
produced by an event camera. Each method takes
as input a sample of events at maximum resolution
as well as the factor by which to reduce this sam-
ple, and returns the downscaled events as illustrated in
Fig. 1. Depending on the downscaling method used,
the number and frequency of the downscaled events
will not necessarily equal those of the events occur-
ring in the corresponding fullscale regions.
3.1 Simple Event Funnelling
A first solution to reduce event data simply is to divide
each event’s coordinates in x and y by the downscal-
ing factor, then remove all the reduced events dupli-
cates (i.e., keep only one occurrence of each event for
a specific set of coordinates (x,y,t, p) – see Fig. 4).
This method follows the same logic as Tonic’s down-
scaling approach and can also be extended to temporal
reduction.
Thanks to its quickness and simplicity, this solu-
tion could answer the need for downscaling events in
real time on embedded systems. However, the main
drawback is that this process does not drop any event.
The reduced area undergoes a high density of events,
yielding an information loss due to the accumulation
of pixel activation (see Fig. 4). Event funnelling tends
to drastically increase pixel activity (see Fig. 4), espe-
cially when the downscale factor is large. In the ex-
treme yet unlikely case where the data is downscaled
to a 1 × 1 size, the resulting pixel is likely to be con-
stantly active.
Finally, the behavior does not correlate with the
physical mechanism of an actual event camera: the
optical consistency is very low for this method.
3.2 Log-luminance Reconstruction
From an optical point of view, downscaling the spatial
size of an event recording boils down to averaging the
luminance captured by a subset of pixels in the orig-
inal sensor. In a physical implementation of an event
camera formed by a 2D array of pixels as the one
shown in Fig. 2, this method could be implemented by
averaging the photocurrents I
ph
generated by neigh-
bor pixels and performing the transimpedance loga-
rithmic conversion and posterior voltage amplifica-
tion and differentiations as explained in Section. In-
troduction. In order to implement this behavior, the
log-luminance is reconstructed for each pixel in the
fullscale dataset: each event occurring on the same
pixel increases (if positive) or decreases (if negative)
the log-luminance level by one unit. The mean log-
luminance is then computed for each region of size
f actor
2
in the sensor. Lastly, the downscaled events
are generated: an event occurs at every timestep
where the average log-luminance crosses a threshold
line; the event is positive if the gradient is positive,
and vice-versa.
To achieve a pixel’s log-luminance reconstruction,
all events from this pixel is translated into points of
coordinates (x show the timestamps, y is the level
reached) where the initial level is arbitrarily set to 0
and contrast threshold set to 1 (see Fig. 3).
3.2.1 Event Count
A first approach to log-luminance reconstruction con-
sists in estimating the mean log-luminance reached by
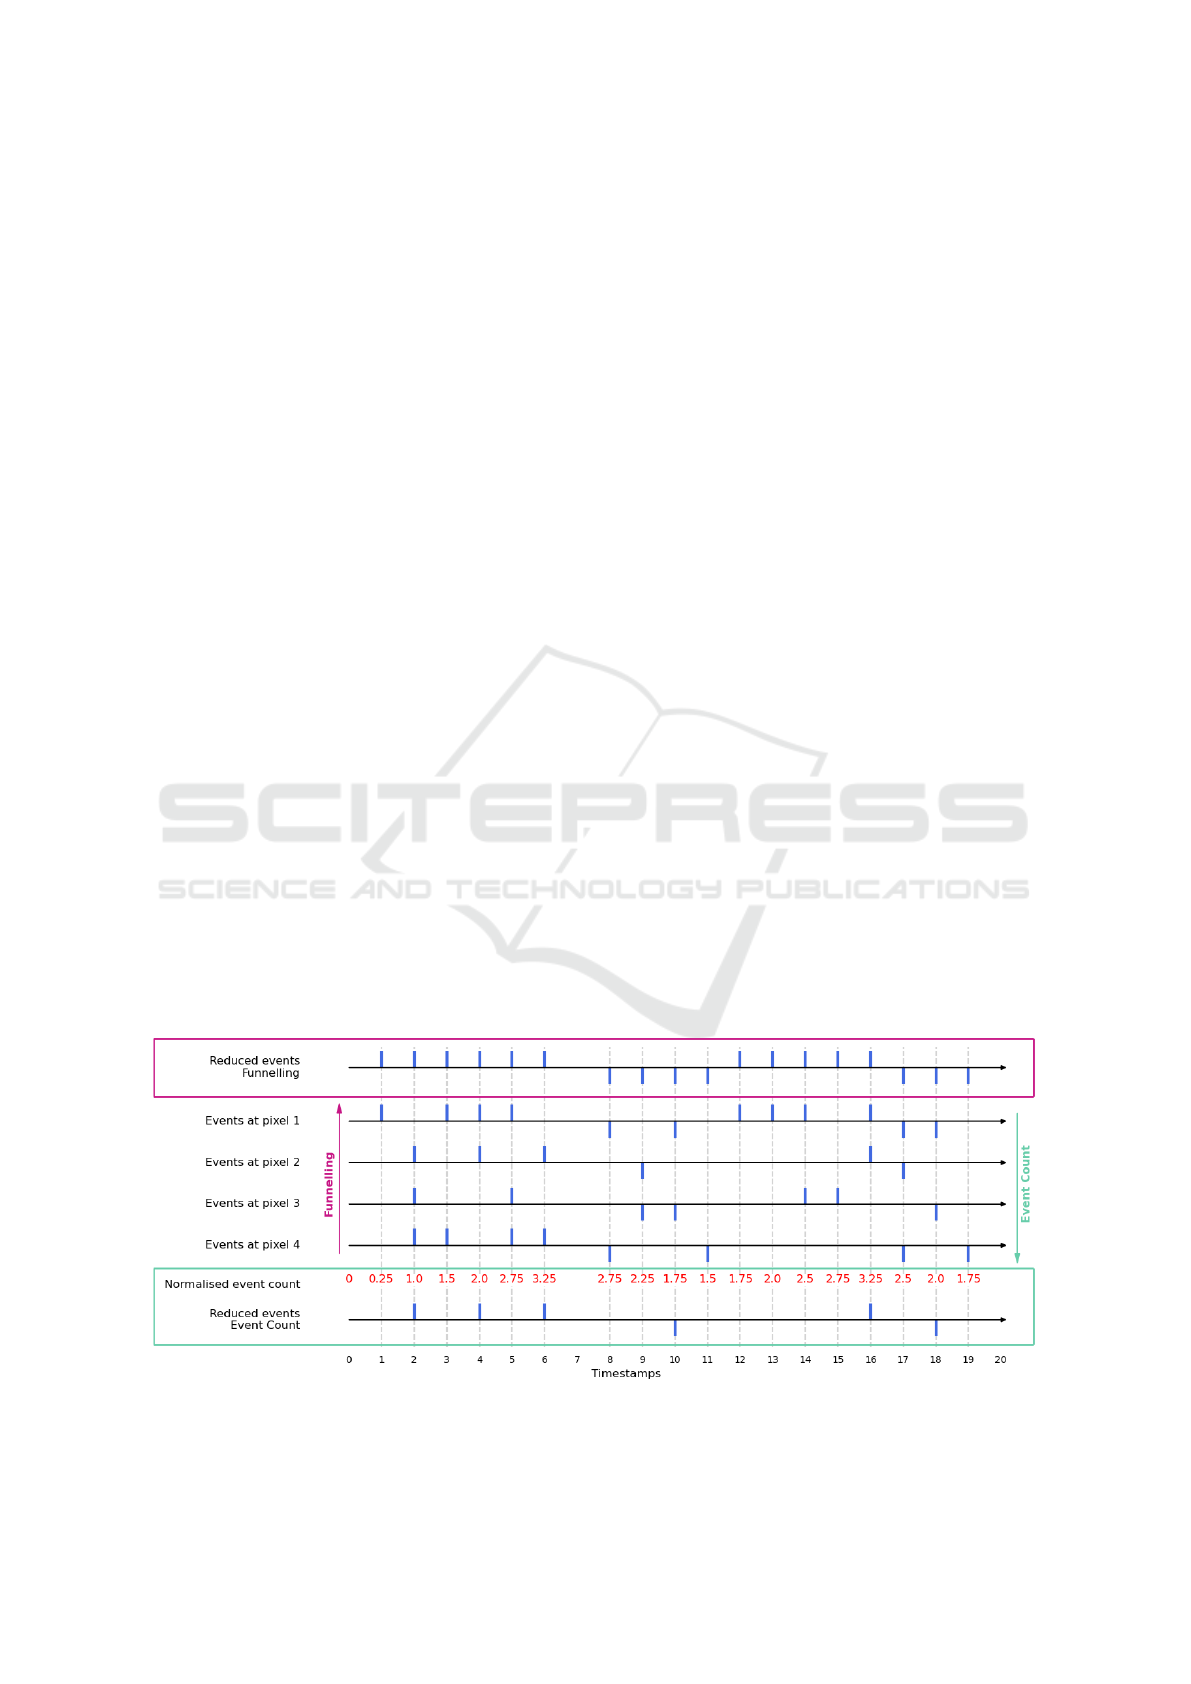
Figure 4: Schematic illustration for event funnelling and event counts methods. A sensor of size 2 × 2 outputs negative
and positive at each pixel across time, which are downscaled using Simple Event Funnelling (red frame on top) and Log-
Luminance Event count (green frame at the bottom). In this example, the downscaling factor is set to 2.
VISAPP 2022 - 17th International Conference on Computer Vision Theory and Applications
248
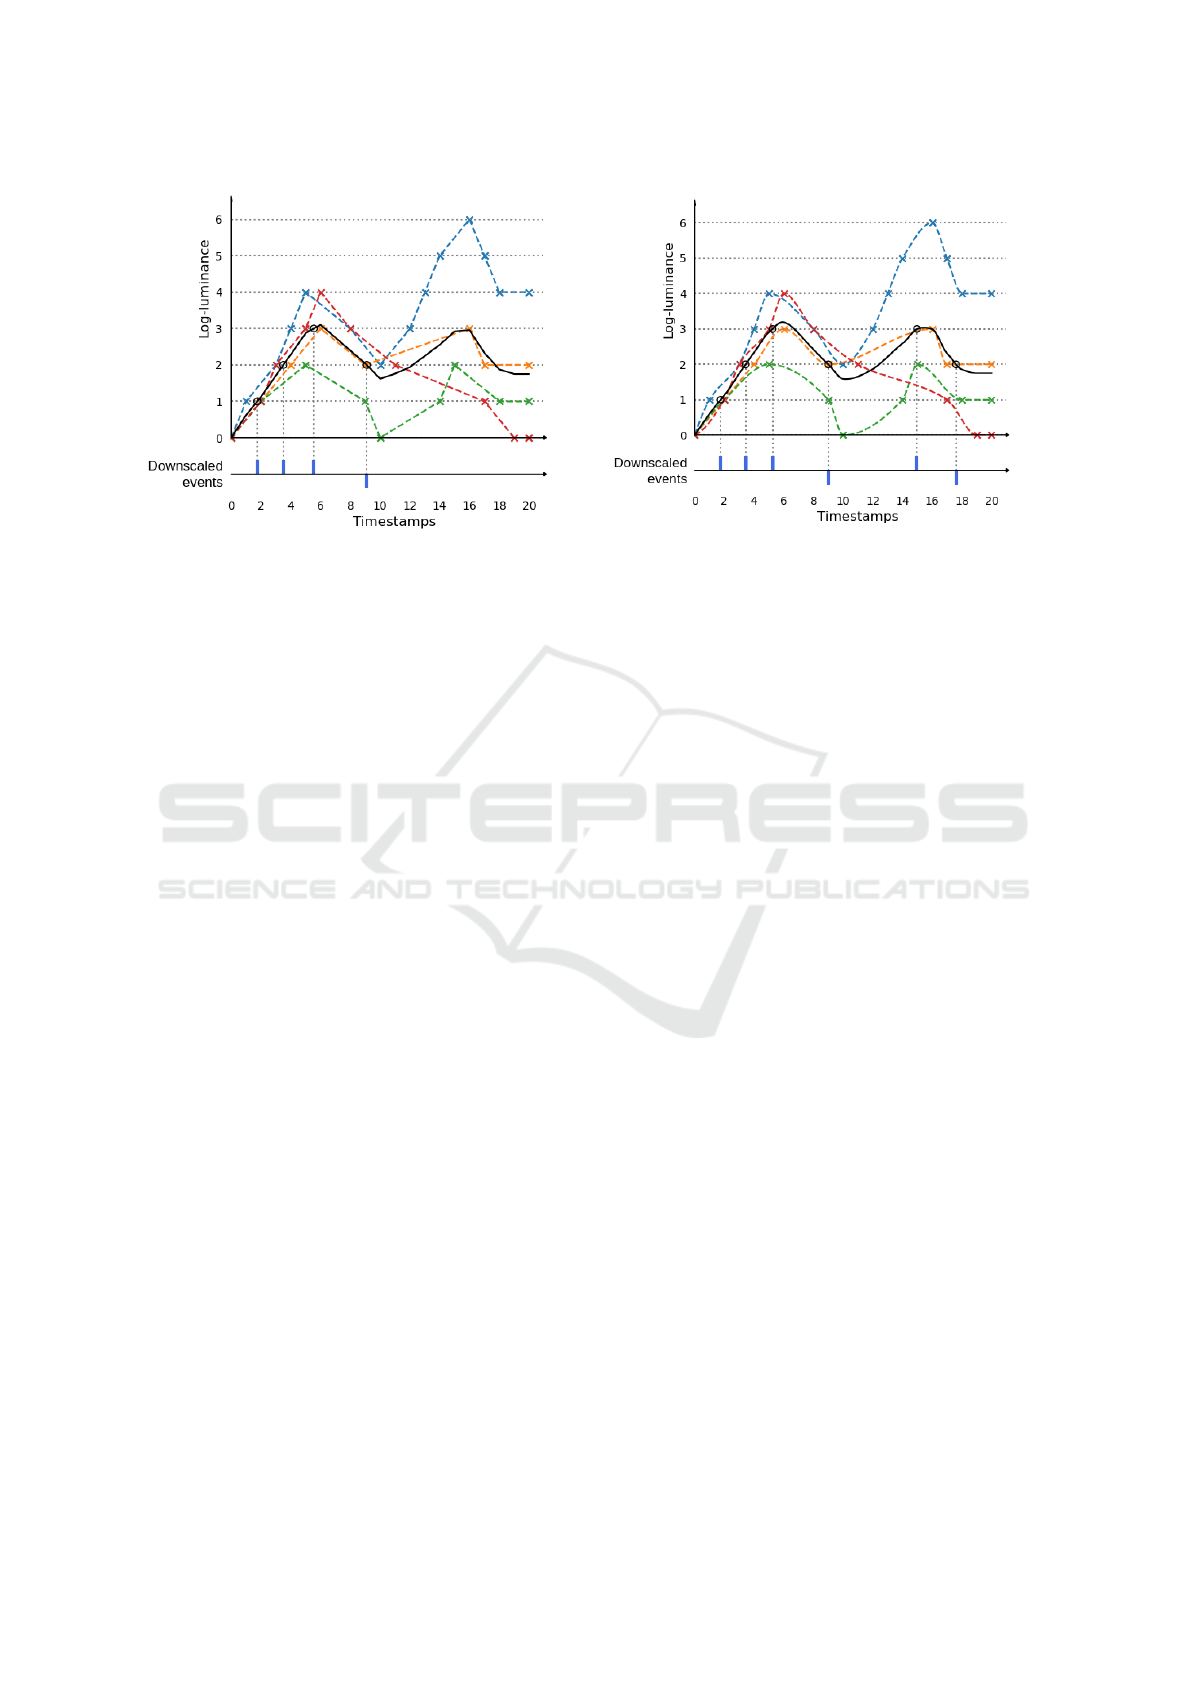
(a)
(b)
Figure 5: Schematic illustration for log-luminance reconstruction. A sensor of size 2× 2 outputs negative and positive at each
pixel across time, which are downscaled using log-luminance reconstruction with linear (a) and cubic (b) interpolation. In
this example, the downscaling factor is set to 2.
a downscaled pixel every time an event occurs in the
corresponding fullscale region - in other words, re-
alise a normalised event count in the fullscale region
as presented in Fig. 4. If its value crosses a contrast
threshold, an event is produced; an additional value
keeps track of the slope, in order to set this event’s
polarity depending on the slope. It is also necessary
to handle the constraint posed by the fact that an event
is only produced if the entire threshold has been cov-
ered since the last event. The slope value allows to
answer this by identifying the extrema, thus prevent-
ing events to occur when the log-luminance crosses a
threshold directly following an extremum.
This approach’s main disadvantage is the loss of
neuromorphic asynchronicity. A reduced event can
only occur at the timesteps where a fullscale event
took place, which wouldn’t be the case with actual
log-luminance reconstruction, as depicted in the fol-
lowing paragraphs. This drawback is also an asset:
this reduction method can easily downscale events as
they are being recorded, and its algorithm simplicity
is a plus for an embedded system.
3.2.2 Linear Estimation
The second approach is to actually reconstruct the
log-luminance curve as a polyline, where each event
in the log-luminance graph is linked to its neighbors
in time by a line as presented in Fig. 5a. This allows
for a quick computation and interpolation of the inter-
sections between the thresholds and the curve. How-
ever, it is not as faithful to the physical reality as we
would like it to be.
3.2.3 Cubic Estimation
In this final approach, the log-luminance of each neu-
ron is interpolated as a cubic curve strictly running
through the events on the log-luminance graph as seen
in Fig. 5b. The cubic interpolation was implemented
using Scipy’s method PChipInterpolator, an imple-
mentation of the Piecewise Cubic Hermite Interpo-
lating Polynomial. This algorithm is a third-degree
piecewise polynomial function which seeks to match
the derivatives of each point with its neighbors. Thus
its extrema coincide with the data’s extrema, which is
not the case of all cubic interpolation algorithm who
tend to greatly overshoot (Rabbath and Corriveau,
2019). As similar tools, this cubic interpolator I takes
as input a set of values (x, y,x
0
) and returns the y
0
data
interpolated for all x
0
values with respect to the rela-
tion between y and x:
I(x,y,x
0
) = y
0
with x
0
=
x
max
//threshold
∑
x=x
min
//threshold+threshold
(x)
(3)
In our case, the coordinates are those of the events
in the corresponding log-luminance graph: the x-axis
correspond to the events’ log-luminance and the
ordinates to the timestamps. From a set of known
log-luminance levels x
0
, the cubic interpolation
outputs the timestamps y
0
where the events’ log-
luminance crosses those levels.
This approach reconstructs a curve close to an ac-
tual log-luminance curve recorded by an event cam-
era, granting a high score of optical consistency to
Event Data Downscaling for Embedded Computer Vision
249
this approach. However, the existing tools allow-
ing the cubic interpolation of y values according to
a set of x parameters requires the x set to be strictly
monotonous, without any duplicates. The first hin-
der can be removed by splitting the (x,y) dataset pre-
sented in Eq. 3 at the different log-luminance’s ex-
trema:
S
i
(x,y) =
n
ext
∑
i=0
t
y
ext
i+1
∑
t=t
y
ext
i
(x
t
,y
t
) (4)
with S
i
the i
th
subset of the events comprised between
two extrema, n
ext
the total number of extrema in the
dataset i.e. the number of segments S
i
, and t
y
ext
i
and
t
y
ext
i+1
respectively the timestamps of the i
th
and (i +
1)
th
extrema.
The second hinder mentioned above is more com-
plex to avoid: although it is a rare occurrence, mul-
tiple events still happen at the same coordinates and
in the same timestamps with a frequency of X. This
requires us to only keep one specimen of duplicates,
thus lightly skewing the data processing.
Furthermore, it shares one disadvantage with the
linear estimation approach: both those approach can-
not be computed strictly in real time since they need
to know the future behavior of the curve, that is to say
the next events that will occur on the monitored pixel.
We can work around this problem by inserting a slight
delay between the data recording and processing.
3.3 Events to Video to Events
Since it is possible to reconstruct a grayscale video
from an event stream, a last simple technique
would be to use existing downscaling methods on a
grayscale reconstruction of the event data, then trans-
late this reduced image back into events. This is
equivalent to reconstructing a downscaled luminance
and computing downscaled events from it, but it has
some important drawbacks. The main one lies in
the total loss of event data’s asynchronicity since the
grayscale video produced from the neuromorphic data
is built from the pooling of information into frames.
Moreover, its implementation in practice is com-
putationally heavy, which is not suited for embed-
ded applications. Lastly, this method needs two sets
of grayscale data to be created during the process
(fullscale from events, then downscale) leading to
high memory consumption, while embedded systems
are limited in data storage.
A pipeline implementing such a downscaling pro-
cess is the following:
1. translate the event data into grayscale frames
thanks to Events-to-Video library introduced in
(Rebecq et al., 2019). This module actually
consists in a machine learning model trained on
a set of datasets comprising neuromorphic and
grayscale recordings of the same scenes.
2. rescale the grayscale frames thus obtained with
one of the many existing image processing tools.
3. finally translate the downscaled grayscale frames
into events by using the library Video-to-Events
from (Gehrig et al., 2020). This library recon-
structs the log-luminance variations between each
grayscale frame, then outputs the corresponding
events according to user-defined negative and pos-
itive contrast thresholds.
This pipeline requires the event dataset to be
downscaled either to be one of the datasets the Events-
to-Video model has been trained on, or to contain a
set of grayscale frames recorded simultaneously as
the neuromorphic data. Since this method is very ar-
guable considering the motivations for event down-
scaling, it was not implemented to be compared in
this paper. Note that the dataset used in our experi-
ments (see Section Datasets) does not meet either of
these two criteria.
4 EXPERIMENTS
4.1 Datasets
The different methods of reduction where applied
to the neuromorphic dataset DVS128 Gesture widely
used as a benchmark in event data processing, and we
assessed the results according to the criteria described
in the following sections.
Figure 6: Events grouped in a frame from a sample of the
gesture ”left hand clockwise” (class 7) of the DVS128 Ges-
ture dataset. Positive events are depicted in green, negative
in blue.
VISAPP 2022 - 17th International Conference on Computer Vision Theory and Applications
250

Table 1: Features of the original DVS128 Gesture dataset, and of the 5 downscaling methods described in Section 3.
Methods Number of Temporal Information Computation Optical
events density entropy time consistency
Original fullscale data 194,398 1.95e
−7
2.94e
−6
- -
Simple Event Funnelling 186,414 2.95e
−6
3.65e
−5
103.20 ms *
Tonic Downscale 194,312 5.40e
−5
4.31e
−4
3.20 ms *
Log-luminance
Event Count 7,778 1.25e
−7
1.88e
−6
0.83 s **
Linear Estimation 624 8.58e
−9
1.56e
−7
2.63 s ***
Cubic Estimation 435 8.92e
−9
1.66e
−7
2.94 s ****
Hand gesture recognition is a skill used daily in
the human society and is tightly integrated with ver-
bal communication, hence the need of computational
learning of such data. Since it relies heavily low la-
tency, this task is well suited for event-based compu-
tation. Building on this notion, Amir et al. presented
at CVPR 2017 a complete hand gesture neuromorphic
dataset called DVS128 Gesture (Amir et al., 2017).
To this end, 29 subjects were recorded performing 11
different hand gestures under 3 kinds of illumination
conditions, by a DVS128 camera (see Fig 6). A total
of about 133 samples are available for each gesture,
each composed roughly of 400,000 events and of di-
mension 128×128 pixels, for a duration of 6 seconds
approximately. The dataset is split in two sub-datasets
to facilitate machine learning training: the train sub-
category received 80% of the recorded samples and
the test 20%, with an even distribution of the 11 ges-
tures between them.
This dataset was chosen according to its relevance
to our motivations: DVS128 Gesture represents dy-
namic information to be processed temporally, which
would be the case in most embedded systems.
4.2 Comparison
Table 1 compares between the 6 methods presented
above and with the Tonic’s ”Downsample” tool ac-
cording to 5 criteria described in the following sec-
tion.
Number of Events. The mean number of events per
sample was calculated over the whole DVS28 Gesture
dataset at fullscale and downscaled by the 7 methods
mentioned in Table 1.
Temporal density Events temporal density D cor-
responds to the activation probability of pixels aver-
aged over the whole sensor:
D =
∑
w
x=0
∑
h
y=0
P
x,y
w · h
(5)
with w and h respectively the width and height of the
sensor. The activation probability P
x,y
is calculated as
the number of events (positive or negative) occurring
at a given pixel divided by the time length of the sam-
ple:
P
x,y
=
∑
t
max
t=t
min
δ(x
t
,x) · δ(y
t
,y)
t
max
−t
min
(6)
with P
x,y
the activation probability of one pixel of co-
ordinates (x, y), t
min
and t
max
respectively the mini-
mum and maximum timestamp of the sample, and δ
the Kronecker delta function, which returns 1 if the
variables are equal, and 0 otherwise.
Information Entropy. If we consider the informa-
tion brought by positive (or negative) events accord-
ing to Shannon’s information theory, we can estimate
the entropy H of the dataset as the average over all
pixels and polarities p of the entropy H
x,y,p
:
H =
∑
p∈{−,+}
∑
w
x=0
∑
h
y=0
H
x,y,p
2 · w · h
with H
x,y,p
=
∑
P
e
∈{P
x,y,p
,P
x,y,p
}
−P
e
· log
2
(P
e
)
(7)
where P
x,y,p
is the probability of event (probability
for the pixel of being active), and P
x,y,p
= 1 − P
x,y,p
is
the dual probability of no event, for the polarity p at
location (x,y). H
x,y,p
becomes lower when the pixel
is either never active or always active. Entropy values
in Table 4.2 are averaged from both polarities.
Computation Time. The computation time of each
method presented in this paper was calculated on a
Event Data Downscaling for Embedded Computer Vision
251

panel of over 500,000,000 events. The values pre-
sented in the Table 1 correspond to the average calcu-
lation period for the downscaling of 100,000 events,
expressed in seconds.
It should be noted that the values produced for
the SNN Pooling method are not obtained from the
similar panel of event data as the other. As a matter
of fact, since the computation time for one sample
using either technique exceeds 10 min, we chose to
assess our criteria on a small set of downsampled
events using SNN Pooling.
The values of these criteria confirm the hypotheses
we outlined above. Tonic’s ”Downscale” method has
the highest number of events, thus the highest event
density; this spatial reduction does not lead to a sig-
nificant drop of event flow, thus does not answer our
need for reduced data to handle. The same goes for
the Simple Event Funneling, which does ignore all
event duplicates. Even though the computation time
of those two methods is low, the output data is too
important to be processed more efficiently than the
original one. We should also point out that their in-
formation entropy is quite low, due to the constant ac-
tivation of the sensor’s pixels.
The log-luminance techniques are the most con-
sistent with the optical reality behind event data
recording. It drops a large amount of data, thus signif-
icantly improving any embedded computation, while
maintaining a relatively high level of information en-
tropy. SNN Pooling is also promising by its behav-
ior closely related to one of an event-camera, but it
is extremely sensible to the weight of its connection:
here the weight is probably too high hence its poor
results. We intend to take advantage of the high com-
putational efficiency offered by SpiNNaker (Furber
et al., 2013) or Loihi (Davies et al., 2018) in order
to assess the optimal hyperparameters.
5 CONCLUSION
Event cameras take an increasing part in current trend
in computer vision, with a number of possible appli-
cations in robotics and autonomous driving. While
standard frame-based data (grayscale and RGB) are
easily downscaled – which is a very common pre-
processing step, there currently exists no straightfor-
ward equivalent for event data.
In this paper, we introduce and compare 7 meth-
ods for event data downscaling for embedded com-
puter vision applications. Our results show that the
choice of the reduction methods greatly influences
the event features of the reduced dataset, namely the
number of events, the density, and information en-
tropy. The proposed methods offer a panel of so-
lutions to choose from depending on the target task
(classification, detection, tracking, etc.)
Our future work include the assessment of the pro-
posed methods on a classical computer vision tasks
such as classification, in order to evaluate the accu-
racy loss brought by the proposed methods. Along
this line of research, we intend to develop event reduc-
tion using spiking neural networks, a relevant spatial
downscaling method for the neuromorphic processing
of event based data. This new type of asynchronous
artificial neural network is closer to biology than tra-
ditional artificial networks, mainly because they seek
to mimic the dynamics of neural membrane and ac-
tion potentials over time. The Leaky Integrate-and-
Fire neuron model more specifically simulates the
increase of the membrane potential lead by the fre-
quency of input spikes coupled with a constant slow
decrease. We believe that this mechanism is well
suited to implement an event downscaling method
which temporally pools input events. Preliminary re-
sults lead us to understand that hyperparametrisation
may have a significant influence on this preprocess,
which we would like to discuss in the foreseeable fu-
ture. Besides, one important aspect for real time ap-
plications is the ability of the proposed methods to
operate in real time, so as to directly reduce the in-
put event flow and save compute, memory and energy
in embedded systems. Therefore we will evaluate the
real time capability of the methods. A relevant ap-
plication of the proposed methods is to implement a
foveation mechanism, such as in (Gruel et al., 2021).
Finally, it will be useful to extend the spatial down-
scaling to temporal downscaling to further adjust the
density of event flow.
ACKNOWLEDGEMENTS
This work was supported by the European Union’s
ERA-NET CHIST-ERA 2018 research and innova-
tion programme under grant agreement ANR-19-
CHR3-0008.
The authors are grateful to the OPAL infrastruc-
ture from Universit
´
e C
ˆ
ote d’Azur for providing re-
sources and support.
REFERENCES
Amir, A., Taba, B., Berg, D., Melano, T., McKinstry, J.,
Di Nolfo, C., Nayak, T., Andreopoulos, A., Garreau,
G., Mendoza, M., Kusnitz, J., Debole, M., Esser, S.,
VISAPP 2022 - 17th International Conference on Computer Vision Theory and Applications
252

Delbruck, T., Flickner, M., and Modha, D. (2017). A
Low Power, Fully Event-Based Gesture Recognition
System. In Computer Vision and Pattern Recognition
(CVPR), pages 7388–7397, Honolulu, HI. IEEE.
Bi, Y., Chadha, A., Abbas, A., Bourtsoulatze, E., and An-
dreopoulos, Y. (2019). Graph-based object classifica-
tion for neuromorphic vision sensing.
Chin, T.-J., Bagchi, S., Eriksson, A., and Schaik, A. V.
(2019). Star tracking using an event camera. 2019
IEEE/CVF Conference on Computer Vision and Pat-
tern Recognition Workshops (CVPRW).
Cohen, G., Afshar, S., van Schaik, A., Wabnitz, A., Bessell,
T., Rutten, M., and Morreale, B. (2017). Event-based
sensing for space situational awareness.
Cordone, L., Miramond, B., and Ferrante, S. (2021). Learn-
ing from Event Cameras with Sparse Spiking Con-
volutional Neural Networks. In IEEE, editor, Inter-
national Joint Conference On Neural Networks 2021
(IJCNN 2021), page 8, Conf
´
erence virtuelle, China.
Davies, M., Srinivasa, N., Lin, T.-H., Chinya, G., Cao, Y.,
Choday, S. H., Dimou, G., Joshi, P., Imam, N., Jain,
S., Liao, Y., Lin, C.-K., Lines, A., Liu, R., Math-
aikutty, D., McCoy, S., Paul, A., Tse, J., Venkatara-
manan, G., Weng, Y.-H., Wild, A., Yang, Y., and
Wang, H. (2018). Loihi: A neuromorphic many-
core processor with on-chip learning. IEEE Micro,
38(1):82–99.
Fang, W., Yu, Z., Chen, Y., Masquelier, T., Huang, T., and
Tian, Y. (2021). Incorporating learnable membrane
time constant to enhance learning of spiking neural
networks. In International Conference on Computer
Vision (ICCV), pages 2661–2671.
Furber, S. B., Lester, D. R., Plana, L. A., Garside, J. D.,
Painkras, E., Temple, S., and Brown, A. D. (2013).
Overview of the spinnaker system architecture. IEEE
Transactions on Computers, 62(12):2454–2467.
Gallego, G., Delbruck, T., Orchard, G., and al. (2020).
Event-based vision: A survey. IEEE Transactions on
Pattern Analysis and Machine Intelligence.
Gehrig, D., Gehrig, M., Hidalgo-Carri
´
o, J., and Scara-
muzza, D. (2020). Video to events: Recycling video
datasets for event cameras. In IEEE Conf. Comput.
Vis. Pattern Recog. (CVPR).
Glover, A. and Bartolozzi, C. (2016). Event-driven ball de-
tection and gaze fixation in clutter. 2016 IEEE/RSJ In-
ternational Conference on Intelligent Robots and Sys-
tems (IROS).
Gruel, A., Martinet, J., Linares-Barranco, B., and Serrano-
Gotarredona, T. (2021). Stakes of foveation on event
cameras. In ORASIS 2021, Saint Ferr
´
eol, France. Cen-
tre National de la Recherche Scientifique [CNRS].
Huang, C. (2021). Event-based timestamp image encod-
ing network for human action recognition and antic-
ipation. In 2021 International Joint Conference on
Neural Networks (IJCNN), pages 1–9.
Kim, H., Leutenegger, S., and Davison, A. J. (2016). Real-
time 3d reconstruction and 6-dof tracking with an
event camera. Computer Vision – ECCV 2016 Lecture
Notes in Computer Science, page 349–364.
Lagorce, X., Ieng, S.-H., Clady, X., Pfeiffer, M., and Benos-
man, R. (2015). Spatiotemporal features for asyn-
chronous event-based data. Front. Neurosci. - Neu-
romorphic Engineering.
Lenz, G., Chaney, K., Shrestha, S. B., Oubari, O., Pi-
caud, S., and Zarrella, G. (2021). Tonic: event-based
datasets and transformations. Documentation avail-
able under https://tonic.readthedocs.io.
Lichtsteiner, P., Posch, C., and Delbruck, T. (2008). A
128x128 120 db 15 us latency asynchronous tempo-
ral contrast vision sensor. IEEE Journal of Solid-State
Circuits.
Mahowald, M. and Mead, C. (1991). The Silicon Retina.
Sci. American.
Orchard, G., Benosman, R., Etienne-Cummings, R., and
Thakor, N. V. (2013). A spiking neural network ar-
chitecture for visual motion estimation. 2013 IEEE
Biomedical Circuits and Systems Conference (Bio-
CAS).
Paredes-Valles, F., Scheper, K. Y. W., and Croon, G. C. H.
E. D. (2020). Unsupervised learning of a hierarchi-
cal spiking neural network for optical flow estimation:
From events to global motion perception. IEEE Trans-
actions on Pattern Analysis and Machine Intelligence,
42(8):2051–2064.
Rabbath, C. and Corriveau, D. (2019). A comparison
of piecewise cubic hermite interpolating polynomials,
cubic splines and piecewise linear functions for the
approximation of projectile aerodynamics. 31st Inter-
national Symposium on Ballistics.
Rebecq, H., Horstschaefer, T., and Scaramuzza, D. (2017).
Real-time visual-inertial odometry for event cameras
using keyframe-based nonlinear optimization.
Rebecq, H., Ranftl, R., Koltun, V., and Scaramuzza, D.
(2019). Events-to-video: Bringing modern computer
vision to event cameras. IEEE Conf. Comput. Vis. Pat-
tern Recog. (CVPR).
Rebecq, H., Ranftl, R., Koltun, V., and Scaramuzza, D.
(2021). High speed and high dynamic range video
with an event camera. IEEE Transactions on Pattern
Analysis and Machine Intelligence, 43(6):1964–1980.
Vidal, A. R., Rebecq, H., Horstschaefer, T., and Scara-
muzza, D. (2018). Ultimate slam? combining events,
images, and imu for robust visual slam in hdr and
high-speed scenarios. IEEE Robotics and Automation
Letters, 3(2):994–1001.
Zhang, L., Zhang, H., Zhu, C., Guo, S., Chen, J., and Wang,
L. (2021a). Fine-grained video deblurring with event
camera. In Loko
ˇ
c, J., Skopal, T., Schoeffmann, K.,
Mezaris, V., Li, X., Vrochidis, S., and Patras, I., ed-
itors, MultiMedia Modeling, pages 352–364, Cham.
Springer International Publishing.
Zhang, Z., Yezzi, A., and Gallego, G. (2021b). Im-
age reconstruction from events. why learn it?
arXiv:2112.06242.
Event Data Downscaling for Embedded Computer Vision
253
