
Wavelet based Machine Learning Approaches towards Precision
Medicine in Diabetes Mellitus
Adeethyia Shankar
1a
, Stephanie Chang
1
, Xiaodi Wang
1
and Yongzhong Zhao
2
1
Department of Mathematics, Western Connecticut State University, 181 White Street, Danbury, U.S.A.
2
Department of Cellular and Molecular Medicine, Cleveland Clinic, Cleveland, U.S.A.
Keywords: Diabetes Mellitus, Discrete M-band Wavelet Transform, Machine Learning, Precision Medicine, Data
Visualization, t-SNE, UMAP.
Abstract: It is estimated that 422 million people around the world have diabetes mellitus (DM)—a devastating, complex,
and highly heterogeneous disease—requesting better interventions based on disease subtyping. In this
research, we utilize the discrete wavelet transform (DWT) to decompose and denoise DM data. Using DWT,
we enhance heart rate variability (HRV) based DM diagnosis, data visualization of the disparities in Human
Microbiome Project (HMP) data (gut bacteria, metabolomics, proteomics, RNA sequencing, targeted
proteomics, and transcriptomics data) using demographic features, and insulin resistance prediction. We also
attempt to forecast continuous glucose monitoring (CGM) ahead by 90 minutes because CGM is unable to
provide real-time blood glucose measurements. We achieve 91.9% diagnosis accuracy for Type 1 DM using
Random Forest on data transformed with DWT, holding the potential for usage in clinics. In addition, our
DWT-based t-SNE and UMAP explorative analysis of HMP data support subtypes of prediabetic patients
stratified by sex, race, and age. Moreover, DWT-based transformations provide multi-view clustering that
any other methods would not provide on metabolomics, proteomics, RNA sequencing, targeted proteomics,
and transcriptomics data and outperform those without DWT. Taken together, DWT-based machine learning
approaches enable a fine resolution of subtyping DM towards precision medicine.
1 INTRODUCTION
Diabetes Mellitus (DM)—a group of metabolic
diseases that manifest themselves with chronic
hyperglycemia resulting from issues with insulin
absorption or production—is estimated to have a
prevalence of 422 million people around the world.
DM is a devastating, complex, and highly
heterogeneous disease, requesting better
interventions based on disease subtyping (Kharroubi
& Darwish, 2015).
Hypoglycemia is a condition where blood sugar
drops below normal levels. It is a relatively common
condition in diabetic patients, although it occurs more
frequently in individuals affected by type 1 DM
(T1D). While hypoglycemia is usually harmless,
prolonged hypoglycemia without action can lead to
seizure, brain damage, or even death. Conversely,
hyperglycemia is a condition where blood sugar rises
above normal levels and this condition is more
a
https://orcid.org/0000-0003-4298-2797
common with individuals affected by T1D. However,
untreated hyperglycemia can result in damage to
various tissues, comatose, or even death.
Because of these conditions, monitoring blood
glucose levels is vital. While accurate blood glucose
can be given in near real-time, predicting blood
glucose levels into the near future would be a useful
tool in preventing abnormal levels of glucose. By
using machine learning methods, we sought to
provide accurate predictions for blood glucose levels
in individuals with T1D or type 2 DM (T2D).
At the same time, diagnosing DM is essential for
the long-term health of patients. Nevertheless, many
of these tests are either inaccurate or very
inconvenient. For example, the A1C test is affected
by many factors, including anemia, smoking,
pregnancy, and certain infections (Bonora &
Tuomilehto, 2011). Other tests, like the glucose
tolerance test, take too much running time for many
individuals. By using machine learning methods, we
290
Shankar, A., Chang, S., Wang, X. and Zhao, Y.
Wavelet based Machine Learning Approaches towards Precision Medicine in Diabetes Mellitus.
DOI: 10.5220/0010993100003123
In Proceedings of the 15th International Joint Conference on Biomedical Engineering Systems and Technologies (BIOSTEC 2022) - Volume 4: BIOSIGNALS, pages 290-297
ISBN: 978-989-758-552-4; ISSN: 2184-4305
Copyright
c
2022 by SCITEPRESS – Science and Technology Publications, Lda. All rights reserved

sought to classify individuals as healthy or T1D by
using heart rate variability (HRV).
In this research, we utilize the discrete wavelet
transform (DWT) to decompose and denoise DM
data, and to create multi-view clustering viewing
window as well.
To address many aspects of the DM illnesses and
their treatments, we base our study on CGM forecast,
HRV-based diagnosis, and DM subtyping. Across
these topics, we identify prediabetes (i.e., subtyping
by demographics, prediction of insulin resistance), as
well as type 1 (i.e., diagnosis, managing blood
glucose) and type 2 DM (i.e., managing blood
glucose). Combining all of these topics shines light
on DWT-based machine learning approaches towards
precision medicine. In addition, our DWT-based t-
SNE and UMAP explorative analysis of HMP data
support subtypes of prediabetic patients stratified by
sex, race, age, insulin resistance(IR)/insulin
sensitivity(IS) based on DWT of proteomics, targeted
proteomics, and transcriptomics data.
1.1 CGM Forecast
The introduction of continuous glucose monitoring
(CGM) enables non-invasive and more
comprehensive monitoring. CGM sensors can deliver
interstitial glucose levels every 1 to 5 minutes, in
contrast with previous glucose monitoring methods.
This provides a significantly more detailed time series
on glucose levels that can be automatically sent to
smart devices. However, CGM devices are unable to
accurately find blood glucose levels; rather, CGM
lags behind the trend of blood glucose levels. As a
result, it is necessary to be able to forecast glucose
levels by using CGM measurements to provide real-
time glucose updates for diabetic patients (Lobo et al.,
2021).
Using a modified Artificial Neural Network
(ANN), a model that replicates the interconnected
neurons of the brain, Bertachi et al. predicted blood
glucose 15, 30, 45, and 60 minutes ahead and
achieved RMSEs of 6.43, 7.45, 8.13, and 9.03,
respectively (Bertachi et al., 2018). In 2017, Fiorini et
al. trained 4 different models namely Long Short
Term Memory (LSTM), Auto Regressive Integrated
Moving Average (ARIMA), Kalman Filter, and
Kernel Ridge Regression (KRR) with a dataset of 148
patients (Fiorini et al., 2017). KRR was the most
accurate for 30, 60, and 90 minutes, successively.
However, each model was trained to fit separate
individuals, rather than fitting all of the patients.
These methods differed from previous ones with the
introduction
of methods that are not based on neural
networks, such as KRR.
In this research, we propose a method to
accurately predict glucose levels using a novel
technique developed by Facebook called Prophet. We
also use traditional methods ARIMA and KRR as
benchmarks (Taylor & Letham, 2017).
1.2 Diabetes Prediction using HRV
Heart rate variability (HRV) refers to the variability
in RR intervals, which are the time between
consecutive heartbeats. As DM has a harmful impact
on the heart, HRV in diabetic patients is reduced
(Kardelen et al., 2006). As a result, HRV has been
used to detect DM. Seyd et al. used an ANN, to
classify HRV signals from 65 healthy people and 65
diabetic patients. Using the ANN, they achieved an
accuracy of 93.08%, a precision of 96.67%, and a
recall of 89.23% (P.t. et al., 2011). Similar to Seyd et
al., Swapna used a Convolutional Neural Network
(CNN), but combined with LSTM and support vector
machine (SVM) for the classification of
echocardiogram (ECG) signals of 20 diabetic patients
and 20 healthy individuals. Swapna et al. attained a
high accuracy of 95.7% with the combination model
(Swapna et al., 2018).
On the other hand, machine learning (ML)
algorithms have also been used to classify HRV data
with comparably high metrics. Acharya et al.,
recording ECG signals and obtaining HRV signals
from 15 healthy and 15 diabetic patients, achieved an
accuracy of 90.0%, precision of 88.9%, and recall of
92.5% with the AdaBoost classifier with the least
squares method (Rajendra acharya et al., 2013).
Furthermore, in a later work, Acharya et al. carried
out the Decision Tree algorithm on the same HRV
signals transformed using Wavelet decomposition up
to 5 levels, resulting in an accuracy of 92.64%,
precision of 92.59%, and a recall of 92.68%
(Rajendra acharya et al., 2015).
To predict DM using HRV signals, we examined
the SVM, XGBoost, and Random Forest (RF) on
HRV signals transformed in a variety of methods via
DWT. While RF has been used to diagnose DM
(Samant & Agarwal, 2018; Benbelkacem, 2019),
XGBoost and RF have not been used prior to classify
HRV signals transformed using DWT, and our
remarkable experimental results strongly support our
algorithm.
1.3 Wavelet based t-SNE and UMAP
t-SNE (t-Distributed Stochastic Neighbor
Embedding) visualization in biomedical fields has
Wavelet based Machine Learning Approaches towards Precision Medicine in Diabetes Mellitus
291

been recently growing in popularity, particularly for
high-dimension single-cell sequencing data.
However, its application in the detection of DM still
remains rare and limited. UMAP (Uniform Manifold
Approximation and Projection) is widely applied in
data visualization and dimension reduction (McInnes
et al., 2018).
Using t-SNE visualization, Gupta et al.
successfully distinguished patients diagnosed with
T2DM from the non-diabetic, healthy samples based
on a dataset of 9,948 samples (Gupta et al., 2015).
However, the visualization was unable to cluster the
healthy and diagnosed individuals into individual
clusters.
Bej et al. analyzed a dataset of 10,125 T2DM
patients from the National Family Health Survey-4,
involving many features such as medical history,
dietary habits, addictions, and socioeconomic status.
They found that the conventional application of
UMAP was ineffective and uninformative. However,
applying a feature type-wise clustering method, Bej
et al. enabled visualizing the patients by clusters
corresponding to different features. Their findings
indicated that age and body mass index (BMI) are the
most important factors for T2DM (Bej et al., 2020).
For data visualization, we first denoised the data
by applying DWT on the HMP Stanford datasets
(iHMP Research Network Consortium, 2014) into
multi-view wavelet domain followed by applying t-
SNE and UMAP to the transformed data. Our newly
derived DWT-based t-SNE and UMAP methods on
metabolomics, proteomics, RNA sequencing,
targeted proteomics, and transcriptomics data enable
better clustering than do those without DWT.
2 RESULTS
2.1 Data Pre-processing
We used CGM and ECG data from the D1NAMO
dataset, a collection of data from 20 healthy
individuals and 9 patients with type 1 DM. The data
contain 4 day and collected ECG, CGM, food, and
breathing variables. CGM data were measured in
five-minute intervals before each meal and two hours
afterwards, for a total of 6 times a day. We
transformed the CGM unit from mmol/L to mg/dL.
Alongside breathing data and the CGM data, the ECG
data were collected at a rate of 250 Hz (Dubosson et
al., 2018). The HRV data recorded many RR intervals
in succession. We excluded a misclassified healthy
control with type 1 DM.
The Human Microbiome Project (HMP) began in
2008 to investigate how microbiomes affect their
hosts. Split up into two phases, HMP and Integrative
HMP (iHMP or HMP2), HMP has collected over
10000 samples from 300 subjects. HMP took
microbiomes from both healthy adults and diseased
individuals. iHMP explored how microbiomes
interacted with their hosts. Metabolism, immunity,
and molecular activity were all investigated, along
with how microbiomes might inform us about the
onset of type 2 DM. We downloaded the data from
the iPOP Project Data Portal from each of the
abundance entries (Snyder Lab, n.d.). We describe
results from amounts of certain types of bacteria in
the gut, amounts of certain products of metabolism,
untargeted profile of the amounts of certain proteins,
RNA transcripts, targeted profile of the amounts of
certain proteins, and also RNA transcripts.
For the glucose data from the DM patients in the
D1NAMO dataset, we removed the manual glucose
measurements so that the glucose data would solely
consist of CGM data. We then used the glucose
column, where each index represents five minutes. To
preprocess the HRV data, we first had to find
intervals of data without any outliers (which we
defined as any HRV measurement of under 500
milliseconds or above 2000 milliseconds). We chose
to use intervals of length 512 to be able to use DWT
to denoise the data and generate TS data. We also
decided to treat each interval as an independent
sample, which gave us 3003 healthy HRV samples
and 769 diabetic HRV samples. To fix this data
imbalance, we used SMOTE Tomek resampling,
which resulted in about equal numbers of healthy and
diabetic HRV samples.
To preprocess the abundance matrices from the
HMP dataset, we matched each subject’s VisitID to
their IR/IS classification (either IR or IS; we removed
subjects with Unknown). Subsequently, we removed
subjects for whom there were missing values. In
addition, we normalized the data by adding 0.1 and
taking the log base 2. We then performed DWT on
the normalized data. Figure 1 illustrates the workflow
we followed.
BIOSIGNALS 2022 - 15th International Conference on Bio-inspired Systems and Signal Processing
292
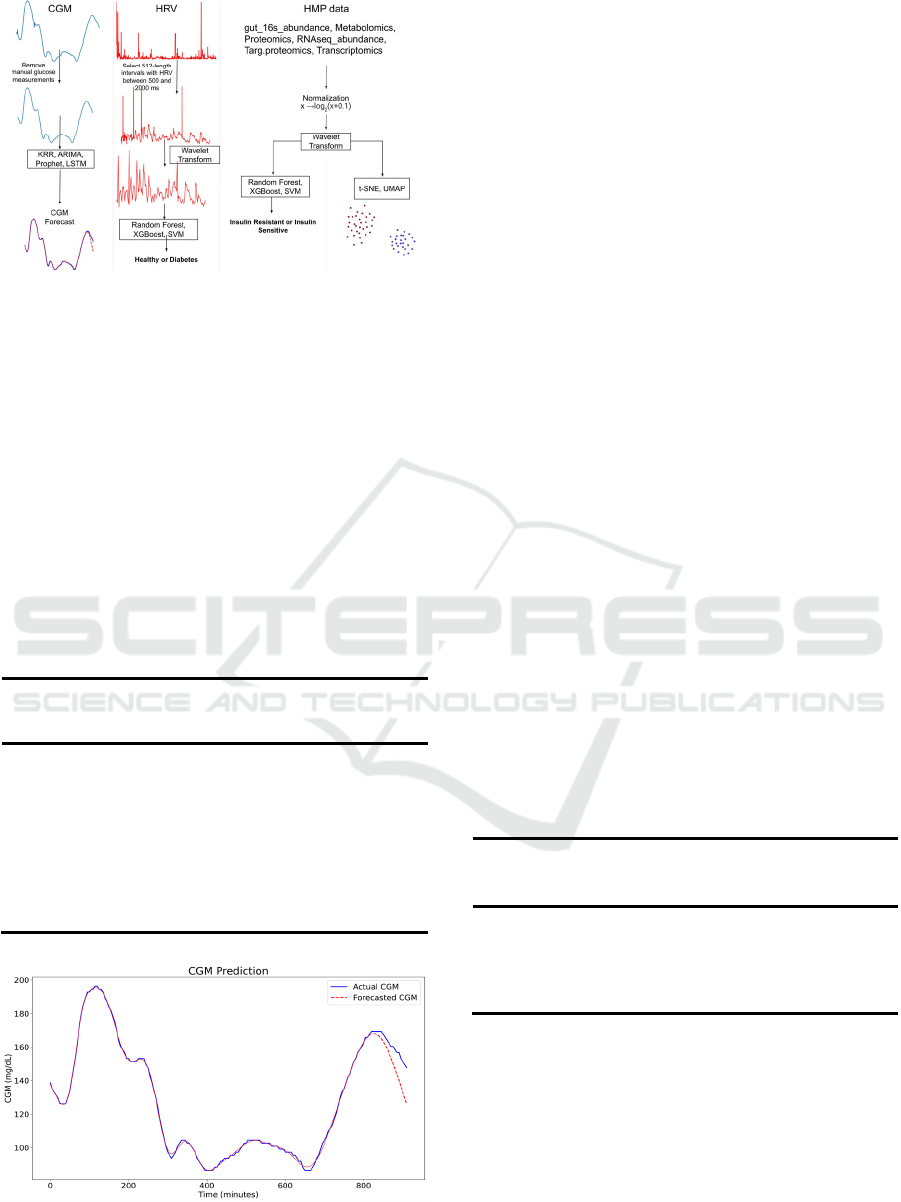
Figure 1: The workflow of forecasting CGM, predicting
DM using HRV, data visualization using t-SNE and
UMAP, and predicting IR in prediabetes.
2.2 CGM Forecast
In our research we used 3 different methods to predict
blood glucose levels. Table 1 bolds the best RMSE
and MAE for 30, 60, and 90 minutes, which are
shared by KRR and ARIMA. In figure 2, KRR even
correctly anticipates a drop in CGM for patient 3.
These results support KRR and ARIMA as good
forecasters of CGM, whereas Prophet did not yield
good forecasts.
Table 1: Each metric is represented in the form mean
(standard deviation) based on the results of each patient.
30 min 60 min 90 min
RMSE MAE RMSE MAE RMSE MAE
KRR 24.27 26.99 43.05 42.88 59.60 56.38
(25.37) (29.09) (44.74) (43.95) (63.01) (60.02)
ARIMA 25.92 17.50 54.41 37.09 72.359 51.14
(7.22) (4.23) (16.95) (8.83) (25.65) (17.05)
Prophet 60.43 45.79 67.17 50.85 73.29 55.68
(26.27) (21.69) (28.17) (23.08) (30.09) (24.58)
The best metrics for each category are bolded.
Figure 2: A 90-minute forecast by KRR for patient 3.
Of the four, KRR had the lowest RMSE for each
prediction horizon while ARIMA had a lower MAE.
Because of this, KRR may not be a reliable model to
use when forecasting blood glucose. KRR had
difficulty predicting when blood glucose would
suddenly rise or drop. ARIMA had the lowest
standard deviations of any group. This is represented
in its MAE, where it consistently has the lowest value.
Prophet performed poorly. Its RMSE and STD were
both relatively high.
A limitation in our work was the limited datasets
that were available to us. The small training size that
we had, nine diabetic patients, causes our models
difficult to generalize. The accuracy of our models
was most likely negatively affected by the shorter
time series data. For future research, a larger dataset
of patients would be desirable.
2.3 Diabetes Prediction using HRV
In this section, we assess machine learning algorithms
on data transformed in a variety of ways using DWT
(Table 2). RF algorithm on HRV signals transformed
to the Wavelet Domain (TS) and resampled using the
SMOTE Tomek method; the algorithm yielded an
accuracy of 91.9%, precision of 95.5%, and recall of
87.9%. These results, while the accuracy and recall
are lower and the precision is higher, are comparable
to those of Acharya. Moreover, Acharya used 1000
HRV samples at a time while we only used 512; as a
consequence, our model classifies HRV signals with
nearly as much accuracy while taking about half as
much time to record a patient’s HRV.
Table 2: Best overall results out of all data transformations
tested.
Accu-
racy
Balanced
Accuracy
Preci-
sion
Recall ROC
AUC
F1
Score
RF 0.919 0.919 0.955 0.880 0.968 0.916
XGBoost 0.788 0.788 0.788 0.789 0.871 0.788
SVM 0.775 0.775 0.771 0.783 0.853 0.777
RF: Random Forest. The best metrics for each category are bolded.
As shown in Figure 3, it appears that the best
recall of 88.4% occurred with RF for classifying HRV
signals. For RF, all data were classified with
comparable ROC AUC and average precision (Figure
4 & 5). Nevertheless, (TS)* data performed best in
diagnosing diabetes.
Wavelet based Machine Learning Approaches towards Precision Medicine in Diabetes Mellitus
293
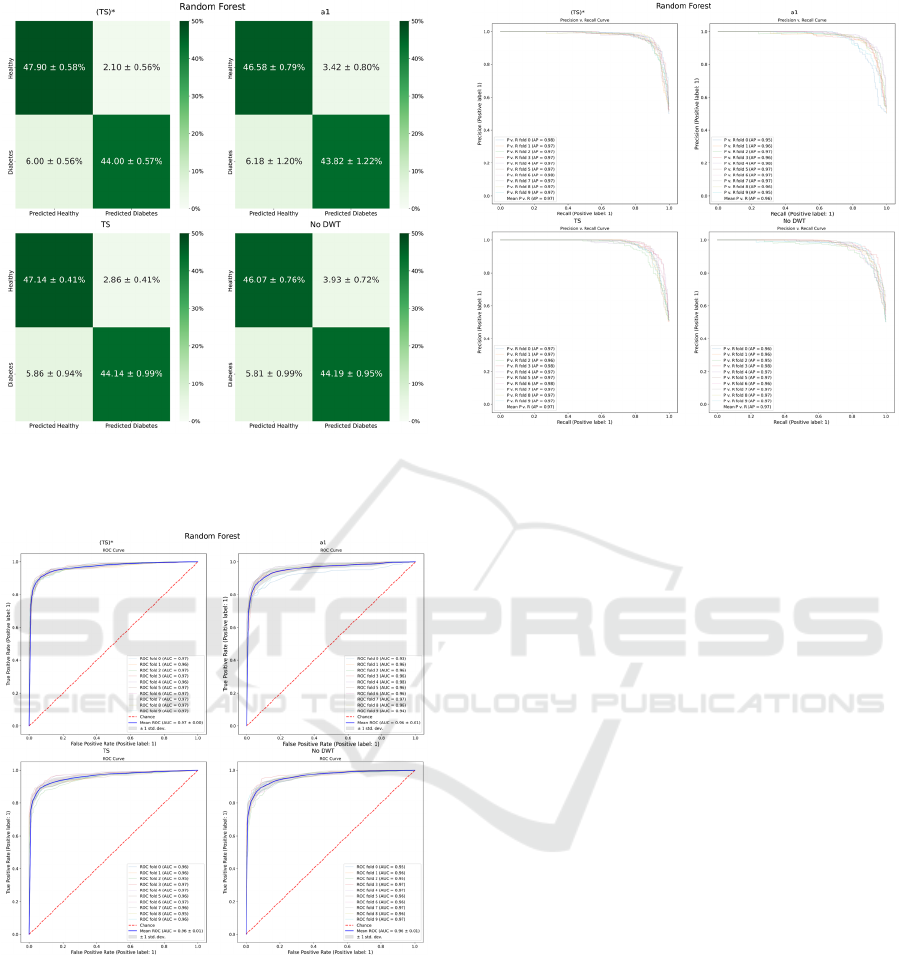
Figure 3: The four best confusion matrices for Random
Forest are (TS)*, a
1
, TS, and No DWT, in that order. Each
entry is of the form mean ± standard deviation.
Figure 4: The four best ROC curves for Random Forest are
(TS)*, a
1
, TS, and No DWT with mean AUC of 0.97, 0.96,
0.96, and 0.96 respectively. Each ROC curve displays 10
folds as well as a mean curve (mean ± standard deviation).
Previously, Acharya et al., using the Decision
Tree algorithm on the same HRV signals transformed
using DWT decomposition up to 5 levels, obtained an
accuracy of 92.64%, precision of 92.59%, and recall
of 92.68% (Acharya et al., 2015).
However, compared to the neural networks of
other papers, RF on HRV data transformed to the
Wavelet
Domain performed poor. Seyd P.T.’s ANN
Figure 5: The four best Precision v. recall curves for
Random Forest are (TS)*, a
1
, TS, and No DWT with mean
average precision of 0.97, 0.96, 0.97, and 0.97 respectively.
Displayed are the results from each of the 10 folds.
Performed with an accuracy of 93.08%, precision of
96.67%, and recall of 89.23%. Of note, RF is a
simpler model than a neural network, so our model is
promising for relatively fast and accurate DM
diagnosis for use by clinicians.
However, a limitation of our classification work
with HRV is that we resample the HRV signals to
correct the data imbalance between healthy and DM.
This means that some of the samples may not be
accurate representations of HRV. Also, given that we
do not know how long the DM patients in the
D1NAMO dataset have had DM, and as DM worsens
cardiac health over time, it is most likely that people
with DM who have not had DM for very long may be
classified with lower accuracy. Thus, for future
research, we recommend using RF and transforming
the HRV signals to the DWT domain using DWT on
HRV signals from DM patients who have not had the
condition for more than a few years.
2.4 t-SNE and UMAP
Given the high complexity of the HMP Stanford
datasets, t-SNE and UMAP figures reflect the
heterogeneity and homogeneity in different datasets.
Both t-SNE and UMAP enable successfully
distinguishing several qualities within prediabetes
patients. We first applied 6 different treatments for
the dataset, namely: Preprocessed, Preprocessed with
Wavelet Denoise, Preprocessed in Wavelet Domain,
BIOSIGNALS 2022 - 15th International Conference on Bio-inspired Systems and Signal Processing
294
Normalized, Normalized with Wavelet Denoise, and
Normalized in Wavelet Domain. In addition, t-SNE
and UMAP were each used to test the separability of
5 different bases for separation, which include:
Gender, Race, Insulin Resistance (IR)/Insulin
Sensitivity (IS) Classification, Age Group, and BMI
Group.
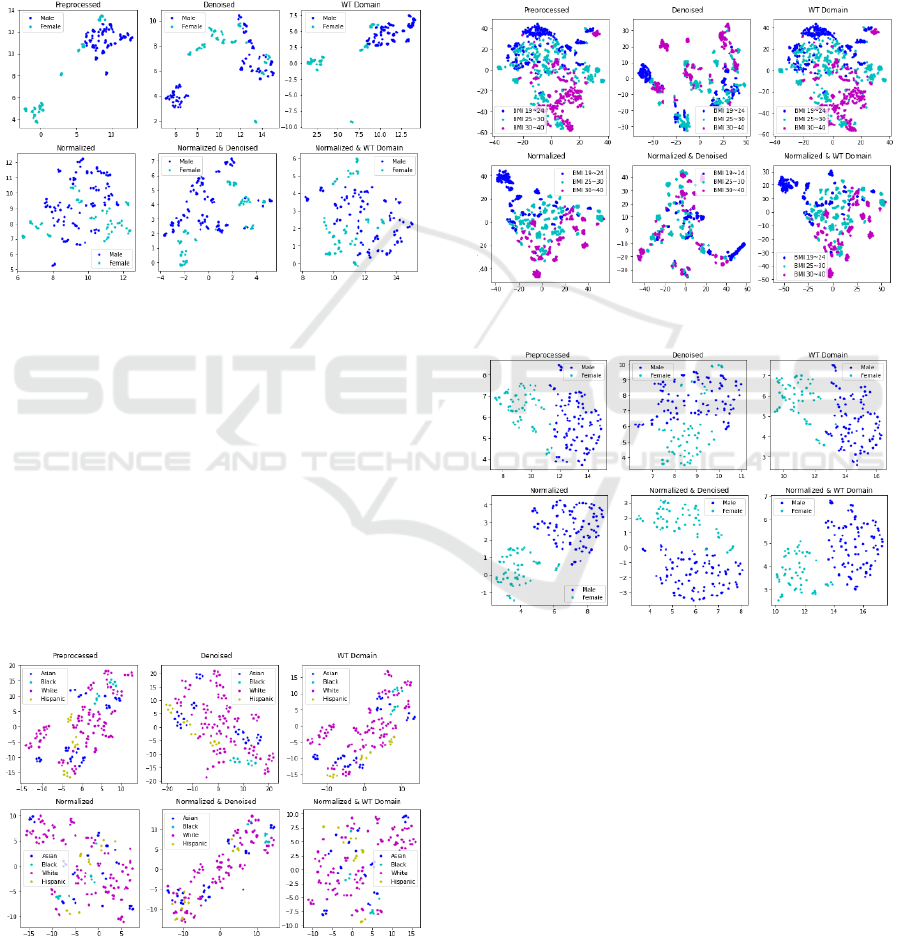
We were able to utilize UMAP to obtain well-
defined clusters, particularly in gender classification
(Figure 6) to the Targeted Proteomics dataset.
Figure 6: UMAP on the Targeted Proteomics dataset.
The ‘Preprocessed’ data presents two clusters,
largely separating males and females. On the other
hand, the ‘Normalized’ data presents a scatter of
points, with the males and females largely mixed
together. The ‘Preprocessed WT Domain’ figure
displays two compact clusters, comparatively cleaner
than both the ‘Wavelet Denoised’ and preprocessed
figures.
Of the Lipidomics dataset figures, the t-SNE
results contain noticeable clusters for Black and
Hispanic, particularly in the ‘Preprocessed’,
“Denoised”, and ‘WT Domain’ with figure presenting
a more compact result (Figure 7).
Figure 7: t-SNE on the Lipidomics dataset.
We analyzed the Cytokine dataset, resulting in
distinct BMI-based clusters observed with both the t-
SNE and UMAP. In t-SNE, the Figure 8 shows that
‘Denoised’ and ‘Normalized Denoised’ pretreated
datasets present more compact clusters and points.
The other classification subjects also aggregate into
tight, compact clusters. It appears that certain
prediabetic subjects share different characteristics,
possibly presenting a stratification of these patients in
each cluster (Figure 8).
Figure 8: t-SNE on Cytokine abundance dataset.
Figure 9: UMAP on the Transcriptomics dataset.
Of the Transcriptomics dataset figures, the UMAP
results contain well-defined clusters, particularly in
gender classification (Figure 9). In all gender
classification figures for Transcriptomics, we
observed a gender-based cluster pattern. Thus, it has
implications in gender-based stratification of patients
in precision medicine for prediabetic patients.
The application of UMAP on the Gut 16
Microbiome dataset resulted in clear separation based
on IR/IS classification (Figure 10). These results
allow us to observe the patterns in clusters in the set
of prediabetic subjects, based on gut microbiomes.
Wavelet based Machine Learning Approaches towards Precision Medicine in Diabetes Mellitus
295

Figure 10: UMAP on the Gut 16 Microbiome dataset.
2.5 Prediabetes Insulin Resistance
Prediction
For SVM on the metabolomics data, both the
normalized and (TS)* normalized data obtained the
best results, with 77.7% accuracy, 75.0% balanced
accuracy, 100% precision, 50% recall, AUC of 1.000,
and F1 of 0.661. Similarly, the best results for SVM
on the proteomics data were from the normalized and
TS normalized data, bolded in Table 3, with 91.6%
accuracy, 90.5% balanced accuracy, 100% precision,
81.1% recall, AUC of 1.000, and F1 of 0.892. We
observed a similar propensity for SVM on the
Targ.proteomics data and the Transcriptomics data.
The normalized and TS normalized data enable
perfect accuracy, balanced accuracy, precision, recall,
AUC, and F1. For SVM on the Transcriptomics data,
denoised normalized data also got perfect metrics.
Table 3: Results of classifying SVM model data as IR or IS
on Proteomics.
Data
Type
Accu-
racy
Balanced
Accuracy
Preci-
sion
Recall ROC
AUC
F1
Score
N
o DWT 0.558 0.500 0.000 0.000 0.500 0.000
(TS)* 0.558 0.500 0.000 0.000 0.500 0.000
Denoised 0.558 0.500 0.000 0.000 0.500 0.000
N
1
0.916 0.905 1.000 0.811 1.000 0.892
(TS)* N 0.916 0.905 1.000 0.811 1.000 0.892
Denoised
N
0.558 0.500 0.000 0.000 0.500 0.000
1
N means Normalized. The best metrics for each model are bolded.
On the other hand, the TS data yielded the best
overall results for Random Forest on the
RNAseq_abundance data (72.1% accuracy, 58.9%
balanced accuracy, 19.0% recall, 0.309 F1), though
all the data types performed mostly the same for SVM
on the RNAseq_abundance data (67.2% accuracy,
51.0% balanced accuracy, 30.0% precision, 2.0%
recall, F1 of 0.037; denoised got an AUC of 0.988).
The TS data also did best overall for Random Forest
on the Transcriptomics data, with 92.2% accuracy,
91.2% balanced accuracy, 84.5% recall, AUC of
0.990, and F1 of 0.890, though the results for the
denoised data are comparable (had highest precision
of 98.0%). Thus, across all HMP data, DWT
transformed data yielded better performance in
predicting IR or IS in prediabetes.
Our application of the DWT based two
experimental visualization techniques to the HMP
Stanford dataset hold promising potential in allowing
biomedical specialists to interpret the data by
studying different visualizations of the dataset. We
envision that our approach has the potential to
uncover correlations between certain microbiomes
and attributes in prediabetes patients, holding a
promise for earlier detection and investigation of
diabetic behavior in patients.
3 CONCLUSIONS
With our decomposed and denoised DM data, we
enhance HRV based DM diagnosis, data visualization
of the disparities in HMP data demographic features,
and insulin resistance prediction. We forecast
continuous glucose monitoring (CGM) 90 minutes in
the future because CGM is unable to provide real-
time blood glucose measurements. Moreover, we
achieved 91.9% T1D diagnosis accuracy using
Random Forest on data transformed with DWT,
holding the potential for usage in clinics.
Furthermore, our DWT-based t-SNE and UMAP
explorative analysis of HMP data supports subtypes
of prediabetic patients stratified by sex, race, and age.
Thus, DWT-based transformations on metabolomics,
proteomics, RNA sequencing, targeted proteomics,
and Transcriptomics data yield better separation and
clearer clusters than those without DWT.
Our results have implications in precision
medicine. Precision medicine is based on
stratification of patients, taking into account personal
lifestyle, genetic information, and biomarkers. Our
research involves two datasets, the HMP Stanford
dataset along with the D1NAMO dataset, both of
which contain extremely detailed information upon
microbiomes, protein structure, CGM, ECG, food
consumption, and other vital data, suitable for
exemplification of machine learning modeling in
precision medicine. Taken together, DWT-based
BIOSIGNALS 2022 - 15th International Conference on Bio-inspired Systems and Signal Processing
296

machine learning approaches enable a fine resolution
of subtyping DM towards precision medicine.
REFERENCES
Bej, S., Sarkar, J., Biswas, S., Mitra, P., Chakrabarti, P., &
Wolkenhauer, O. (2020). Identification and
epidemiological characterization of non-obese type 2
diabetic sub-populations in the nfhs-4 study using an
unsupervised machine learning approach. MedRxiv.
https://doi.org/10.1101/2020.09.21.20198598
Benbelkacem, S. (2019). Random forests for diabetes
diagnosis. 2019 International Conference on Computer
and Information Sciences (ICCIS). https://doi.org/
10.1109/ICCISci.2019.8716405
Bertachi, A., Biagi, L., Contreras, I., Luo, N., & Vehí, J.
(2018). Prediction of blood glucose levels and
nocturnal hypoglycemia using physiological models
and artificial neural networks. CEUR-WS, 2148(14),
85-90. http://ceur-ws.org/Vol-2148/paper14.pdf
Bonora, E., & Tuomilehto, J. (2011). The pros and cons of
diagnosing diabetes with a1c. Diabetes Care,
34(Supplement_2), S184-S190. https://doi.org/
10.2337/dc11-s216
Dubosson, F., Ranvier, J.-E., Bromuri, S., Calbimonte, J.-
P., Ruiz, J., & Schumacher, M. (2018). The open
d1namo dataset: A multi-modal dataset for research on
non-invasive type 1 diabetes management. Informatics
in Medicine Unlocked, 13, 92-100. https://doi.org/
10.1016/j.imu.2018.09.003
Fiorini, S., Martini, C., Malpassi, D., Cordera, R., Maggi,
D., Verri, A., & Barla, A. (2017). Data-driven strategies
for robust forecast of continuous glucose monitoring
time-series. 2017 39th Annual International Conference
of the IEEE Engineering in Medicine and Biology
Society (EMBC), 1680-1683. https://doi.org/10.1109/
EMBC.2017.8037164
Gupta, P., Sivalingam, U., Pölst, S., & Navab, N. (2015).
Identifying patients with diabetes using discriminative
restricted boltzmann machines. Techical University of
Munich (TUM), Germany. http://doi.org/10.13140/
RG.2.2.10166.09283
iHMP Research Network Consortium. (2014). The
integrative human microbiome project: Dynamic
analysis of microbiome-host omics profiles during
periods of human health and disease. Cell Host &
Microbe, 16(3), 276-289. https://doi.org/10.1016/
j.chom.2014.08.014
Kardelen, F., Akcurin, G., Ertug, H., Akcurin, S., & Bircan,
I. (2006). Heart rate variability and circadian variations
in type 1 diabetes mellitus. Pediatric Diabetes, 7(1), 45-
50. https://doi.org/10.1111/j.1399-543X.2006.00141.x
Kharroubi, A. T., & Darwish, H. M. (2015). Diabetes
mellitus: The epidemic of the century. World Journal of
Diabetes, 6(6), 850-867. https://doi.org/10.4239/
wjd.v6.i6.850
Lobo, B., Farhy, L., Shafiei, M., & Kovatchev, B. (2021).
A data-driven approach to classifying daily continuous
glucose monitoring (CGM) time series. IEEE
Transactions on Biomedical Engineering, 1. https://
doi.org/10.1109/TBME.2021.3103127
McInnes, L., Healy, J., & Melville, J. (2018). Umap:
Uniform manifold approximation and projection for
dimension reduction. ArXiv Preprint. https://arxiv.org/
abs/1802.03426
P.t., A. S., Joseph, P. K., & Jacob, J. (2011). Automated
diagnosis of diabetes using heart rate variability signals.
Journal of Medical Systems, 36(3), 1935-1941. https://
doi.org/10.1007/s10916-011-9653-x
Rajendra acharya, U., Faust, O., Adib kadri, N., Suri, J. S.,
& Yu, W. (2013). Automated identification of normal
and diabetes heart rate signals using nonlinear
measures. Computers in Biology and Medicine, 43(10),
1523-1529. https://doi.org/10.1016/
j.compbiomed.2013.05.024
Rajendra acharya, U., Vidya, K. S., Ghista, D. N., Lim, W.
J. E., Molinari, F., & Sankaranarayanan, M. (2015).
Computer-aided diagnosis of diabetic subjects by heart
rate variability signals using discrete wavelet transform
method. Knowledge-Based Systems, 81, 56-64. https://
doi.org/10.1016/j.knosys.2015.02.005
Samant, P., & Agarwal, R. (2018). Machine learning
techniques for medical diagnosis of diabetes using iris
images. Computer Methods and Programs in
Biomedicine, 157, 121-128. https://doi.org/10.1016/
j.cmpb.2018.01.004
Snyder Lab. (n.d.). iPOP Project Data Portal. Stanford
University. Retrieved September 4, 2021, from http://
hmp2-data.stanford.edu/
Swapna, G., Vinayakumar, R., & Soman, K.p. (2018).
Diabetes detection using deep learning algorithms. ICT
Express, 4(4), 243-246. https://doi.org/10.1016/
j.icte.2018.10.005
Taylor, S. J., & Letham, B. (2017). Forecasting at scale.
PeerJ Preprints. https://doi.org/10.7287/
peerj.preprints.3190v2
Wavelet based Machine Learning Approaches towards Precision Medicine in Diabetes Mellitus
297
