
Research on Management Quality and Efficiency with a Project as
the Minimum Value Reflection Unit
Wang Xiaocun
11
, Guo Yihua
2b
and Xu Yanjun
1c
1
General Management Department Puneng Power Technology Engineering Branch of Shanghai Hengnengtai Enterprise
Management Co., Ltd., Shanghai, China
2
General Management Department Electric Power Research Institute of State Grid Shanghai Electric Power Company,
Shanghai, China
Keywords: Project Benefits, Benefit Analysis, Benefit Evaluation Mode.
Abstract: In recent years, facing increasing operating pressure, it is more and more important to improve the operating
efficiency of the company. This paper integrates the industry and finance data, studies the collection and
allocation logic of the income and cost of a single project, and realizes the benefit calculation of a single
project. On this basis, it establishes the comprehensive benefit evaluation index system of the project, carries
out the projected portrait, assists the company's business optimization, helps to optimize the company's
resource allocation, and promotes high-quality development.
1 INTRODUCTION
On the one hand, with the deepening of the
implementation of the transmission and distribution
tariff reform and the impact of multiple factors such
as the outbreak of COVID-19 and the reduction of
industrial and commercial electricity prices at the
national level, the power grid enterprises' growth in
electricity consumption has slowed down, the profit
level has dropped significantly and the cost
expenditures have been continuously cut down,
which directly affects the company's operating
income and the operating pressure has increased
significantly. On the other hand, the in-depth
development of key work such as multi-dimensional
lean management system reform and special action
for quality and efficiency improvement puts forward
higher requirements for the company's quality and
efficiency improvement and lean management. In this
context, the company began to comprehensively
explore the application of business and financial data
and value mining, divide small value reflection units,
study the calculation logic of the benefits of a single
project, carry out the company's operation quality and
efficiency analysis at multiple levels on the basis of
a
https://orcid.org/0000-0002-8498-3723
b
https://orcid.org/0000-0001-5882-7340
c
https://orcid.org/0000-0001-9706-1675
realizing the calculation of the benefits of a single
project, and on this basis, from the perspective of
profitability Establish the comprehensive benefit
evaluation index system of the project from the three
aspects of development capacity and cost structure,
carry out the quantitative scoring of the
comprehensive benefit of the project, assist the
company's business optimization, and provide
reference for the company's resource allocation
decision-making.
2 RESEARCH CONTENT
Firstly, the business types of the company are divided
into market-oriented business and non-market-
oriented business; Secondly, accurately collect the
projected revenue and direct cost, set scientific and
reasonable allocation rules, reasonably allocate the
indirect cost of the project, and accurately calculate
the income of a single project; Finally, the project
comprehensive benefit evaluation model is
established to evaluate and rank the comprehensive
benefits of various projects to support the project
optimization.
92
Xiaocun, W., Yihua, G. and Yanjun, X.
Research on Management Quality and Efficiency with a Project as the Minimum Value Reflection Unit.
DOI: 10.5220/0011161200003440
In Proceedings of the International Conference on Big Data Economy and Digital Management (BDEDM 2022), pages 92-98
ISBN: 978-989-758-593-7
Copyright
c
2022 by SCITEPRESS – Science and Technology Publications, Lda. All rights reserved
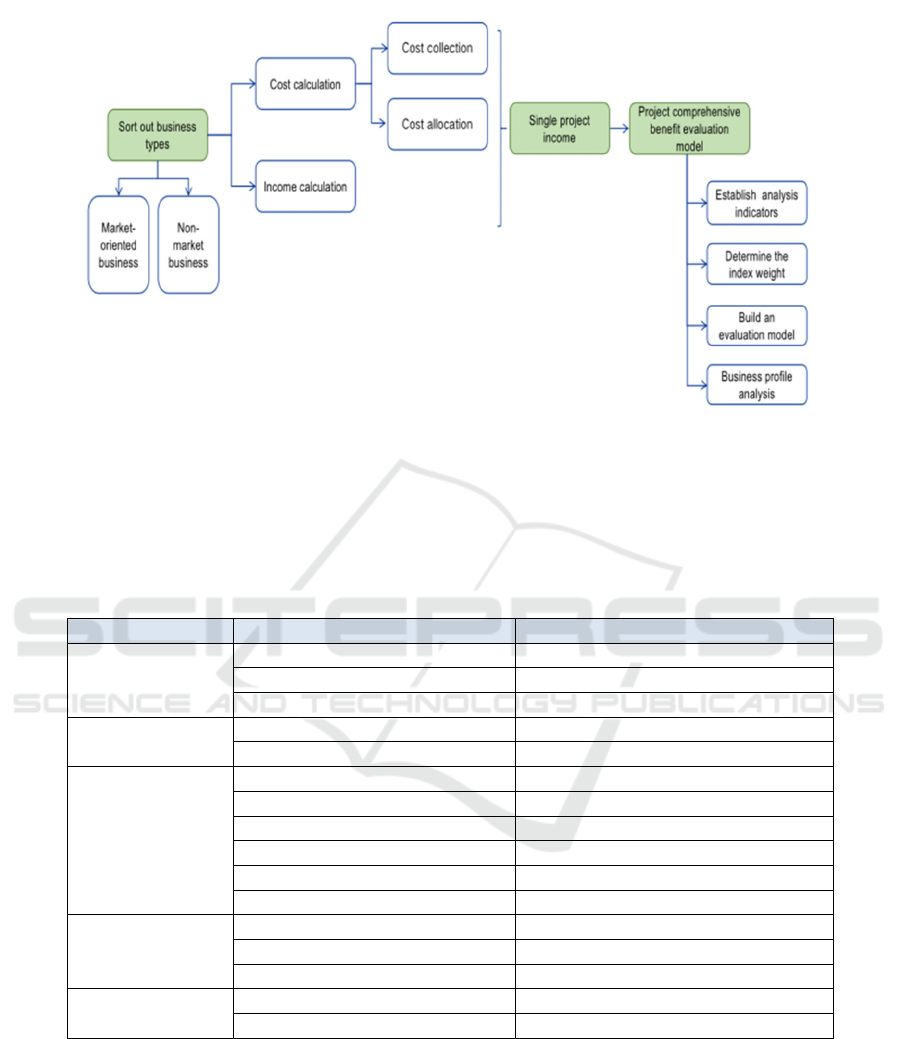
Figure 1: Quality and efficiency study of operation.
2.1 Sort Out Business Types
The company has five business departments, which
are respectively responsible for the development and
implementation of different types of business. Based
on the investigation of each department, the project
types carried out by the five departments are sorted
out and determined.
Table 1: Business types.
department Project type Business direction
Printing center
Printing services
p
rinting
Printing services Typesetting processing
Printing services Sporadic printing
Logistics Service
Center
Logistics services estate management
Logistics services Vehicle service
Measurement Service
Center
Measurement services Measurement technology services
Measurement services Equipment overhaul and maintenance
Logistics services estate management
Logistics services Vehicle service
Material services Retail sales
othe
r
Other comprehensive
Engineering repair
and test center
technical service Detection and auxiliary services
Rental services Equipment and warehouse leasing
Material services Equipment purchase agent
Technology and R &
D Center
technical service Technical assistance
technical service R & D
2.2 Benefit Calculation of Single
Project
Based on the income and cost data directly calculated
by each project, as well as the apportioned indirect
costs and public expenses of each project, the benefit
calculation of a single project is carried out.
Project profit = project revenue - project direct cost
- apportionment of indirect costs - apportionment of
public expenses
Among them, the projected revenue and project
direct cost have been calculated according to a single
project and can be directly collected; The indirect cost
of the project includes depreciation expense,
amortization of intangible assets, research and
Research on Management Quality and Efficiency with a Project as the Minimum Value Reflection Unit
93
development expense, repair expense, amortization of
low-value consumables, office expense, travel
expense, labor protection expense, etc. it has been
accounted to the business department, but not to a
single project, so it needs to be apportioned among
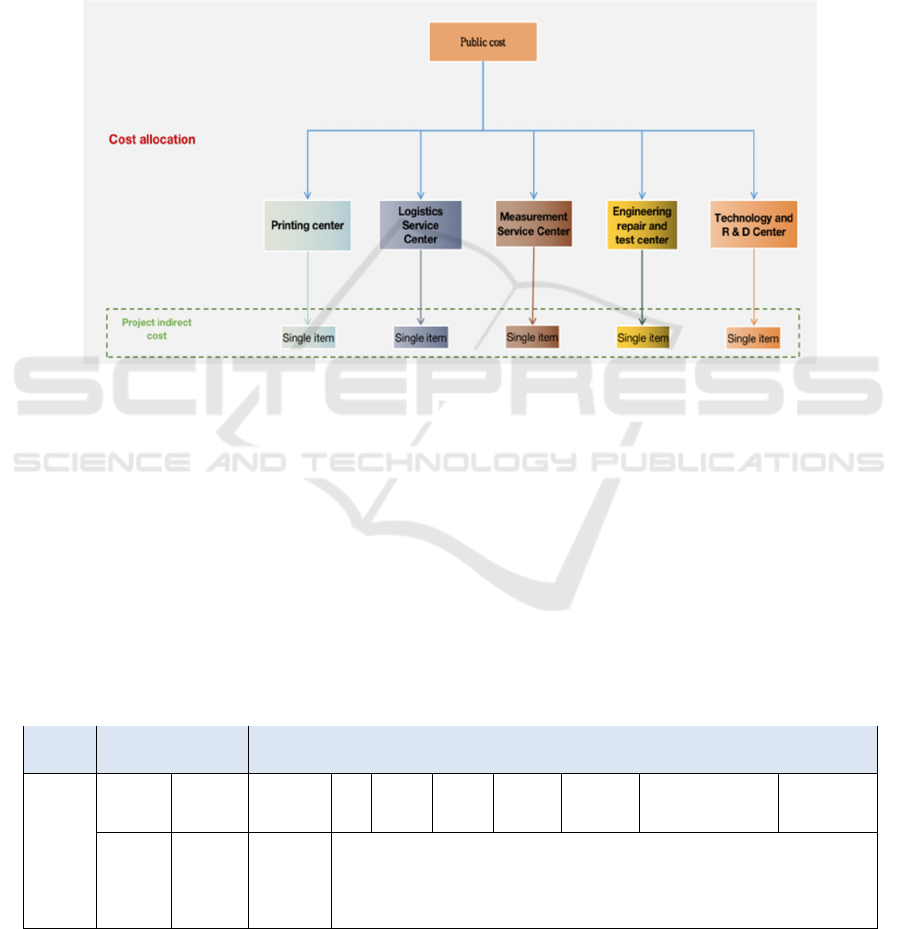
various projects; Public expenses include financial
expenses and asset impairment losses, which are not
accounted for to specific departments. They need to be
split among business departments first and then
allocated to a single item.
2.2.1
General Idea of Cost Allocation
Firstly, the public expenses and the costs incurred by
the public sector are shared among the five business
departments; Secondly, the cost calculated to the
business department is allocated to every single
project, so as to realize the cost accounting at the level
of a single project.
Figure 2:Cost allocation idea.
2.2.2 Cost Allocation Driver Settings at
All Levels
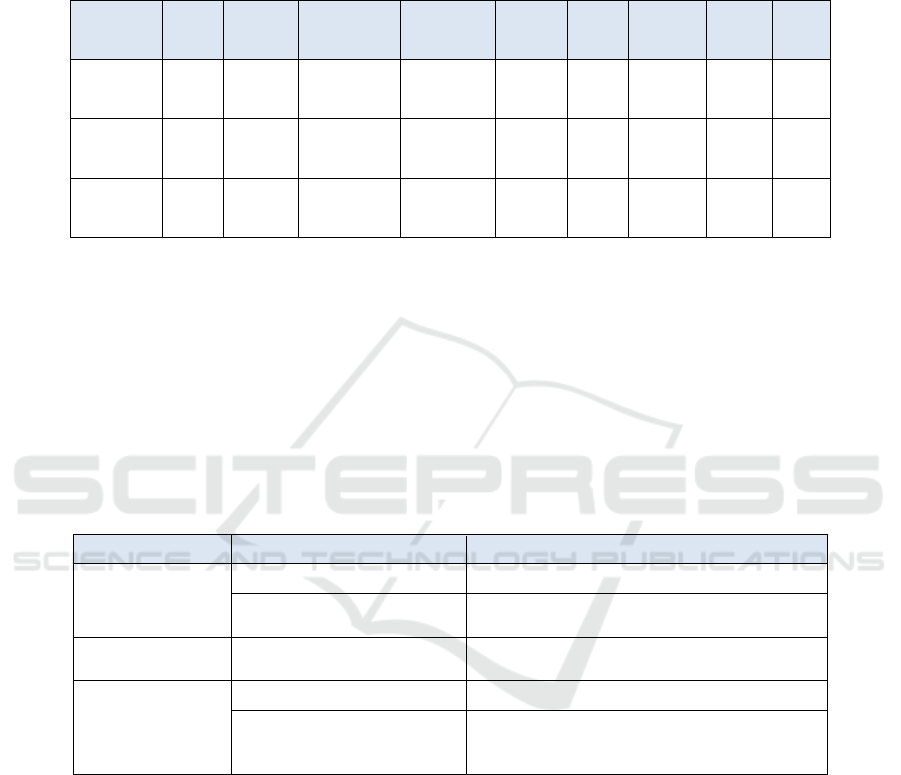
Public expenses and public sector costs: distinguish
different costs and cost drivers, and set allocation
rules. Among them, the depreciation of fixed assets is
apportioned according to the original value ratio of
fixed assets of five business departments; Asset
impairment loss shall be apportioned according to the
proportion of accounts receivable balance of five
business departments; Other expenses shall be
apportioned in proportion to the project income of the
five business departments.
Project indirect cost: when the costs and expenses
that have been calculated to each business department
are allocated among individual projects, the allocation
rules are set according to different costs and expense
drivers. Among them, R & D expenses are only
apportioned among R & D related projects according
to the scale of project income; Other expenses shall be
apportioned according to the income scale of each
project.
Table 2: Public cost sharing motivation.
Allocation
steps
Public expenses Indirect cost
Public
cost
sharing
motivation
Financial
expenses
assets
impairment
loss
depreciation
charge
repair
cost
Office
expenses
Travel
expenses
Labor
protection
fee
Conference
expenses
Business
entertainment
expenses
agency fee
Revenue
scale of
each
department
Accounts
receivable
scale of
each
department
Original
value of
fixed assets
of each
department
Revenue scale of each department
BDEDM 2022 - The International Conference on Big Data Economy and Digital Management
94
2.2.3 Calculation Results
Combined with the combed business type framework
and customer sources, select the projects
implemented by the company in 2020, collect the
project basic data and the company's financial data,
and carry out the benefit calculation of a single
project.
Table 3:Example of benefit calculation results of single project (part).
department
entry
name
Project
type
Business
direction
Customer
source
Project
income
Project
direct
cos
t
Project
indirect
cos
t
Labor
cost
Project
profit
Logistics
Service
Cente
r
Item A
Logistics
services
estate
management
Within the
system
29. 11 2. 00 3. 32 7. 92 15. 86
Logistics
Service
Cente
r
Item B
Logistics
services
estate
management
Within the
system
142. 61 50. 90 16. 28 38. 82 36. 62
Logistics
Service
Cente
r
Item C
Logistics
services
Vehicle service
Within the
system
58. 31 0. 00 6. 66 15. 87 35. 78
2.3 Build the Comprehensive Benefit
Evaluation Model of the Project
2.3.1 Establish the Comprehensive
Benefit Evaluation Index System of
the Project
From the perspective of profitability, development
capacity, and cost structure, the project benefit
evaluation index system is constructed. In terms of
profitability, it mainly focuses on profit scale and
profit margin, which comprehensively reflects the
overall benefit level of the project. The development
capacity mainly refers to the project revenue scale,
reflecting the development space of this kind of
business. The cost structure mainly includes the
project cost scale and the proportion of the direct cost,
reflecting the cost control ability of the project.
Table 4: project benefit evaluation index system.
Index category Detailed indicators Calculation formula
Profitability
Profit scale Average profit of various projects
profit margin
Average profit of various projects/Average
income of the project
Development
capacit
y
Income scale Average income of various projects
cost structure
Cost scale Average cost of various projects
The proportion of direct cost
(
Project direct cost
)
/
(
Project direct
cost+Project indirect cost+Labor cost
)
2.3.2 Indicator Weight Setting and
Scoring Rule Confirmation
The index weight is set according to the importance
of the index, in which the weight of profit scale and
profit margin is 30%, the weight of income scale is
20%, and the weight of cost scale and the direct cost
is 10%.
Analyze the consistency between the change
direction of various indicators and the company's
strategic objectives. The larger the profit scale, profit
margin, and income scale indicators, the smaller the
cost scale indicators in the cost structure, and the
larger the direct cost proportion indicators, the better.
Sort the index values of various projects and take the
sorting number as the index score. Among them, the
larger the index value, the better the index is sorted
according to the larger the value and the larger the
sorting number; The smaller the index value, the
better. The smaller the index value and the larger the
ranking number is, and the index scores of various
projects are calculated.
Research on Management Quality and Efficiency with a Project as the Minimum Value Reflection Unit
95

2.3.3 Use the Evaluation Model for
Comprehensive Scoring
The weighted comprehensive scores of various
indicators of various projects are calculated according
to the weight, and the comprehensive scores are
sorted. The larger the comprehensive score, the
higher the ranking. The top projects are those with
better benefits, which are given priority under the
same conditions.
2.3.4 Case Analysis
Firstly, based on the benefit calculation results of a
single project, calculate the specific indicators such as
project profit, profit margin, project income, project
cost, and the proportion of project direct cost of
various projects.
It can be seen from the calculation results: in
addition to the sporadic printing services of the
printing center, from the perspective of the average
profit scale of the project, the vehicle service project
of the logistics service center has the largest average
profit scale; The second is the measurement
technology service projects of the measurement
service center. In terms of average profit margin, the
top three are the vehicle service of the logistics service
center, the measurement technical service of the
measurement service center, and various projects of
the printing center. The logistics service, material
service, and other profit margins of the measurement
service center are negative. In terms of average sales
revenue, the top three projects are the property
management of the measurement service center, the
property management of the logistics service center,
and the equipment purchase agent of the engineering
repair and test center.
Table 5: Benefit calculation results of various projects.
department Project type Business direction
Profitability
Development
capacity
cost structure
Profit scale profit margin Income scale Cost scale
Proportion of
direct cost
Printing center Printing services
printing 5. 25 16. 58% 36. 93 31. 68 0. 00%
Typesetting
processing
3. 55 16. 58% 25. 00 21. 45 0. 00%
Sporadic printing 34. 07 16. 58% 239. 64 205. 57 0. 00%
Logistics
Service Center
Logistics
services
estate management 18. 69 7. 29% 275. 23 256. 54 58. 55%
Vehicle service 47. 08 158. 83% 76. 72 29. 64 0. 00%
Measurement
Service Center
Measurement
services
Measurement
technology services
19. 19 24. 52% 97. 47 78. 27 47. 91%
Equipment overhaul
and maintenance
0. 31 0. 68% 46. 22 45. 91 57. 88%
Logistics
services
estate management -21. 71 -6. 30% 323. 01 344. 73 60. 92%
Vehicle service -35. 48 -24. 99% 106. 52 142. 01 68. 71%
Material services Retail sales -5. 90 -25. 48% 17. 26 23. 16 68. 92%
other
Other
comprehensive
-5. 49 -20. 91% 20. 77 26. 26 67. 01%
Engineering
repair and test
center
technical service
Detection and
auxiliary services
0. 33 0. 68% 48. 27 47. 94 0. 00%
Rental services
Equipment and
warehouse leasing
0. 46 1. 09% 42. 40 41. 94 0. 00%
Material services
Equipment purchase
agen
t
1. 36 1. 09% 126. 34 124. 98 0. 00%
Technology and
R & D Center
technical service
Technical assistance 0. 49 3. 96% 12. 77 12. 29 0. 00%
R & D 0. 34 3. 96% 8. 96 8. 62 0. 00%
Then, sort and score according to various index
attributes, calculate the comprehensive benefit score
of various projects according to the set index weight
and sort the calculation results in descending order.
The results are shown in the table below.
From the comprehensive score, in addition to the
sporadic printing services of the printing center, the
top three are the vehicle service of the logistics service
center, the measurement technology service of the
measurement service center, and the property
management of the logistics service center. It is
suggested to give priority to these projects under the
constraints of resources.
BDEDM 2022 - The International Conference on Big Data Economy and Digital Management
96
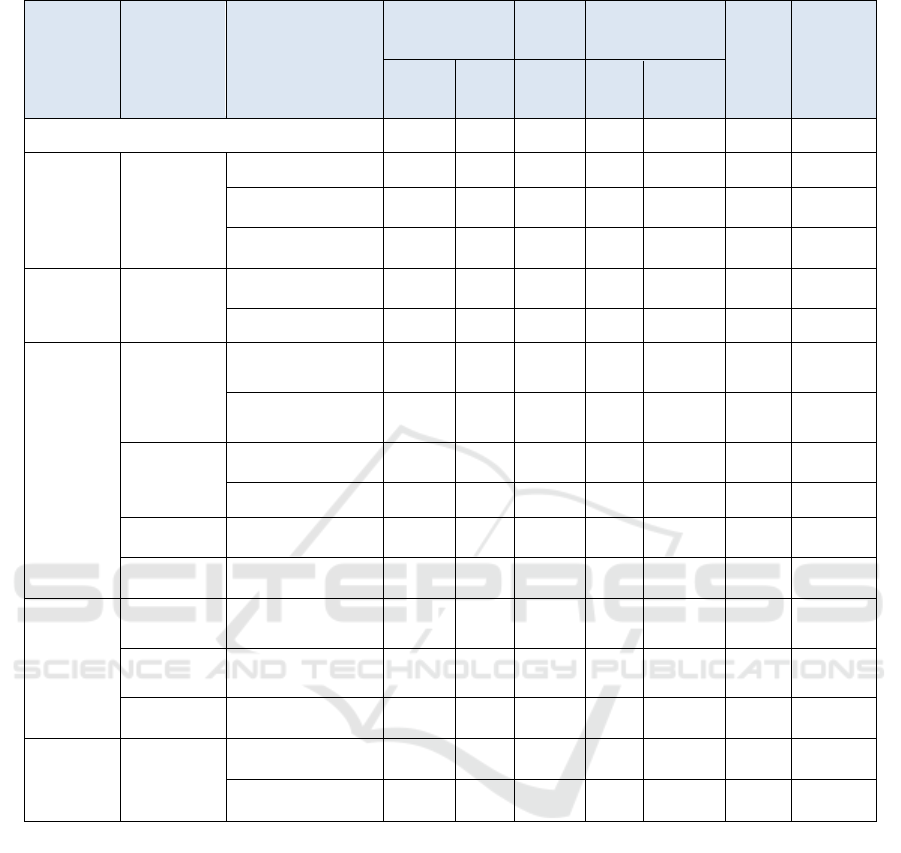
Table 6: Benefit evaluation results of various projects.
department Project type Business direction
Profitability
Developm
ent
capacity
cost structure
Compreh
ensive
score
Comprehens
ive score
ranking
Profit
scale
profit
margin
Income
scale
Cost
scale
Proportion
of direct
cos
t
weight 30% 30% 20% 10% 10% —— ——
Printing
center
Printing
services
printing 12 13 6 8 1 9. 6 5
Typesetting processing 11 13 5 8 1 9. 1 6
Sporadic printing 15 12 14 8 1 11. 8 3
Logistics
Service
Center
Logistics
services
estate management 13 11 15 2 12 11. 6 4
Vehicle service 16 16 10 8 1 12. 5 1
Measurement
Service
Center
Measurement
services
Measurement
technology services
14 15 11 4 10 12. 3 2
Equipment overhaul
and maintenance
5 5 8 5 11 6. 2 12
Logistics
services
estate management 2 4 16 1 13 6. 4 10
Vehicle service 1 2 12 3 15 5. 1 14
Material
services
Retail sales 3 1 3 7 16 4. 1 16
other Other comprehensive 4 3 4 6 14 4. 9 15
Engineering
repair and test
center
technical
service
Detection and auxiliary
services
6 6 9 8 1 6. 3 11
Rental services
Equipment and
warehouse leasing
8 7 7 8 1 6. 8 8
Material
services
Equipment purchase
agen
t
10 8 13 8 1 8. 9 7
Technology
and R & D
Center
technical
service
Technical assistance 9 9 2 8 1 6. 7 9
R & D 7 10 1 8 1 6. 2 12
3 CONCLUSIONS
Firstly, this study studies the rules of project revenue
and expenditure collection and allocation to realize
the accurate calculation of the income of a single
project; Then, considering the profitability,
development ability , and cost control level, establish
the project comprehensive benefit evaluation index
system, build the project comprehensive benefit
evaluation model, carry out comprehensive
evaluation and ranking of various projects, support
project optimization, and provide data support for the
company's resource allocation and the formulation of
market strategy.
REFERENCES
G. Eason, B. Noble, and I. N. Sneddon, “On certain
integrals of Lipschitz-Hankel type involving products
of Bessel functions,” Phil. Trans. Roy. Soc. London,
vol. A247, pp. 529–551, April 1955. (references)
I. S. Jacobs and C. P. Bean, “Fine particles, thin films and
exchange anisotropy,” in Magnetism, vol. III, G. T.
Rado and H. Suhl, Eds. New York: Academic, 1963,
pp. 271–350.
J. Clerk Maxwell, A Treatise on Electricity and Magnetism,
3rd ed., vol. 2. Oxford: Clarendon, 1892, pp. 68–73.
Jian Wu, Jun Lu. Construction and implementation of
power grid smart financial management and control
system based on multi-dimensional lean management
Research on Management Quality and Efficiency with a Project as the Minimum Value Reflection Unit
97

reform[J]. State-owned Enterprise Management,
2020(05): 36-55.
Jing Jun. SC Telecom Precision Marketing Application
Research Based on Customer Insights[J]. China
Enterprise Managemen, 2012(35): 40-41.
R. Nicole, “Title of paper with only first word capitalized,”
J. Name Stand. Abbrev., in press.
Renxin Huang, Lijian Zheng. Evaluation of power grid
benefit based on multi-dimensional lean management
reform[J]. State-owned Enterprise Management,
2019(08): 11-25.
Suidong Li, Shiyou Lin. Multi-dimensional performance
management mechanism with "three-level multi-value
contribution evaluation model" as the core [J]. State-
owned Enterprise Management, 2020(04): 26-45.
Wang Wei, Hu Quangui, sun Saijun, Xu Zhongping, Bi
Yanbing Build a multidimensional Lean quality and
efficiency evaluation system based on the whole process
management of the project [J] Contemporary
accounting, 2021 (05): 181-182.
Xiao Yifei, Hu Nan Construction, and practice of business
quality, efficiency and value management system [J]
Enterprise management, 2020 (S2): 58-59.
BDEDM 2022 - The International Conference on Big Data Economy and Digital Management
98
