
The Impact of M&A on R&D of Electric Utilities
based on Heckman Two-stage Model
Jiming Tian, Tao Shen, Xin Wang and Zhichong Pan
Data Application Branch, Zhejiang Huayun Information Technology Co., Ltd., Jianghui Street, Hangzhou, China
Keywords: M&A, R&D, Electric Utilities, Heckman Two-Step.
Abstract: Electricity industry in China and abroad is undergoing profound changes, which affect the behaviours of
electric utilities in many different ways. This research empirically investigates how mergers and acquisitions
(M&As) between electric utilities affect their incentives to undertake research and development (R&D)
investment. The paper explores an unbalanced panel data set consisting of 125 electric utilities in the United
States during 20 years sample period from 1994 to 2013. The decision to undertake R&D investment is
modelled as a two-stage process. In the first stage, the electric utilities decide whether to invest in R&D at all;
in the second step, the utilities will decide the amount of R&D investment. Heckman two-stage method is
used for estimation. The results show that M&As have some impact on R&D investment by the electric
distribution utilities.
1 INTRODUCTION
With introduction of competition in wholesale and
retail electricity markets, electric utilities are taking
great efforts to adapt to the new conditions and
exploit new opportunities created by changes in
government policies toward the industry. M&A,
which plays an important role in firms’ growth and
competitiveness, have also been a common strategy
in the electric distribution industry. During the years
from 1994 to 2013, 99 deals of M&As were
completed within shareholder-owned electric utilities
in the United States. Innovation has received growing
attention in merger reviews by competition
authorities in Europe and the United States.
Therefore, this paper is dedicated to examine whether
the M&As between electric distribution utilities have
affected their investments in R&D. Two measures of
R&D inputs are of interest in this analysis: R&D
expenditures and R&D intensity.
The rest of the paper is organized as follow.
Section 2 is a literature review on how M&As affect
R&D spending. Section 3 gives a brief theoretical
analysis about the effects of M&As on R&D. Section
4 gives an introduction about M&A and R&D in the
electric utility industry in the United States and
summary statistics of the data used in this paper.
Section 5 presents the methodology used. An
empirical research is conducted based on the data in
the previous section in Section 6, which is followed
by conclusion and suggestion in Section 7.
2 LITERATURE REVIEW
The effects of M&As on R&D spending have been
studied extensively in the R&D-intensive industries
such as pharmacy and high-tech. However, only
limited research has been devoted to examine such
effects in the electricity industry. Of the limited
empirical studies, some have focused on the effects
of liberalization on R&D, and some others have
analysed the drivers of R&D spending.
2.1 Literature in the R&D-intensive
Industry
How M&As affect R&D spending is not conclusive
in the literature. John Kwoka reviewed several
retrospective merger analyses and reported that, in
many cases, retrospective merger studies have found
that mergers resulted in a decrease in innovation
(Kwoka 2014). How horizontal mergers affect
innovation of the merged entity and its non-merging
competitors using data on horizontal mergers among
688
Tian, J., Shen, T., Wang, X. and Pan, Z.
The Impact of MA on RD of Electric Utilities based on Heckman Two-stage Model.
DOI: 10.5220/0011218400003440
In Proceedings of the International Conference on Big Data Economy and Digital Management (BDEDM 2022), pages 688-694
ISBN: 978-989-758-593-7
Copyright
c
2022 by SCITEPRESS – Science and Technology Publications, Lda. All rights reserved

pharmaceutical firms in Europe and applying
propensity score matching estimators. The authors
found that average patenting and R&D of the merged
entity and its rivals declines substantially in post-
merger periods (Haucap, et al, 2019). The impact of
horizontal mergers to monopoly on firms’ incentives
to invest in demand-enhancing innovation is
analysed. The authors find that the overall impact of
a merger on innovation can be either positive or
negative (Bourreau, Jullien, 2018). In contrast,
(Denicolò, Polo, 2018) and (Federico, et al, 2017)
analyse the effect of a merger on product innovation
in a patent-race-like setting in which the scope of
R&D investments has an impact on the probability of
success but not on the value of the innovation.
(Jullien, Lefouili, 2018) discusses the effects of
horizontal mergers on innovation and shows that the
overall impact of a merger on innovation may be
either positive or negative.
2.2 Literature in Electric Utility
Industry
(Salies 2010) studies the determinants of R&D
expenditures in order to provide applied evidence of
the combined effect of size and reforms on innovative
activity by electric utilities. The study is based a
sample of twenty European electric utilities with
annual observations for the period of 1980 to 2007.
The results show that firm size has a positive and
significant effects on utilities’ R&D expenditures. By
including the M&A operation in the model, the
coefficient is positive, though it is not significant. The
author concluded that, by preventing consolidations
of the larger firms, competition commissions may
impede increases in total industry R&D efforts.
(Sanyal, Cohen, 2009) investigates the R&D
behaviour of regulated firms during the transition
period to a competitive environment. Based on the
data from US electricity market from 1990-2000, the
authors analysed the effects of competition,
institutional changes, and political constraints on the
decline in R&D. In the selection equation, the authors
included a dummy to control for pending mergers.
The results show that pending mergers have a
significant and negative impacts on the probability of
firms’ deciding to engage in R&D.
3 THEORETICAL ANALYSIS
3.1 Characteristics of R&D
The unique characteristics of R&D investment make
it difficult to finance (Damanpour 2020). Firstly,
R&D investments are inherently more uncertain.
Innovation is a process of doing something different
and exploring to the unknown world. Due to lack of
the knowledge of details of new technology and
unforeseeable responses from other players in the
market, R&D is manifestly a process of uncertainty
(Jalonen 2012). Secondly, the benefits associated
with R&D investment may not be totally appropriated
by the investors. Knowledge as the output of
innovation activity is partially a non-excludable and
non-rival good. In other words, it is difficult to keep
the knowledge secret. Therefore, private firms tends
to under invest in the production of knowledge since
they could just be able to reap a small share of these
wider benefits. Thirdly, certain R&D projects may be
indivisible and require a large amount of investment
to be implemented by private firms. The issue of
indivisibility occurs when the project cannot be
broken down into smaller, more manageable units. It
means that these projects require a large amount of
up-front cost, which is also known as “fixed-cost”.
The problem of indivisibility could be solved if
capital market works perfectly. However, there are
various reasons to expect that financial market is not
perfect.
3.2 Effects of M&A
M&As may change firms’ innovation incentives and
innovation capabilities in several ways. Firstly,
M&As can create large organizations (Jalonen 2012).
In the absence of fully functioning markets for
innovation, the aggregation of end-product market
enables spreading of the costs of research over a
larger sales base. New technologies such as smart
grid and advanced renewable can save costs and
create environmental benefits; yet producers need
volume to spread the costs of these complex and
expensive fixed assets. This implies that due to cost
spreading, the consolidation of two or more firms can
lead them to undertake R&D projects that were
previously not profitable, thereby increasing the
firms’ incentives to innovate. Secondly, M&A may
improve the firms’ financial capability (Salies 2010).
M&A of electric utilities can lead to significant cost
savings through personnel reduction, purchasing
efficiencies, administrative consolidation, reduction
in corporate overhead, avoided capital expenditures,
The Impact of MA on RD of Electric Utilities based on Heckman Two-stage Model
689
lower cost of capital, stronger credit profile and
improved access to capital. Thirdly, and finally,
combining knowledge bases as a result of M&A
could create new knowledge and enhance firms’
absorptive capabilities, which in turn increases the
utilities’ capabilities to innovate.
4 DATA
The data used this empirical analysis is an unbalanced
panel comprised of 125 electric distribution utilities
in the United States during a period of 20 years from
1994 to 2013. Data used in this paper are compiled
from various sources. The data on investments in
R&D are collected from FERC Form One. The
investment means expenditure incurred by public
utilities in pursuing research, development, and
demonstration activities including experiment,
design, installation, construction, or operation. It
includes expenditures for the implementation or
development of new and/or existing concepts until
technically feasible and commercially feasible
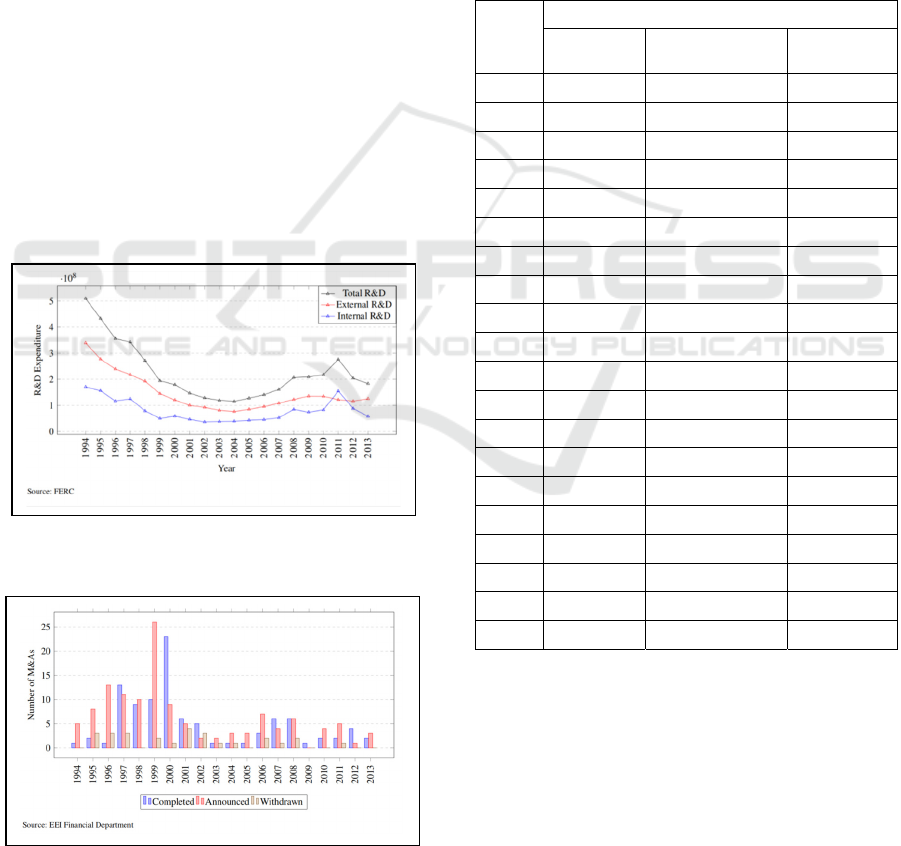
operations are verified. Figure 1 shows the
total R&D,
external R&D and internal R&D spending and Table
1 shows the descriptive statistics.
Figure 1. R&D by Investor-Owned Electric Utilities in the
United States (1994-2003).
Figure 2. M&A of Investor-Owned Electric Utilities in the
United States (1994-2003).
The information on mergers is taken from a
compilation of Edison Electric Institute (EEI). M&A
activity is defined as mergers and acquisitions of
whole operating company with a regulated service
territory. EEI provides a list of mergers including the
information about the identity of the merging utilities,
merging status (i.e. withdrawn, pending, completed),
dates of merger announcement and completion, terms
of deals, merger types (i.e. merger between electric
utilities, merger between electric utility and
independent power producers, merger between
electric and gas utilities, etc.). This study focuses on
the mergers between electric utilities.
Table 1: R&D data descriptive statistics.
Year
Total R&D Expenditure and Intensity
a
bservations
R
&D Expenditure
&D Intensity
1994
2344
5588919 2.813
1995
2344 4569815 2.327
1996
2344 3685858 1.864
1997
2344 3456409 1.707
1998
2344 2592725 1.412
1999
2344 1858286 1.050
2000
2344 1660128 0.902
2001
2344 1323394 0.605
2002
2344 1168754 0.640
2003
2344 1058668 0.565
2004
2344 995829 0.540
2005
2344 1058073 0.534
2006
2344 1133133 0.598
2007
2344 1294190 0.670
2008
2344 1609265 0.818
2009
2344 1618904 0.736
2010
2344 1694890 0.793
2011
2344 2079458 1.360
2012
2344 1488672 1.000
2013
2344 1369218 0.673
5 METHODOLOGY
When modelling the impact of M&A on R&D
spending, a crucial factor that should be considered is
the mixed discrete-continuous dependent variable.
That is, a significant proportion of the R&D spending
data takes zero values and the rest are continuously
distributed.
BDEDM 2022 - The International Conference on Big Data Economy and Digital Management
690
The model consists of two equations. The first
equation determines whether the firm will be engaged
in research activities; the second equation accounts
for the expenditure or intensity of these activities
(Wooldridge 2010). Suppose, in each year, a utility
decides whether to invest in R&D or not. If the
associated benefit from the investment is positive, the
utility will make positive investment, otherwise the
utility will make zero investment. The benefit of such
investment is a latent variable that is not observable.
But it may include the intangible benefits of
complying to regulatory rules. The decision equation
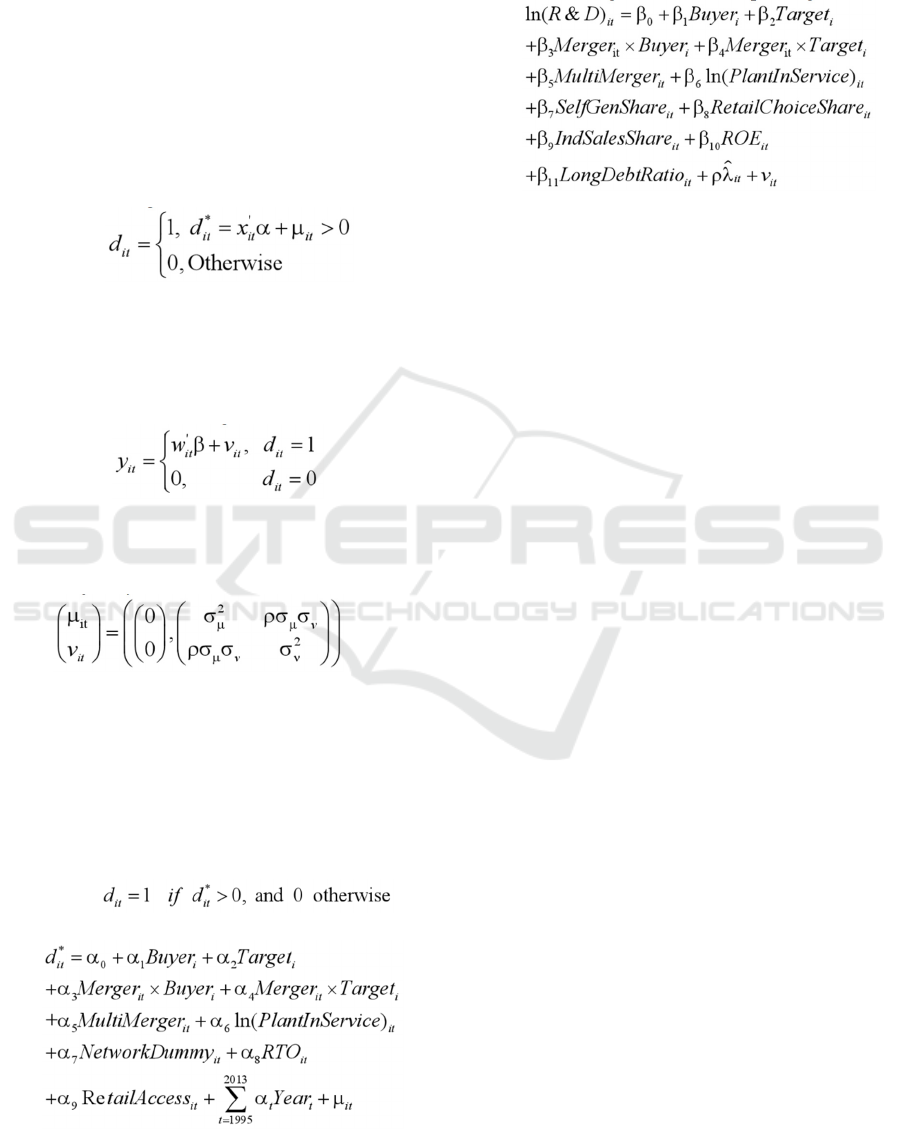
takes the following form:
(1)
where 𝑑
∗
is a latent variable, 𝜇
is the error term,
𝑥
is vector of exogenous explanatory variables.
This second equation is to examine the factors that
influence the level of R&D input, which is denoted
by the R&D expenditure and R&D intensity. The
equation takes the following form:
(2)
where 𝑣
is the error term, 𝑤
is vector of
exogenous explanatory variables.
It is assumed that the disturbances in the two
equations jointly follow normal distribution. That is,
(3)
6 EMPIRICAL
IMPLIMENTATION
6.1 Empirical Model Specification
Stage 1: Selection Model
(4)
(5)
Stage 2: Level Model:
Given that the utility has decided to undertake R&D
investment, this stage investigates the factors that
influence the magnitude of R&D spending.
(6)
The dependent variable is natural logarithm of
positive R&D spending or R&D intensity.
In this model, 𝑖 indexed the regulated electric
distribution utilities, and 𝑡 indexes the years. The
dependent variable is the natural logarithm of R&D
expenditure, which is measured in 2005 dollars, or
R&D intensity. Buyer denotes the subset of utilities
who are buyers in M&As. It takes the value of 1for
the entire time period if a utility is a buyer in a
merger. Similarly, Target denotes the subset of
utilities who are targets in M&As. It takes the value
of 1 for the entire period if a utility is a target in a
merger. All observations on non-merging utilities
constitute the control group. Merger is a dummy
variable. If a utility involved in a merger in year t, the
dummy will take the value of 1 in year t and
thereafter. The inclusion of MergerBuyer and
MergerTarget permits the evaluation of different
effects for buyers and targets. MultiMerger is a
dummy variable taking on a value of 1 for the years
subsequent to any second merger by utilities during
this period. The inclusion of inverse mills ratios
(IMR, 𝜆
) is to account for the selection effect. 𝜆
is
calculated based on the probit equation of the first
stage.
6.2 Estimation and Results
Table 2 shows the results derived from a pooled
probit regression, which is added with year dummies.
Column (a) compares all buyers to non-merging
utilities, while Column (b) compares all targets to
non-merging utilities. Column (c) shows the
estimation results with all observations. I find that
both state regulation and utility characteristics have
important impact on the decision to undertake R&D
investment. Retail access has a significant negative
impact on the decision to undertake R&D investment.
This variable may be picking up the effects of
competition. The competition pressures may induce
the electric distribution utilities to reduce costs by
disengage themselves from R&D investment.
The Impact of MA on RD of Electric Utilities based on Heckman Two-stage Model
691

Table 2: The Decision to Undertake R&D Investment.
Variable
Models
a,b,c
Buyer vs. Base
(a)
Target vs. Base
(b)
B&T vs. Base
(c)
Buyer
0.636
[0.478]
0.702
[0.476]
Target
-0.104
[0.330]
-0.035
[0.308]
MergerBuyer
0.162
[0.322]
0.133
[0.346]
MergerTarget
0.363
[0.298]
0.304
[0.298]
MultiMerger
-0.666
[0.487]
-0.410
[0.392]
-0.572
*
[0.304]
Ln(PlantInService
)
0.453∗∗∗
[0.093]
0.445∗∗∗
[0.092]
0.421∗∗∗
[0.079]
N
etwork Dummy
0.522
[0.341]
0.169
[0.313]
0.234
[0.252]
RTO
0.287
[0.253]
0.190
[0.244]
0.206
[0.216]
RetailAccess
-0.505∗
[0.289]
-0.514∗
[0.290]
-0.476∗∗
[0.242]
Constant
-9.184∗∗∗
[1.937]
-8.931∗∗∗
[1.925]
-8.429∗∗∗
[1.648]
Years
Yes Yes Yes
Observations
1833 1705 2344
Pseudo R
2
0.249 0.215 0.224
Wald (Chi-
squared)
140.255
88.525 101.006
a. Standard errors in brackets; b. ∗ p < 0.10, ∗∗ p < 0.05, ∗∗∗ p < 0.01
The coefficients on Buyers is positive and that on
Target is negative, but both are not significant in all
three models. The positive sign means those utilities
are more likely to undertake R&D, and the negative
sign means those utilities are less likely to undertake
R&D. However, both of them are not significant and
show that Buyers and Target are as likely to
undertake R&D as those that did not involve in
M&As during the sample period.
The coefficients of the interaction terms
MergerBuyer and MergerTarget are both positive in
all three models. The positive sign means that M&As
will increase the probabilities of buyers and targets to
undertake R&D investment. However, the
coefficients are not significant and I would rather to
believe that M&As have no impact on the utilities’
decision to invest in R&D. The coefficient on
MultiMerger is negative in all three models and
significant at 10 percent level in Column (c). The
negative sign means that frequent M&As would
reduce the probabilities of the utilities to invest in
R&D. Since the coefficient is significant in Column
(c), it shows that frequent M&As have distracted the
management’s attention from inner development and
have negative impact on the decisions to undertake
R&D investment.
Table 3: The Decision on the Level of R&D investment.
Variable
Models
a,b,c
Buyer vs.
Base
(a)
Target vs.
Base
(b)
B&T vs. Base
(c)
Buyer
-0.179
[0.300]
-0.561∗
[0.288]
Target
-0.805*
[0.369]
-0.529
[0.323]
MergerBuyer
-0.095
[0.242]
-0.037
[0.234]
MergerTarget
-0.295
[0.282]
-0.317
[0.260]
MultiMerger
-0.363
[0.304]
0.304
[0.406]
-0.021
[0.250]
Ln(PlantInService)
0.470∗∗∗
[0.122]
0.247∗
[0.136]
0.472∗∗∗
[0.111]
SelfGenShare
0.027∗∗∗
[0.004]
0.019***
[0.004]
0.024***
[0.003]
RetailChoiceShare
-0.007
[0.006]
-
0.026***
[0.009]
-
0.018***
[0.006]
IndSalesShare
0.018∗∗∗
[0.005]
0.018∗∗∗
[0.006]
0.015∗∗*
[0.005]
ROE
0.008
[0.009]
-0.003
[0.011]
0.001
[0.009]
LongDebtRatio
-0.012
[0.012]
-0.014
[0.017]
-0.018
[0.013]
IMR
-
1.429***
[0.427]
-
1.799***
[0.435]
-
1.656***
[0.399]
Constant
3.147
2.745
9.113***
[3.132]
3.829
[2.551]
States
Yes Yes Yes
Observations
1341 1146 1709
Pseudo R
2
0.677 0.580 0.616
a. Standard errors in brackets; b. ∗ p < 0.10, ∗∗ p < 0.05, ∗∗∗ p < 0.01.
Table 3 shows the estimation results of
determination on the level of R&D investment once
undertaking R&D has been decided. The second
stage equation is estimated using a pooled OLS
model as suggest by (Wooldridge 2010). Dummies
for states are included to control for the state fixed-
effects. The coefficient on ln (PlantInService) is
positive in all three models. The coefficient is
positive in Column (a) and Column (c) at 1 percent
level, and significant at 10 percent level in Column
(b). The positive sign means that large utilities tend
to invest more in R&D once the decision to undertake
R&D has been made. Since the coefficient is
significant in all three models, it show that utility size
not only positively affect the probability to undertake
BDEDM 2022 - The International Conference on Big Data Economy and Digital Management
692

R&D but also positively affect the magnitude of
R&D investment. Particularly, 1% increase in
distribution plant will increase the amount of R&D
investment by 0.24-0.47 percent.
The coefficient on IMR is negative and significant
at 1 percent level in all three models, indicating the
existence of selection. That is, some electric utilities
made no investment in R&D because of their
management strategies. This finding has an important
policy implementation. That is, the government or
regulator could come out with some appropriate
policies to induce or force the utilities to undertake
R&D investment. However, this does not mean that
increase in R&D investment is necessary. To
determine the optimal level of R&D investment of the
industry requires further research.
Table 4: The decision on the level of R&D intensity.
Variable
Models
a,b,c
Buyer vs. Base
(a)
Target vs. Base
(b)
B&T vs. Base
(c)
Buyer
-0.623*
[ 0.346]
-0.840**
[0.363]
Target
-1.050
∗
[0.570]
-0.432
[0.395]
MergerBuyer
-0.230
[0.245]
-0.259
[0.229]
MergerTarget
-0.135
[0.570]
-0.062
[0.563]
MultiMerger
-0.576
[0.535]
0.072
[0.431]
-0.180
[0.295]
Ln(PlantInService
)
-0.525∗∗∗
[0.124]
-0.654 ∗∗
∗
[0.139]
-0.486∗∗∗
[0.106]
SelfGenShare
0.020∗∗∗
[0.003]
0.020∗∗∗
[0.007]
0.019∗∗∗
[0.004]
RetailChoiceShar
e
-0.003
[0.005]
-0.010
[0.009]
-0.008
[0.005]
IndSalesShare
0.013∗
[0.007]
0.015∗∗
[0.006]
0.013∗
[0.007]
ROE
-0.015
[0.009]
-0.009
[0.011]
-0.007
[0.010]
LongDebtRatio
-0.017∗
[0.010]
0.004
[0.013]
-0.015∗
[0.008]
IMR
-1.900∗∗∗
[0.474]
-1.853 ∗∗
∗
[0.557]
-1.801∗∗∗
[0.465]
Constant
12.787∗∗∗
[2.841]
14.753 ∗∗
∗
[3.685]
11.779∗∗∗
[2.504]
States
Yes Yes Yes
Observations
1341 1146 1709
Pseudo R
2
0.449 0.258 0.232
a. Standard errors in brackets; b. ∗ p < 0.10, ∗∗ p < 0.05, ∗∗∗ p < 0.01
Table 4 shows the results of the impact of M&As
on R&D intensity. The results are similar as those in
Table 3. The coefficients on Buyer and Target are
negative in all three models. The coefficient on Buyer
is significant at 10 percent level in Column (a) and
significant at 5 percent level in Column (c). The
coefficient on Target is significant at 10 percent level
in Column (b). The negative sign means that the R&D
intensities for buyers and targets are lower than those
utilities who did not involve in M&As during the
sample period. Since the coefficients on Buyer and
Target are significant in Column (a) and (c) and
Column (b) respectively, there is some evidence that
the utilities that were involved into M&As during the
sample period are those with lower level of R&D
intensity.
The coefficient on the interaction terms of
MergerBuyer and MergerTarget are negative in all
three models. However, none of them are significant.
The negative sign means that involvement in M&As
tends to reduce R&D intensity for both buyers and
targets. Since the coefficients are insignificant, it
shows that M&As have not significantly affected
R&D intensity. The coefficient on MultiMerger is
negative is Column (a) and (c), but negative in
Column (b). None of them are significant at
traditional confidence levels. Therefore, multiple
mergers have no significant impact on R&D
intensity.
7 CONCLUSIONS
The empirical analysis explores an unbalanced panel
dataset consisting of 125 electric utilities during 20
years sample period from 1994 to 2013. The decision
to undertake R&D investment is modelled as a two-
stage process. In the first stage, the electric utilities
decide whether to invest in R&D at all; in the second
stage, the utilities will decide the amount of R&D
investment. Heckman style two-stage method is used
for estimation. Based on the analyses, it comes to the
conclusions. The utilities that were involved into
M&As during the sample period were as likely to
undertake R&D investment as non-merging utilities.
But the amount of R&D investment and R&D
intensity were lower for the merging utilities than
non-merging utilities. There is some evidence that
multiple mergers negatively affected the utilities’
probabilities to undertake R&D. But multiple-
mergers had no significant impact on the amount of
R&D investment and R&D intensity.
The Impact of MA on RD of Electric Utilities based on Heckman Two-stage Model
693

REFERENCES
Bourreau, M. & Jullien, B. 2018. Mergers, investments and
demand expansion. Economics Letters, 167(136-141.
Damanpour, F. 2020. Organizational innovation: Theory,
research, and direction: Edward Elgar Publishing.
Denicolò, V. & Polo, M. 2018. Duplicative research,
mergers and innovation. Economics Letters, 166(56-
59.
Federico, G., Langus, G. & Valletti, T. 2017. A simple
model of mergers and innovation. Economics Letters,
157(136-140.
Haucap, J., Rasch, A. & Stiebale, J. 2019. How mergers
affect innovation: Theory and evidence. International
Journal of Industrial Organization, 63(283-325.
Jalonen, H. 2012. The uncertainty of innovation: a
systematic review of the literature. Journal of
management research, 4(1), pp 1.
Jullien, B. & Lefouili, Y. 2018. Horizontal mergers and
innovation. Journal of Competition Law & Economics,
14(3), pp 364-392.
Kwoka, J. 2014. Mergers, merger control, and remedies: A
retrospective analysis of US policy: Mit Press.
Salies, E. 2010. A test of the Schumpeterian hypothesis in
a panel of European electric utilities. Innovation,
Economic Growth and the Firm. Edward Elgar
Publishing.
Sanyal, P. & Cohen, L. R. 2009. Powering progress:
Restructuring, competition, and R&D in the US electric
utility industry. The Energy Journal, 30(2), pp.
Wooldridge, J. M. 2010. Econometric analysis of cross
section and panel data: MIT press.
BDEDM 2022 - The International Conference on Big Data Economy and Digital Management
694
