
Analysis of Regional Comparative Advantage and Its Driving Factors
of Manufacturing Industry:Based on the Panel Data of
Manufacturing Industry in Chongqing
Changlin Wang and Tong Mu
School of Business Administration, Chongqing University of Science & Technology, Chongqing, China
Keywords: Regional Comparative Advantage, Manufacturing Industry, Driving Factor, Chongqing.
Abstract: Based on the revealed comparative advantage index, this paper constructs the industrial regional comparative
advantage index, and constructs the econometric model of manufacturing industrial regional comparative
advantage including labor, capital, and technological factors, etc. Based on the panel data analysis of
Chongqing manufacturing industry and its sub-industry, it is concluded that labor factor contributes
significantly to the regional comparative advantage of Chongqing manufacturing industry, while technical
factor and capital factor have limited and insignificant effects. However, there are significant differences
among labor factor, technical factor and capital factor in the driving force of regional comparative advantage
in different industries. The difference of industries indicates that relying on labor factor to drive the regional
comparative advantage of Chongqing manufacturing industry has diminishing marginal effect, so the
improvement of regional comparative advantage must be realized by implementing innovation strategy based
on technological progress.
1 INTRODUCTION
The theory of comparative advantage originated from
international trade has been widely used in regional
economic analysis and industrial upgrading analysis
in recent years (Wang, Zhang, 2018, Chen, et al,
2018, Zhang, et al., 2018, Zhao, Chen, 2020). Earlier,
R. Hausman of Harvard University (2003) proposed
an evolution theory of comparative advantage based
on the theory of comparative advantage. According
to the theory, the upgrading of products from simple
to complex is the evolution and development process
of comparative advantage, and such upgrading path
is closely related to the initial industrial structure and
comparative advantage (Hausmann, Rodrik, 2003,
Hidalgo, et al., 2007, Wu, Zhang, 2012, Wang, 2013).
Some Chinese scholars also used the theory of
comparative advantage to conduct in-depth studies on
China's industrial transfer, industrial transformation
and upgrading. For example, Wang Tuzhan and
Zhang Yue (Wang, Zhang, 2018) analyzed the space-
time evolution of China's regional manufacturing
comparative advantage by establishing the
mechanism of explicit and potential comparative
advantage (Wang, Zhang 2018). Chen Guosheng et
al. (2018) analyzed the comprehensive effect of
comparative advantage and competitive advantage on
China's manufacturing industry transfer by using
panel data (Chen, et al., 2018).
China is in the process of transformation and
upgrading from a manufacturing giant into a
manufacturing power, but there are obvious
differences among different regions in the
development path of manufacturing industry
upgrading. Chongqing, an important manufacturing
city in western China, experienced an obvious decline
in economic growth around 2018, especially in the
growth of industrial added value of the manufacturing
industry. In order to solve this problem, this paper
will construct the industrial regional comparative
advantage index and the measurement model of
manufacturing regional comparative advantage,
combined with the panel data of Chongqing
manufacturing industry, analyzes the temporal and
spatial changes of Chongqing manufacturing industry
regional comparative advantage, and deeply analyzes
the driving factors of Chongqing manufacturing
industry and regional comparative advantage in
various industries.
Wang, C. and Mu, T.
Analysis of Regional Comparative Advantage and its Driving Factors of Manufacturing Industry: Based on the Panel Data of Manufacturing Industry in Chongqing.
DOI: 10.5220/0011231900003440
In Proceedings of the International Conference on Big Data Economy and Digital Management (BDEDM 2022), pages 695-701
ISBN: 978-989-758-593-7
Copyright
c
2022 by SCITEPRESS – Science and Technology Publications, Lda. All rights reserved
695

2 RESEARCH DESIGN
2.1 Industrial Regional Comparative
Advantage Index
Balassa, an American economist, put forward the
RCA index (Revealed Comparative Advantage Index)
in 1965. Reference the concept and connotation of
RCA index, and existing research results (Wang,
Zhang, 2018, Chen, et al., 2018, Zhang et al., 2018),
we constructed the industrial regional comparative
advantage index as follows:
DCAij=(Hij/Yi)/(Hj/Y) (1)
The above formula represents the ratio between
the share of industry j in region i in the regional total
output and the share of industry j in the national total
economic output. In the formula, DCAij Represents
the index of regional comparative advantage of
industry j in region i, Hij Represents the industrial
added value of industry j in region i, Hj Represents
industrial added value of China's J industry, Yi
Represents the gross domestic product of region i,
and Y represents the gross domestic product of China.
DCA and RCA have the same meaning, that is, when
DCA value is greater than 2.50, an industry has a
strong comparative advantage; when DCA value is
between 0.80 and 1.25, an industry has a medium
comparative advantage; when DCA value is below
0.8, it is at a comparative disadvantage.
2.2 Econometric Model of Industrial
Regional Comparative Advantage
There have been analysis and research on the
measurement of industrial comparative advantage,
most of which are based on Cobb-Douglas production
function to construct an econometric model to
analyze the influence of various factors such as labor
factors and capital factors on industrial comparative
advantage. For example, Liu Wei and Liu Guozhen
(2015) used Cobb-Douglas production function to
construct an econometric model of regional industrial
comparative advantage of labor, capital, foreign
capital and technological factors (Liu, Liu, 2015).
Zhang Yue et al. (2018) constructed an econometric
model of comparative advantage based on traditional
international trade theories such as Heckschel-Ohlin
(HO) theory and Porter's competitive advantage
theory (Zhang, et al., 2018).Wang Tuzhan and Zhang
Yue (2018) pointed out that technological level,
factor endowment, economies of scale,
agglomeration effect and institutional factors are all
important sources of explicit comparative advantage
of regional manufacturing (Wang, Zhang, 2018).
Based on Cobb-Douglas production function and
traditional international trade theories such as
Heckschel-Ohlin (HO) theory, and based on existing
research results, this paper establishes an econometric
model of industrial regional comparative advantage
based on the sources of traditional comparative
advantage including capital, labor and technological
progress, as follows:
DCAit =a +αLit+βKit+γTEit +ξi (2)
The model represents the driving factors of the
regional comparative advantage of i industry in period
t, and ξ represents other disturbances. The model
mainly investigates the influence of each driving
factor on the change of industrial location comparative
advantage, Kit is the index of capital factor, indicating
the capital input of i industry in period t. Lit is the
labor factor index, indicating the annual labor input of
industry i in period t. Technical factor index TEit is
the change of the technological level of i industry in
period t. This paper uses the method of total labor
productivity for technical factor to comprehensively
reflect the relative level of the regional manufacturing
industry and the production technology, operation and
management, technical proficiency and labor
enthusiasm of the employees in all local industries
(Wang and Zhang 2018, Zhang et al. 2018, Liu and
Liu 2015).
3 DATA DESCRIPTION
The sample data is from the "China Statistical
Yearbook", "China Industrial Economic Statistical
Yearbook" and "Chongqing Statistical Yearbook"
over the years. The selected manufacturing sub
industries are selected according to the national
economic industry classification standard of the
National Bureau of Statistics of China, and 25
manufacturing sub industries are selected according to
the availability of data. The statistical data of each
manufacturing sub industry is from the statistical data
of industrial enterprises above designated size from
2008 to 2018. From the collected data of
manufacturing sub industries in Chongqing, there is
only statistical data of transportation equipment
manufacturing industry from 2008 to 2011, while
from 2012 to 2018, it is divided into two industries,
namely automobile manufacturing industry and
railway, ship aerospace and other transportation
equipment manufacturing industry, in order to unify
data analysis, the data from 2012 to 2018 is integrated
BDEDM 2022 - The International Conference on Big Data Economy and Digital Management
696
into the data of transportation equipment
manufacturing industry for analysis and processing.
Through the comparative analysis of the statistical
data caliber of Chongqing in different periods, we can
find the industrial added value of manufacturing sub
industries from 2008 to 2011. There is a lack of
statistical data on the industrial added value of
manufacturing sub industries from 2012 to 2018.
Therefore, for some years it’s calculated from the
industrial added value of manufacturing sub industries
in the previous year, as well as the annual price index
and growth rate of industrial added value of
manufacturing sub industries. For the years from 2012
to 2018 when there is no data on the growth rate of
industrial added value of manufacturing sub
industries, the industrial added value production
method is used for estimation, that is, from the
perspective of the formation of the value of products
and labor services in the process of industrial
production, the value of intermediate inputs in the
production process is excluded, so as to we obtain the
industrial added value of each industry in the current
year. The labor factor index collects the average
number of employees in each industry in that year.
The capital factor index collects the paid-in capital of
each industry in the current year. For technical factors,
the total labor productivity of each industry in the
current year is collected. For the lack of data of the
total labor productivity of each industry in Chongqing
in some years from 2008 to 2018, the industrial added
value of each industry in the current year was divided
by the average number of employees in each industry
in the current year. In the model, all explanatory
variables are logarithmic processed with the original
data, namely:
Kit=LN (paid-in capital of i industry in period t)
Lit=LN (average annual labor input to industry i in
period t)
TEit=LN (Total labor productivity of industry i in
period t)
4 DATA ANALYSIS
4.1 Industrial Regional Comparative
Advantage
This paper uses the concept and connotation of the
explicit comparative advantage index to construct the
industrial regional comparative advantage index. The
industrial regional comparative advantage index
represents the ratio of the share of an industry in the
regional total output to the share of the industry in the
national total economic output. Through data
collection and analysis, the typical industrial regional
comparative advantage of Chongqing's manufacturing
industry and its sub sectors is shown in Table 1. The
analysis results show that the overall regional
comparative advantage of Chongqing's manufacturing
industry in each year from 2008 to 2018 is less than 1,
reaching the highest value of 0.8542 in 2015, showing
a weak trend of manufacturing regional comparative
advantage. The overall regional comparative
advantage of manufacturing industry increased from
0.6005 in 2008 to 0.657 in 2018, indicating that the
regional comparative advantage of manufacturing
industry has improved somewhat. In terms of the
development trend of Chongqing's manufacturing
regional comparative advantage, the manufacturing
regional comparative advantage increased from
0.6005 in 2008 to 0.8542 in 2016, but declined to
0.6826 in 2017 and 0.6570 in 2018, showing an
inverted "U" structure to a certain extent (as shown in
Figure 1).Specific to manufacturing sub industries, the
development trend of regional comparative advantage
is also different.
Table 1: Manufacturing industry regional comparative advantage in Chongqing.
industry 2008 2009 2010 2011 2012 2013 2014 2015 2016 2017 2018
HY0 0.6005 0.6598 0.6784 0.6767 0.6604 0.7015 0.7560 0.8241 0.8542 0.6826 0.6570
HY1 0.4515 0.4767 0.5249 0.5130 0.4952 0.5043 0.5404 0.5885 0.6404 0.5068 0.4593
HY2 0.4100 0.4502 0.4655 0.4329 0.3778 0.4218 0.4302 0.4610 0.4543 0.4055 0.3538
HY3 0.9238 0.9001 0.8843 0.8382 0.8348 0.8279 0.8015 0.7062 0.6104 0.6533 0.9536
HY4 0.2437 0.3118 0.3075 0.2606 0.2478 0.2396 0.2173 0.2097 0.2029 0.1009 0.0556
HY5 0.1316 0.1221 0.1569 0.2138 0.2126 0.2232 0.2419 0.2369 0.2130 0.1458 0.1108
HY6 0.3307 0.3296 0.3678 0.4953 0.4909 0.5304 0.5331 0.5367 0.5790 0.4904 0.4701
HY7 0.0801 0.0959 0.1211 0.1361 0.1169 0.1349 0.1947 0.2651 0.2818 0.3238 0.3424
HY8 0.4406 0.5639 0.5132 0.5894 0.5297 0.5887 0.5359 0.3767 0.4144 0.3829 0.4158
HY9 0.3784 0.5396 0.6814 0.5223 0.6348 0.7171 0.7938 0.8196 0.8249 0.6964 0.7989
HY10 0.6795 0.7819 0.8047 0.7833 0.7317 0.7958 0.9052 1.0055 0.8860 0.6972 0.7348
HY11 0.0717 0.1035 0.0773 0.0659 0.0696 0.0581 0.0706 0.0858 0.0818 0.0553 0.0671
HY12 0.5561 0.5623 0.5757 0.5858 0.4940 0.4519 0.4432 0.4595 0.4480 0.3488 0.3553
Analysis of Regional Comparative Advantage and its Driving Factors of Manufacturing Industry: Based on the Panel Data of Manufacturing
Industry in Chongqing
697
HY13 0.9482 0.9299 0.7902 0.7107 0.6859 0.7038 0.7243 0.8824 0.8981 0.6828 0.6521
HY14 0.0623 0.0742 0.0730 0.0533 0.0166 0.0327 0.0354 0.0632 0.0928 0.1313 0.1217
HY15 0.3089 0.3762 0.4174 0.5112 0.5865 0.6476 0.6462 0.6671 0.7237 0.6340 0.5102
HY16 0.7023 0.6909 0.7462 0.7299 0.7028 0.7203 0.7605 0.8100 0.8244 0.6250 0.6789
HY17 0.3770 0.3764 0.4923 0.5517 0.4542 0.4698 0.4692 0.4893 0.4043 0.2602 0.3317
HY18 0.8648 0.7896 0.7405 0.6484 0.5852 0.5920 0.6475 0.6887 0.6875 0.5453 0.4600
HY19 0.3063 0.3562 0.4144 0.5794 0.4995 0.5073 0.5670 0.6680 0.6914 0.4392 0.4590
HY20 0.5224 0.6561 0.6411 0.5235 0.4967 0.5063 0.5537 0.6093 0.6816 0.5871 0.5822
HY21 0.4167 0.5158 0.5128 0.3729 0.3085 0.3859 0.4166 0.4707 0.5380 0.3850 0.3879
HY22 3.0335 2.9579 2.7291 2.6890 2.6366 2.7617 2.8292 2.9108 2.9000 2.1655 1.8328
HY23 0.5010 0.5391 0.5993 0.6418 0.6500 0.5923 0.6359 0.6826 0.6497 0.4988 0.4553
HY24 0.0888 0.1232 0.2060 0.6282 0.9848 1.2458 1.4991 1.5501 1.6992 1.5796 1.6440
HY25 0.7606 0.7879 0.9185 0.7256 0.9233 0.8263 0.8424 0.8055 0.7424 0.6324 0.5555
Data source: According to the original data collation calculation. Industry Code Description : HY0: Manufacturing industry;HY1:
Agricultural and sideline food processing industry; HY2: Food manufacturing; HY3: Tobacco products industry; HY4: Textile industry; HY5:
Textile clothing, shoes and hats manufacturing; HY6: Leather, fur, feather (feather) and its products; HY7: Wood processing and wood,
bamboo, rattan, palm and grass products; HY8: Furniture manufacturing; HY9: Paper and paper products industry; HY10: printing and
recording media; HY11: Petroleum processing, coking and nuclear fuel processing industry; HY12: Manufacturing of chemical raw materials
and chemical products; HY13: Pharmaceutical manufacturing; HY14: Chemical fiber manufacturing; HY15: Rubber products industry;
HY16: Non-metallic mineral products industry; HY17: Ferrous metal smelting and rolling processing industry; HY18: Non-ferrous metal
smelting and rolling processing industry; HY19: Metal products industry; HY20: General equipment manufacturing; HY21: Manufacturing
of special equipment; HY22: Manufacturing of transportation equipment; HY23: Electrical machinery and Equipment manufacturing; HY24:
Communication equipment, computer and other electronic equipment manufacturing; HY25: Instrument and cultural and office machinery
manufacturing.(HY1-HY25 are for manufacturing sub industries).
4.1.1 Manufacturing Sub Industry Analysis
with Strong Regional Comparative
Advantage
From 2008 to 2018, the manufacturing sub industries
with strong regional comparative advantage in
Chongqing are transportation equipment
manufacturing and communication equipment,
computer and other electronic equipment
manufacturing. From the perspective of development
trend, the regional comparative advantage of
transportation equipment manufacturing decreased
year by year, and its DCA decreased from 3.0335 in
2008 to 1.8328 in 2018.The manufacturing industry
of communication equipment, computer and other
electronic equipment showed a trend of increasing
regional comparative advantage year by year, and
showed a rapid growth during 2008-2012. DCA
increased from 0.0888 in 2008 to 0.9848 in 2012, and
even increased to 1.644 in 2018.
4.1.2 Manufacturing Sub Industry Analysis
with Inferior Regional Comparative
Advantage
In addition to transportation equipment
manufacturing and communication equipment,
computer and other electronic equipment
manufacturing, the regional comparative advantage
of other manufacturing industry in Chongqing is at
disadvantage. From 2008 to 2018, Chongqing
regional comparative advantage in manufacturing
improved industry of leather, fur, and feathers (fine
hair) and its products, wood processing and wood,
bamboo, cane, palm, grass products, chemical fiber
industry, paper and paper products, rubber products,
printing and recording media industry, fabricated
metal products. Among them, the DCA of paper and
paper products industry, printing industry and
recording media industry is close to 1, while the DCA
of other industries is less than 0.5, indicating that the
regional comparative advantage of other industries is
weak.
From 2008 to 2018, Chongqing regional
comparative advantage to degradation in the
manufacturing industry: textiles, pharmaceutical
manufacturing industry, non-ferrous metal smelting
and rolling processing industry, instruments and
meters, and culture, office machinery manufacturing
industry. Among them, non-ferrous metal smelting
and rolling processing industry and instrument is a
traditional industry in Chongqing, but showed a trend
of decline in the regional comparative advantage.
From 2008 to 2018, the regional comparative
advantage of most manufacturing sub industries in
Chongqing presents an inverted "U" shaped structure
to a certain extent (as shown in Figure 1). The
regional comparative advantage
BDEDM 2022 - The International Conference on Big Data Economy and Digital Management
698
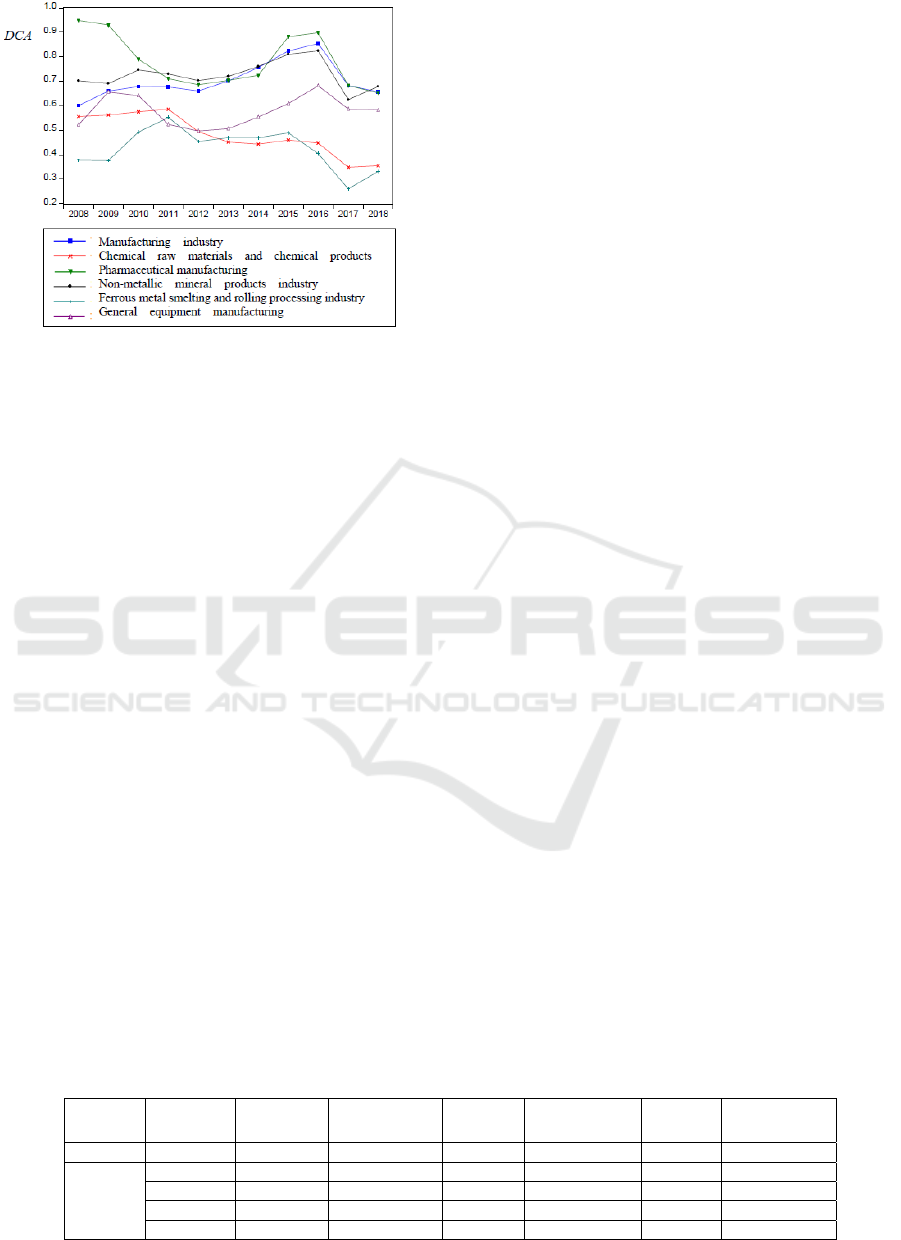
Figure 1: Comparative advantage of Manufacturing
industry and some industries in Chongqing.
shows a significant peak in 2015 or 2016, but a
significant downward trend after 2016.This is
consistent with the changing trend of Chongqing's
industrial added value in recent years.
4.2 Analysis of Driving Factors of
Regional Comparative Advantage
Combined with Cobb-Douglas production function
and Heckschel-Ohling(HO) traditional international
trade theory, the econometric model based on the
traditional sources of comparative advantage
including capital, labor and technological progress is
established(see section 2 model settings above).In the
analysis process, model 1 is set as the general
situation of Chongqing manufacturing industry for
data inspection and analysis, and model 2 is the data
analysis of Chongqing manufacturing sub industries.
The model mainly studies the influence of driving
factors on the change of manufacturing industry and
regional comparative advantage of each
manufacturing sub industry.
4.2.1 Formal Test of Model Setting
According to the set econometric model of regional
comparative advantage, this paper analyzes the
driving factors of regional comparative advantage of
Chongqing manufacturing industry and 25
manufacturing sub industries by using regional
comparative advantage, capital factor, labor factor
and technology factor. The explained variable DCA
in the model represents the comparative advantage of
manufacturing industry and various sub-industries.
The explained variables are labor factor variable L,
capital factor variable K and technology factor
variable TE. The variables are annual data, and the
sample range is from 2008 to 2018.In this paper,
software EVIEWS10.0 was used, and analysis
showed that R
2
=0.9317, F=11.4249 in model 1,
indicating that 93.17% of the variation of
manufacturing regional comparative advantage can
be explained by their respective variables, and the
significance probability reaches 0.000, indicating
significant regression. For model 2, according to the
test method of model setting provided by Gaotiemei
(2006)(N=25, k=3, T=11), F1=180.284, F2=151.743,
F1 and F2 are greater than the corresponding critical
value, so the variable coefficient model is selected for
analysis(Gao 2006).The variable coefficient panel
model can be divided into random effect and fixed
effect according to different individual effects of
intercept items. Hausman test is used to process
variables. The results of Hausman test show that the
P value of this model is 0, less than 0.05, which
rejects the null hypothesis. The null hypothesis of
Hausman test believes that the random effect model
should be established. Based on the above tests, the
regression model adopted in this paper is fixed effect
variable coefficient panel model. Model 2 tests
R
2
=0.9904, and the significance probability reaches
0.000, which indicates that the change of regional
comparative advantage can be explained by 99.04%
of independent variables, and the fitting effect of the
model is very good.
4.2.2 Model Estimation
For model 2, a panel model with fixed effects and
variable coefficients was used to perform regression
analysis on all variables, using the method of cross-
sectional weighting. As for the estimation method,
panel correction standard error (PCSE) method is
adopted, and the results are shown in Table 2.
Table 2: Econometric model analysis results (Unit: None).
industry α T statistic of α β T statistic of β γ T statistic of γ
Model 1 HY0 0.779 3.437 0.011 0.073 0.176 -0.467
HY1 0.384 2.674 -0.255 -1.301 -0.022 0.610
HY2 0.254 1.459 -0.151 -0.871 0.057 -0.468
HY3 0.594 2.368 0.015 0.280 0.051 1.107
HY4 0.179 0.647 -0.010 1.036 -0.003 0.243
Analysis of Regional Comparative Advantage and its Driving Factors of Manufacturing Industry: Based on the Panel Data of Manufacturing
Industry in Chongqing
699
Model 2
HY5 0.176 2.480 -0.011 -0.099 0.122 -0.112
HY6 0.283 3.284 -0.185 -1.048 0.130 1.429
HY7 0.160 0.988 -0.099 -0.295 -0.227 1.098
HY8 0.508 2.363 -0.308 -4.378 0.291 -0.889
HY9 0.509 2.641 -0.143 -1.812 -0.090 4.131
HY10 0.046 -0.211 0.176 1.054 0.007 -0.553
HY11 0.020 0.251 0.005 -0.156 0.099 0.196
HY12 0.292 0.562 -0.261 -0.538 -0.322 -0.270
HY13 0.075 0.547 0.139 1.757 0.056 -2.847
HY14 0.057 0.615 -0.007 -0.107 0.230 0.763
HY15 0.387 3.499 -0.128 -1.947 0.274 2.807
HY16 0.617 2.288 -0.432 -0.910 0.134 0.610
HY17 0.256 3.808 -0.072 -1.622 -0.066 1.488
HY18 0.351 2.049 -0.220 -1.641 0.127 -0.742
HY19 0.746 3.615 -0.307 -2.401 -0.169 1.100
HY20 0.609 2.575 0.096 0.480 0.028 -0.938
HY21 0.378 2.731 -0.063 -0.666 2.008 0.482
HY22 1.023 -0.517 -2.233 -19.385 0.319 6.876
HY23 0.482 2.187 -0.370 -2.567 -0.318 1.216
HY24 0.654 7.725 0.095 -4.494 -0.174 2.988
HY25 0.793 4.606 -0.017 -0.285 0.176 -1.188
4.2.3 Analysis of Model Results
The regression coefficient analysis results of driving
factors show that DCA of manufacturing industry in
Chongqing is positively correlated with labor input,
capital input and technological progress, but only
labor input has a significant impact on DCA of
manufacturing industry, while technological progress
and capital input have a limited and insignificant
effect on manufacturing regional comparative
advantage. At the same time, the contribution of labor
input to manufacturing regional comparative
advantage is far more than the impact of capital input
and technological progress. This conclusion is
consistent with the labor population transfer in
Chongqing from 2008 to 2018. The transfer of rural
labor to the secondary industry and the return of
migrant labor from the east are the main driving
factors for the formation of comparative advantages
of Chongqing manufacturing industry in this period.
But on the whole, the marginal effect of labor input
on manufacturing regional comparative advantage
shows a downward trend, which is reflected in the
inverted "U" shaped structure of Chongqing
manufacturing regional comparative advantage (as
shown in Figure 1).This indicates that the driving
factors which promoted the improvement of
Chongqing's manufacturing regional comparative
advantage from 2008 to 2016 decreased after 2016,
while the manufacturing industry in Chongqing did
not form new driving factors after 2016, resulting in
the decline of manufacturing regional comparative
advantage.
In terms of specific sub industries, technological
progress has a great positive effect on the regional
comparative advantage of transportation equipment
manufacturing, metal products manufacturing,
electrical machinery and equipment manufacturing,
communication equipment computer and other
electronic equipment manufacturing, etc. In textile
industry, printing industry and pharmaceutical
manufacturing industry, capital input has a large
positive effect on the formation of industrial regional
comparative advantage, but in most other industries,
capital input has a very limited effect on the
formation of industrial regional comparative
advantage. Agricultural and sideline food processing,
food manufacturing, tobacco products industry,
textile and garment, shoes, caps, leather, fur, and
feathers and its products, furniture
manufacturing,
paper and paper products, rubber products, non-
metallic mineral products, ferrous metal smelting and
rolling processing industry, non-ferrous metal
smelting and rolling processing industry, fabricated
metal products, general equipment manufacturing
industry, special equipment, communications
equipment manufacturing, electric machinery and
equipment manufacturing industry of computer and
other electronic equipment manufacturing,
instrumentation and cultural office machinery
manufacturing and other industries, labor input has a
great positive effect on the formation of the regional
comparative advantage of these industries.
Textile industry, pharmaceutical manufacturing
industry, non-ferrous metal smelting and calendering
industry, instrument and instrument and culture
industry, office machinery manufacturing industry,
all showed a declining trend of regional comparative
advantage, except pharmaceutical industry, the
driving factor of regional comparative advantage is
BDEDM 2022 - The International Conference on Big Data Economy and Digital Management
700

labor input. For most industries, their regional
comparative advantage mainly depends on labor
input, but these industries do not have strong regional
comparative advantage in the whole country. In
Chongqing, the industries with strong regional
comparative advantage, such as transportation
equipment manufacturing (automobile
manufacturing and other transportation equipment)
and communication equipment, computer and other
electronic equipment manufacturing, are mainly
driven by technological factors rather than capital
factors or labor factors. This shows that the strong
regional comparative advantage of manufacturing
industry must rely on technological innovation and
technological progress.
5 CONCLUSIONS
The analysis above shows that there is a marginal
diminishing effect in the regional comparative
advantage of Chongqing manufacturing industry
driven by labor factors, while the new competitive
advantage has not yet formed, which led to a decline
in the development of Chongqing manufacturing
industry after 2016.The analysis of this paper shows
that only technological innovation and technological
progress can establish the competitive advantage and
enhance the regional comparative advantage of
manufacturing industry in Chongqing. Therefore, the
development of Chongqing manufacturing industry
needs to implement innovation-driven strategy to
realize the promotion and development of industrial
comparative advantage, so as to enhance the core
competitiveness of Chongqing manufacturing
industry, therefore, promote the transformation and
upgrading of industrial structure, and promote the
high-end development of Chongqing manufacturing
value chain.
ACKNOWLEDGMENT
This paper is sponsored by the The Social Science
Research Major Project of Chongqing Education
Commission (20SKGH229).
REFERENCES
C. A. Hidalgo, B. Klinger, A. -L.Braasi, R. Hausmann. The
Product Space Conditions and Development of Nations
Science,2007, 317(5837), pp.482-487.
Chen Guosheng, Zhang Hengyi, Zhao Liping, Wei Xiaobo,
Luo Jiaoxia. Influence of Comparative Advantage and
Competitive Advantage on Regional Manufacturing
Transfer. Economic Geography,2018,38(9), pp.168-
175.
Gao Tiemei. Econometric Analysis and Modeling --
Application and Examples of EViews. Tsinghua
University Press, 2016, pp.386-418Wang Tuzhan,
Zhang Yue. A study of multi-sources of comparative
advantages of regional manufacturing industries.
Science Research Management,2018,39(8), pp.43-52.
Hausmann R, and Rodrik d. Economic Development as
self-discovery. Journal of Development Economics,
2003,72(2), pp.603-633.
Liu Wei, Liu Guozhen. Research on Comparative
Advantage, Industrial Correlation and Transformation
and Upgrading of Dongguan Manufacturing Industry.
People's Publishing House, 2015, pp.69-75.
Wang Changlin. Evolution and upgrading path of China's
offshore service outsourcing comparative Advantage.
Reform of Economic System, 2013, (3), pp.30-33.
Wang Tuzhan, Zhang Yue. A study of multi-sources of
comparative advantages of regional manufacturing
industries. Science Research Management,2018,39(8),
pp.43-52.
Wu Yejun, Zhang Qizai. Evolution of comparative
advantage and economic growth: An empirical analysis
based on Argentina. China Industrial Economics, 2012,
(2), pp. 37-46.
Zhang Yue, Wang Tuzhan, Liu Li. Comparative advantage,
competitive advantage and regional manufacturing
transfer. Modern Economic Science, 2018, 40(6),
pp.107-119.
Zhao Ting, Chen Zhao. Comparative Advantage and
Industrial Policy Effect: Regional Differences and
Institution Cause. China Economic Quarterly, 2020,
19(3), pp.777-796.
Analysis of Regional Comparative Advantage and its Driving Factors of Manufacturing Industry: Based on the Panel Data of Manufacturing
Industry in Chongqing
701
