
Research on Quantitative Risk Control Evaluation of Enterprises and
Optimization of Bank Credit Strategy
Jie Song*
School of Information Science and Engineering, Lanzhou University, Lanzhou, Gansu, 730000, China
Keywords: TOPSIS Model, Logistic Regression, Nonlinear Programming, Monte Carlo Method.
Abstract: This paper focuses on the quantitative evaluation of enterprise credit risk and the comprehensive problem of
bank's decision on enterprise credit strategy under the background of big data.Firstly,the discrete credit
rating is used to evaluate the enterprise's reputation,and the standardized inbound and outbound sales are
used to construct the index.The obtained evaluation matrix is used to evaluate the upstream and downstream
influence of the enterprise by entropy weight method and TOPSIS model,and the effective vote ratio is used
to evaluate the enterprise's strength.Then,the three first-level indicators are used logistic regression,and the
0-1 variable U is used as the predictive variable to get the risk indicator of whether each enterprise will
default.Then,nonlinear programming is adopted to solve the problem,and the monte Carlo method is used to
simulate the solution with the objective function of maximizing the total income of the bank.By limiting the
mean value of random number sequence,monte Carlo method is improved to improve the solving
efficiency.Finally,the corresponding loan amount and interest rate of enterprises are obtained.
1 INTRODUCTION
In real life, there are many micro, small and medium-
sized enterprises, their business is relatively small in
scale and lack of mortgage assets, and the bank loan
for the business enterprise usually when the trading
instruments information of credit policy, enterprise
and enterprise as the judging standard in the
influence of upstream and downstream, measure the
strength of enterprises and the supply and demand is
stable, And on this basis, the bank will also give
appropriate interest rate preference to the enterprises
with relatively high reputation and relatively small
credit risk (Li, Liu, 2021).
The strength and credibility of micro, small and
medium-sized enterprises are the primary factors for
banks to consider in risk assessment of enterprises.
Secondly, banks will determine reasonable credit
strategies based on credit risk factors, including
whether to lend, loan amount, interest rate and term.
In this paper, we first construct a hierarchical
diagram of the credit risk assessment model,
including the three basic indicators of enterprise
strength, enterprise upstream and downstream
influence and enterprise creditworthiness. The
discrete credit rating is used to assess the
creditworthiness of the enterprise, the standardized
total inbound and outbound sales are used to
construct the indicators, the obtained evaluation
matrix is used to assess the upstream and
downstream influence of the enterprise, and the
effective vote ratio is used to evaluate the strength of
the enterprise (Zhang, Liu, Tian, 2021). Finally, the
three indicators are regressed using logistic
regression to obtain the risk indicator of whether
each enterprise will default or not. For the
optimization of the bank's credit strategy, a nonlinear
programming solution is adopted to maximize the
bank's total revenue as the objective function, and
finally the loan amount and interest rate that meet the
expectations are obtained.
2 DATA PREPARATION
In this paper, enterprise reputation (P
i
), enterprise
upstream and downstream influence (Q
i
) and
enterprise strength (K
i
) are selected as three basic
indicators, and on this basis, a credit risk (U
i
)
evaluation system model based on Logistic
regression is constructed.
Song, J.
Research on Quantitative Risk Control Evaluation of Enterprises and Optimization of Bank Credit Strategy.
DOI: 10.5220/0011269000003440
In Proceedings of the International Conference on Big Data Economy and Digital Management (BDEDM 2022), pages 731-736
ISBN: 978-989-758-593-7
Copyright
c
2022 by SCITEPRESS – Science and Technology Publications, Lda. All rights reserved
731

First, ABCD credit rating is mapped to discrete
data values within the range, and the mapping
relationship is A=1, B=0.75, C=0.5, D=0.25. In the
case of default,0-1 variables are defined to indicate
whether the enterprise defaults. U =0 represents the
occurrence of default, and u=1 represents the non-
occurrence of default.
Then the invoice information data is cleaned and
standardized, and the invalid invoice data is
eliminated. Set
i
p
and
i
s
to represent the total
amount of the total price tax of the upstream or
downstream enterprise of the first enterprise
respectively,
i
p
and
i
s
convert the two into
standardized indicators and respectively:
ip
i
p
p
p
(1)
is
i
s
s
s
(2)
11
p
is i
ii
p
s
nn
(3)
2
1
1
i
pip
n
p
n
(4)
2
1
1
i
six
n
s
n
(5)
After standardized treatment, the total amount of
the total price tax of the upstream or downstream
enterprises is converted into a standardized index
with an average of 0 and a standard deviation of 1.
3 ESTABLISHMENT OF EVALUATION
INDICATORS
The entropy weight method was used to determine
the weight of each indicator, and then substituted into
TOPSIS model (Wu, Li, 2020). Finally, the results
were tested, so as to obtain the comprehensive
evaluation index of supply and demand relationship
of these 123 enterprises:
(1) Data standardization is firstly carried out:
2
1
,
ij
ij ij
n
ij
i
x
Zzz
x
(6)
(2) For each item,calculate its corresponding
probability and information entropy:
1
ij
ij
n
ij
i
z
b
z
(7)
1
1
ln( )
ln
n
iijij
i
ebb
n
(8)
(3) Work out the information utility value and
index weight:
1
jj
de
(9)
1
/
m
j
jj
j
Wd d
(10)
Based on the above analysis, the profit weight
value of the enterprise is 0.4366, and the supply
chain profit efficiency weight value of the enterprise
is 0.5634.
Topsis model is a comprehensive evaluation
method, which can fully mine the original data and
describe the comprehensive performance of the target
by using the degree of migration in the data.
Introduce "distance" to describe the degree of
importance to the population.
For the standardized evaluation matrix Z
ij
, the
formula for defining the maximum value Z+ of each
evaluation index is as follows:
12
11 21 1 12 22 2 1 2
(,,...)
=(max , ,... ,max , ,... ,...max , ,... )
m
nnmmnm
ZZZZ
zz z zz z z z z
(11)
----
12
11 21 1 12 22 2 1 2
( , ,... )
=(min , ,... , min , ,... ,...min , ,... )
m
nnmmnm
ZZZZ
zz z zz z z z z
(12)
Then, the distance between the first evaluation
object and the maximum value can be defined as:
2
1
()
m
ijij
j
DZz
(13)
Similarly, the distance between the first
evaluation object and the maximum value can be
defined as:
--2
1
()
m
ijij
j
DZz
(14)
Then the unnormalized score of the object is the
formula:
i
i
ii
D
S
D
D
(15)
BDEDM 2022 - The International Conference on Big Data Economy and Digital Management
732
Matlab is used to calculate the final score of each
enterprise,and then the evaluation index table of the
upstream and downstream influence of the enterprise
is obtained:
TABLE I. E
VALUATION INDEX TABLE
.
E1 0.380463922 E6 0.570846867
E2 0.688289183 E7 0.351561487
E3 0.392875752 E8 0.612148083
E4 0.910602339 E9 0.524091466
E5 0.557651018 E10 0.543837713
K
i
is selected as the indicator of the company's
strength:
12
()/2
i
K
(16)
K
i
is used to represent the enterprise strength of
the ith enterprise, and the enterprise strength can be
measured by the proportion of invalid invoices and
total invoices in the enterprise's input invoices and
output invoices.
4 MODEL ESTABLISHMENT AND
SOLUTION
4.1 Establishment of Optimization
Model of Nonlinear Programming
The three basic indicators of different enterprises'
credibility (P
i
),their upstream and downstream
influence (Q
i
) and their own strength (K
i
) were taken
as independent variables,and the 0-1 variable
corresponding to the enterprise's default situation
lock was taken as the dependent variable for logistic
regression.The result of logistic regression fitting can
be used to represent the possibility of enterprise
repayment,that is,to represent the credit risk of
enterprise.Based on the above analysis,SPSS
software can be used for multivariate logistic
regression,and the results are shown in the table.
TABLE II. MULTIVARIATE LOGISTIC REGRESSION RESULTS.
Parameter estimation
Whether the violations, B
Standard
error
wald DOF Significance Exp(B)
Exp(B)95% confidence
interval
lower limit upper limit
0
Intercept 7.305 9.329 0.613 1 0.434
Supply chain score -1.501 9.247 0.026 1 0.871 .223 3.000E-9 16547478.433
corporate strength 2.386 8.978 0.071 1 0.790 10.874 2.478E-7 477138265.652
credit rating -21.44 5.388 15.84 1 0.000 4.871E-10 1.264E-14 1.878E-5
Thus, the logistic regression model (Bian, Lu, Li,
Zeng, Sun, 2020) of credit risk on enterprise
reputation, upstream and downstream influence and
enterprise strength is obtained:
The bank's loan policy is determined by
constructing an optimization model of bank loan
strategy based on nonlinear programming. However,
as the loan life is known to be one year, two
indicators, the loan amount and interest rate, need to
be determined.
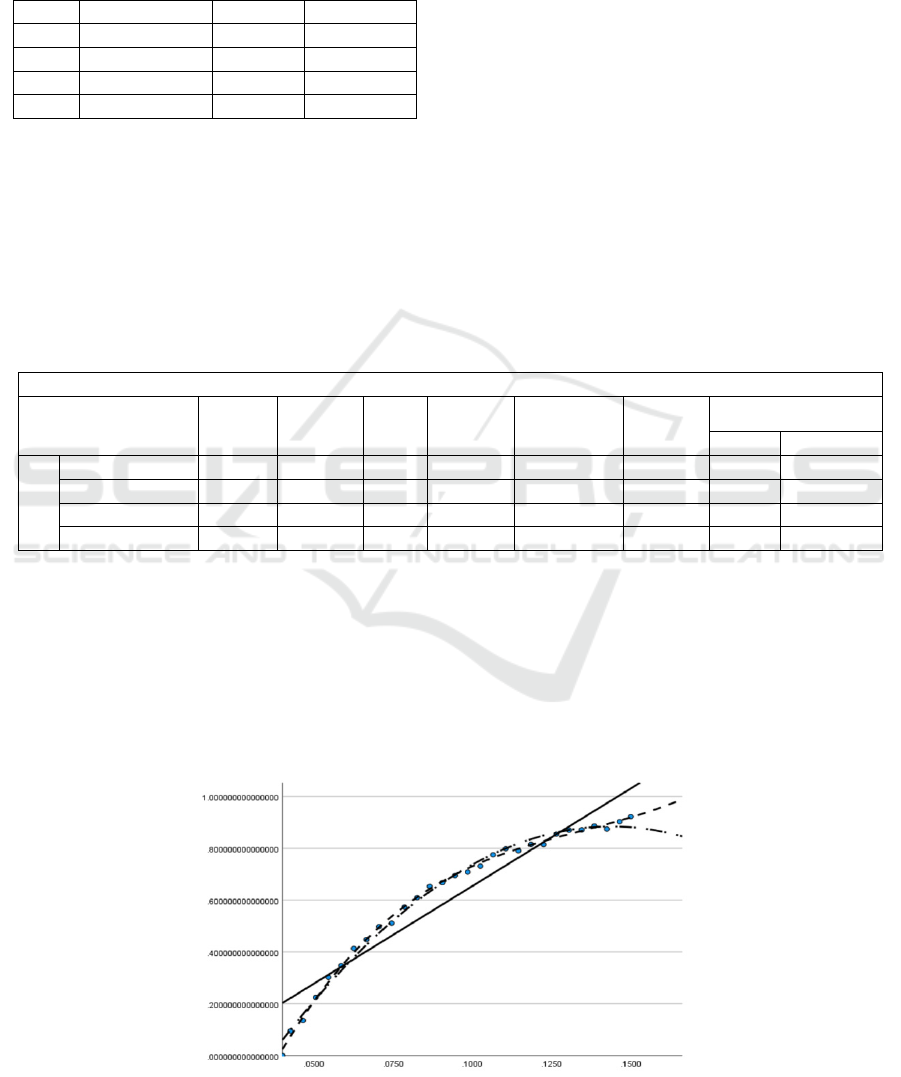
First, we need to fit the functional relationship
between customer churn rate and interest rate.
Through the observation of the scatter graph and the
statistics of the curve fitting, the cubic function is
selected as the best fitting curve:
23
( ) 1.121 37.97 258.57 640.944
iiii
f
LLLL
(17)
Figure 1. Functional diagram.
Research on Quantitative Risk Control Evaluation of Enterprises and Optimization of Bank Credit Strategy
733

Since the bank hopes to obtain the maximum rate
of return, the objective function of bank income can
be constructed. Since the bank interest rate is low for
enterprises with high credit rating, the income
generated by enterprises with different credit rating
can be planned separately. Suppose that M
1
, M
2
, M
3
represents the total loan amount of ABC three
enterprises respectively, and M represents the total
loan amount of bank and is a fixed value. The
formula can be obtained:
123
123
=
0,,
M
MMM
M
MM M
(18)
Z
i
represents the loan amount of each enterprise,
and L
i
represents the loan interest rate of each
enterprise (Sun, Wang, 2015). For enterprises with
high credit rating, the loan interest rate needs to be
appropriately reduced. Therefore, the fluctuation
range of the loan amount can be set for these three
types of enterprises respectively, so as to reflect the
preferential interest rate policy for enterprises with
high credit rating. The total interest rate range of
0.04-0.15 can be divided into three ranges, which
respectively represent the interest rate fluctuation
range of ABC class 3 enterprises: [0.04,0.0945],
[0.074,0.13], [0.0945,0.15]. For credit risk
i
u
,it is
believed that risk will bring potential income loss, so
credit risk should be reflected as a factor in the return
function. Therefore, an optimization model of bank
loan strategy based on nonlinear programming can be
constructed. A-level enterprises are taken as the
formula:
1
1
max ( )
10 100 0
.
0.04 0.0945
0
0 123
ii
ii
i
i
i
i
ZL u f L
ZM
Z
st
L
MM
i
(19)
4.2 Solution of Optimization Model of
Nonlinear Programming
Monte Carlo algorithm is an algorithm that can
generate a large amount of simulated data in a given
data range and simulate the results (Chai, Zhang,
Ding, 2019). It avoids the situation that the
traditional method can not get the analytical solution,
and uses the idea of probability approximation to get
the optimal solution of the problem. For this model,
the algorithm process of monte Carlo method is as
follows:
(1) Given a rating value of M, it is determined as
80 million in this example.
(2) Generate a large number of interest rate L
i
and
quota Z
i
randomly according to the credit rating of
different enterprises.
(3) For the bank returns stored after the Kth
simulation, if the total bank returns obtained in the
k+1 simulation are greater than the result of the Kth
simulation, the interest rates and quota values of the
302 companies stored are updated.
(4) By simulating 103,105,106times respectively,
we can calculate the total amount of the bank, which
can be used to show the approximation of the
simulated value to the real value.
Meanwhile, the credit strategies of each of these
123 enterprises are obtained, including the loan
amount and annual interest rate of each enterprise, as
shown in the table:
TABLE III. CREDIT STRATEGY.
Code Loan commitment
Rate of
interest
E1 65.24897 0.0585
E2 84.68147 0.0465
E3 67.45052 0.1225
E4 80.92142 0.1025
E5 78.24901 0.1145
E6 86.79694 0.0425
E7 82.17887 0.0585
E8 78.1906 0.0785
E9 78.72787 0.0905
E10 76.87874 0.0825
4.3 Interpretation of Result
The regression method was used to fit the
relationship between customer churn rate and interest
rate. It was found that the cubic function had the best
effect, and the correlation coefficient R2 reached
0.998, so the fitting effect was very good. Specific
parameters are shown in the table:
TABLE IV. TABLE OF RELATED PARAMETERS.
Model abstract and parameter estimation
Dependent variable:customer churn rate
Model abstract parameter estimation
BDEDM 2022 - The International Conference on Big Data Economy and Digital Management
734
Equation
R
2
F DOF 1 DOF 2 Significance Constant b1 b2 b3
Linear .911 276.61 1 27 .000 -.098 7.524
Quadratic .993 1847.86 2 26 .000 -.697 21.984 -76.410
Cubic .998 3690.62 3 25 .000 -1.121 37.970 -258.57 640.944
The independent variable is the annual loan interest rate
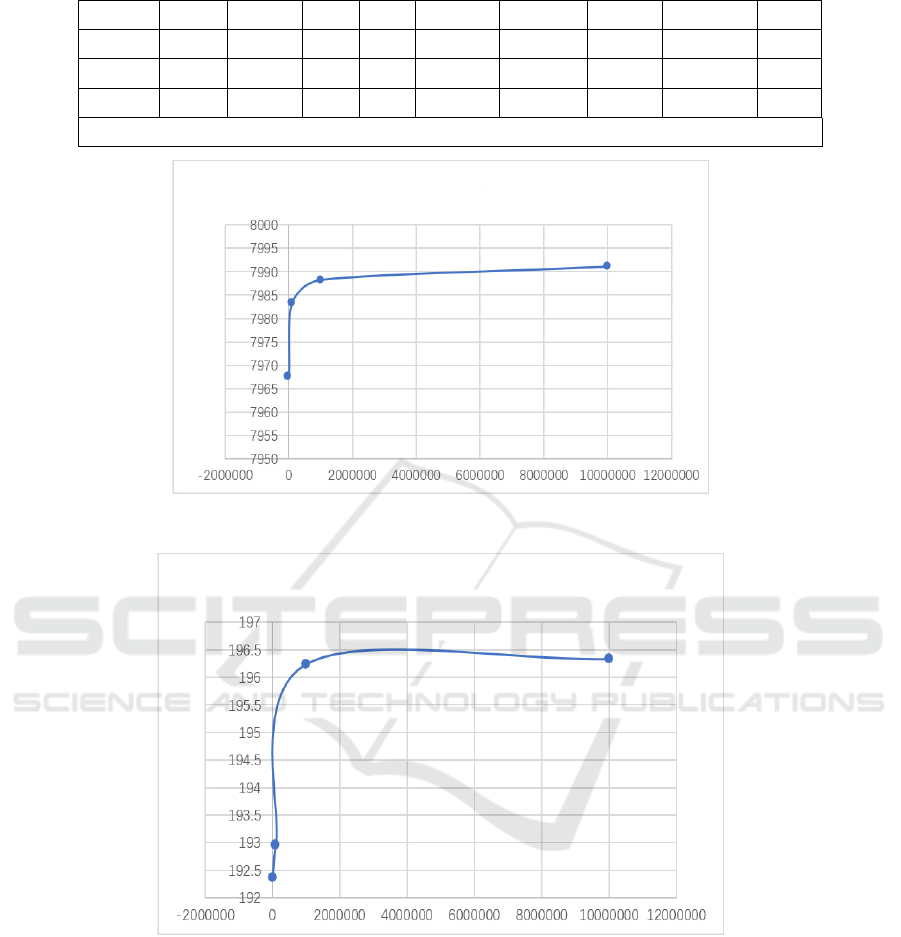
Figure 2. Comparison between simulated amount and actual amount (8000).
Figure 3. Change of total income of banks.
In monte carlo simulation, it is found that with
increasing points of each simulation, a combination
with preset limit (80 million),the gap between more
and more small, platform, and total revenue
fluctuates up and down around a certain level, that
participate in simulated points have enough right
now, you can find the best credit strategy to meet the
requirements of the goal programming, as shown in
figure 2 and figure 3.
5 CONCLUSION
5.1 Advantages
(1) Topsis model with entropy weight is used to
predict the upstream and downstream influence of
enterprises, with strong objectivity.
Research on Quantitative Risk Control Evaluation of Enterprises and Optimization of Bank Credit Strategy
735

(2) The feedforward neural network is used to
predict the enterprise reputation level, and the
network comprehensive prediction accuracy reaches
92%, and the generalization ability is good.
(3) The monte Carlo simulation method of
normal distribution random points with fixed mean is
used to solve the nonlinear programming model,
which can obtain more accurate solutions in the case
of fewer points.
5.2 Disadvantages
(1) Insufficient application of professional models in
finance.
(2) Modern optimization algorithms, such as
genetic algorithm, can be used to solve nonlinear
programming problems, and the results are compared
with those of Monte Carlo simulation.
REFERENCES
Bian YN, Lu LK, Li YL, Zeng QT, Sun YX.
Implementation of logistic regression-based financial
venture capital scorecard model[J]. Computer
Science,2020,47(S2):116-118.
Cunyi Sun, Caixia Wang. Application of machine learning
method in credit risk prediction identification[J].
China Price, 2015(12):45-47.
Guotai Chai,Yajing Zhang,Shijie Ding. An optimal loan
allocation model based on power risk spectrum and
Monte Carlo simulation[J]. China Management
Science,2019,27(09):1-
14.DOI:10.16381/j.cnki.issn1003-207x.2019.09.001.
Xuan Li,Xuezhi Liu. Analysis of the application of
mathematical modeling in economic activities[J].
Journal of Economic Research, 2021(33):122-124.
Zhang H. M.,Liu H.,Tian Miao. Research on the
application of mathematical economic modeling in
economic trade[J]. Rural Economy and Technology,
2021,32(20):148-150.
Zhengping Wu, Xiu Li. Industrial innovation system life
cycle determination and model application - based on
TOPSIS evaluation method [J]. Finance and
Accounting Monthly, 2020(08):123-
129.DOI:10.19641/j.cnki.42-1290/f.2020.08.016.
BDEDM 2022 - The International Conference on Big Data Economy and Digital Management
736
