
The Forecast of the Fish Consumption in China based on
Experimental Analysis
Jiaqi Qin
1,a
Shansong Huang
1,b
, Boying Yang
2,c
, Shuqi Chen
2,d
and Zheng Tao
3,e
1
Department of Mathematics, Wenzhou-Kean University, Wenzhou, China
2
College of Business & Public Management, Wenzhou-Kean University, Wenzhou, China
3
Department of Statistics, National University of Singapore, Singapore
Keywords: Fish Consumption, Simultaneous Equation Model, Supply Equation, Demand Equation, Endogenous
Relationship.
Abstract: Fish is one of the critical sources for people to obtain animal protein. About 3.1 billion people worldwide rely
on fish for 20% of their daily protein intake, and even more, than 70% of some coastal communities rely on
fish (Sustainable Seafood 101 - Sustainable Fisheries UW, 2021). Therefore, the fish consumption is an
important indicator to judge people's health. Fish consumption is the intersection of the fish supply equation
and the fish demand equation. However, the quantity and price variables in equations affect each other which
are not independent. Therefore, this article adopts simultaneous equation model to deal with the correlation
between the price and quantity of endogenous variables. And this article chooses four exogenous variables:
the ex-factory price index of industrial producers, sea surface temperature, the price of eggs and per capita
GDP to construct the supply equation and the demand equation. After using 𝐬𝐲𝐬𝐭𝐞𝐦𝐟𝐢𝐭() function in R to
estimate supply equation and demand equation based on the data from 2003 to 2017, the data from 2018 is
used to verify the accuracy of the model.
1 INTRODUCTION
1.1 Why Is It Important?
The consumed fish intersects market demand and
supply (Ye, 1999). According to OECD-FAO
Agricultural Outlook 2015-2024, the protein intake by
fish increases over time in the least developed
countries, developed countries, and developing
countries. The proportion of protein consumed by fish
in developing countries has increased rapidly (OECD-
FAO, 2015), which means that with the economic
growth of some developing countries such as China,
people are paying more attention to a healthy diet,
which has also contributed to the increase in the
consumption of global fishery products in the past few
decades. The body needs 20 kinds of amino acids to
maintain body health and normal functions, of which
the body can produce about 11 types. The other nine
amino acids, the so-called "essential" amino acids,
must enter the human body through our diet. And, fish
meat can provide these nine essential amino acids, in
addition to its omega-3 fatty acids, minerals, and
vitamins through its protein (Heffernan, 2021).
"According to the Dietary Reference Intake report for
macronutrients, a sedentary adult should consume 0.8
grams of protein per kilogram of body weight, or 0.36
grams per pound. That means that the average
sedentary man should eat about 56 grams of protein
per day, and the average woman should eat 46 grams"
(https://www.sclhealth.org/blog/2019/07/how-much-
protein-is-simply-too-much/, 2021). Combined with
the protein content of fish, 100 grams of cooked food
for most types of fish and shellfish can provide
approximately 15-25 grams of protein (Heffernan,
2021). The protein content of fish means that fish is
rich in amino acids and high in protein. At the same
time, compared with other meats, fish has less fat
content, which shows that fish is a healthier source of
protein. It is precise because fish has so many nutrients
that it serves as an essential source of animal protein,
accounting for 17% of the world's meat consumption.
At the same time, about 3.1 billion people rely on fish
for 20% of their daily protein intake, and more than
70% of some coastal communities rely on fish
(Sustainable Seafood 101 - Sustainable Fisheries UW,
2021).
Qin, J., Huang, S., Yang, B., Chen, S. and Tao, Z.
The Forecast of the Fish Consumption in China based on Experimental Analysis.
DOI: 10.5220/0011285800003440
In Proceedings of the International Conference on Big Data Economy and Digital Management (BDEDM 2022), pages 737-741
ISBN: 978-989-758-593-7
Copyright
c
2022 by SCITEPRESS – Science and Technology Publications, Lda. All rights reserved
737
1.2 How Is It Changing?
According to FAO's HISTORICAL
CONSUMPTION AND FUTURE DEMAND FOR
FISH AND FISHERY PRODUCTS, the world
average per capita fish consumption has shown an
upward trend from 1965 to 1995. Especially in Asia,
fish consumption and consumption growth rate are
higher than in other continents (Ye, 1999). Many
factors affect fish consumption, but they can be
classified based on the relationship between supply
and demand. For example, factors affecting supply
include price, weather, production costs, government
policies, etc. (Hu, Pan, Zhang, Tao, 2020). Factors
affecting the market include income, substitutes and
complementary products, and product quality (Hu,
Pan, Han, Lin, Tao, 2020).
1.3 Objectives
Since fish meat is essential for human protein intake,
fish consumption is a crucial indicator of people's
protein intake or health. The main goal of this article
is to find appropriate exogenous variables to establish
a supply equation model that conforms to the laws of
the market based on the relevant data from 2003 to
2017 in China to predict the future consumption of fish
in China to provide essential data for people's protein
intake.
2 METHODOLOGY
2.1 Data Source
The data in this article comes from Chinese national
data, our world data, and statist. Among them, the ex-
factory price index of industrial producers
(1985=100), the current value of the market price of
eggs (ordinary fresh eggs) (yuan/kg), hairtail (0.5-1)
(Kg), the current value of the market price (yuan/kg)
and the per capita GDP (yuan) come from Chinese
national data. Fish and Seafood supply quantity
(kg/capita/yr) comes from our world data. Annual
anomalies in global ocean surface temperature from
1880 to 2020, based on temperature departure (in
degrees Celsius), comes from Statista.
2.2 Supply and Demand Function
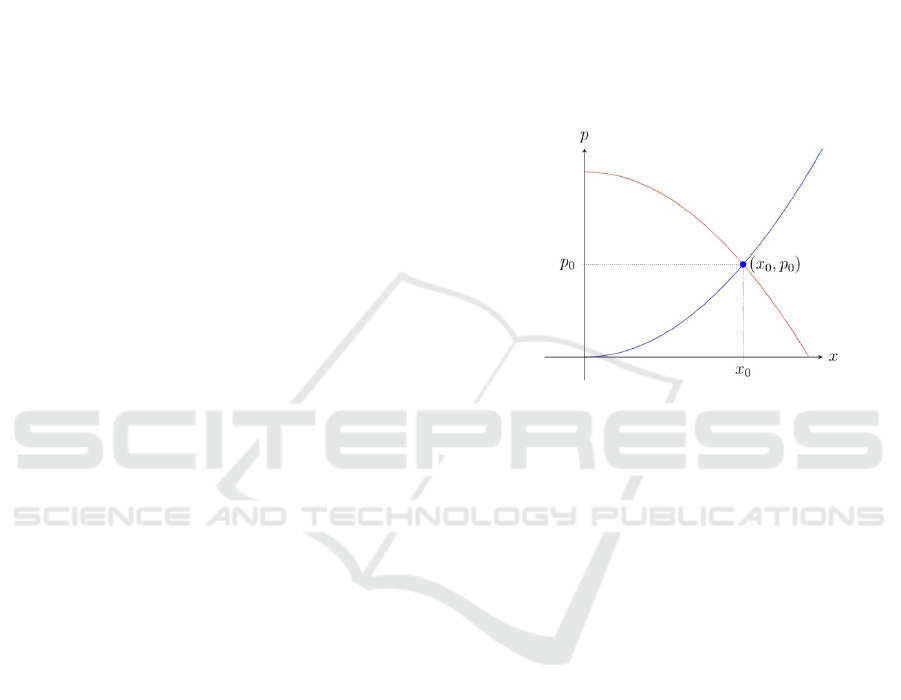
1) Demand Function: A demand function is
defined by 𝑝 = 𝑓(𝑥)where 𝑝 measures the unit price
and 𝑥 measures the number of units of the commodity
in question and is generally characterized as a
decreasing function of 𝑥; that is, 𝑝=𝑓(𝑥) decreases
as x increases. Since both 𝑥 and 𝑝 assume only
nonnegative values, the demand curve is that part of
the graph of 𝑓(𝑥) that lies in the first quadrant
(figure.1) (Pettinger, 2021).
2) Supply Function: A supply function defined
by 𝑝=𝑓(𝑥)with 𝑝 and 𝑥 as before is generally
characterized as an increasing function of 𝑥; that is,
𝑝=𝑓(𝑥) increases as 𝑥 increases. Since both 𝑥 and
𝑝 assume only nonnegative values, the supply curve
is that part of the graph of 𝑓(𝑥) that lies in the first
quadrant (figure.1) (Economic Models, 2021)..
Figure 1: Example of a supply curve (in blue) and a demand
curve (in red). The point of intersection corresponds to
market equilibrium.
2.3 Simultaneous Equations Models
1) Introduction to Simultaneous Equations Models:
A simultaneous equation model is a statistical model
in a set of simultaneous linear equations. They differ
from regular regression models because there are two
or more dependent variables (Pettinger, 2021).
Because the concurrent equation model can solve the
endogenous relationship between variables. For
example, the variable price is both an explained
variable and an explanatory variable to express
quantity. The same is true for the number of variables.
So, I choose the simultaneous equation model to solve
the supply and demand equation.
2) Variable Selection of Price of Fish: This
article uses the price of hairtail to replace the price of
fish because data on fish prices in China has not been
found. The production of hairtail is relatively large,
and it is distributed in China's Yellow Sea, East China
Sea, Bohai Sea, and even the South China Sea.
3) Variable Selection of Supply Function:
Supply refers to the quantity of a good that the
producer plans to sell in the market. The pool will be
determined by price, the number of suppliers, the
state of technology, government subsidies, weather
BDEDM 2022 - The International Conference on Big Data Economy and Digital Management
738

conditions, and the availability of workers to produce
the good (Hu, Pan, Zhang, Tao, 2020). Based on this
reminder of factors affecting supply, first, I chose the
ex-factory price index of industrial producers to
estimate the cost of raw materials. The increase in the
ex-factory price index of industrial producers means
an increase in the cost of the enterprise, so this will
lead to a decrease in the production of the enterprise,
which will naturally lead to a reduction in supply.
Secondly, I chose sea level temperature as the second
variable that affects supply because the problem
which I am exploring is to predict the consumption of
fish in China. The response of fish to changes in water
temperature is enormous. If the temperature exceeds
or falls below the optimum temperature for the fish, it
will cause the death of the fish and thus reduce the
yield. Therefore, the supply function can be expressed
as follows:
𝑆𝑢𝑝𝑝𝑙𝑦: 𝑄 = 𝛼
+𝛼
𝑃+𝛼
𝑃𝐹 + 𝛼
𝑆𝑇 + 𝜖
Table 1: The explanation of variables in supply function.
Variables Explanation
Q Per capita fish consumption
P The price of hairtail
PF
The ex-factory price index of industrial
producers
ST Sea surface temperatur
4) Variable Selection of Demand function:
The demand for a good depends on several factors,
such as the price of the sound, perceived quality,
advertising, income, the confidence of consumers,
and changes in taste and fashion (Yobero, 2016).
Based on such a reminder of factors that affect
demand, I plan to choose residents' per capita
disposable income as the first variable of the demand
equation, but because China only began to investigate
residents' per capita disposable income in 2013. So, I
chose GDP per capita as the variable that affects
demand. Secondly, I chose eggs as a substitute for
fish. Because eggs and fish are both important sources
of protein for humans. Therefore, the price of eggs is
used as the second variable that affects demand. Thus,
the demand function can be expressed as follows:
𝐷𝑒𝑚𝑎𝑛𝑑: 𝑄 = 𝛽
+𝛽
𝑃+𝛽
𝑃𝑆 + 𝛽
𝐷𝐼 + 𝜖
Table 2: The explanation of variables in demand function.
Variables Explanation
Q Per capita fish consumption
P The price of hairtail
PS The price of eggs
DI Per capita GDP
5) The Reduced-Form Equation: The
reduced-form equations express the endogenous
variables as a function of the exogenous variables,
where 𝑃 and 𝑄 are exogenous variables and 𝑃𝑆,
𝐷𝐼, 𝑆𝑇, 𝑎𝑛𝑑 𝑃𝐹 are exogenous variables.
𝑃=𝜋
+𝜋
𝑃𝑆 + 𝜋
𝐷𝐼 + 𝜋
𝑃𝐹 + 𝜋
𝑆𝑇 + 𝑣
𝑄=𝜋
+𝜋
𝑃𝑆 + 𝜋
𝐷𝐼 + 𝜋
𝑃𝐹 + 𝜋
𝑆𝑇
+𝑣
2.4 Identification
Because the reduced-form equation has 8 parameters
equal to the structural equation's parameters, this
simultaneous equation system is just recognized.
2.5 Two-stage Least Squares
Estimation
1) The Process of Two-Stage Least Squares
Estimation: Because the endogenous variable is
related to the error term in the supply and demand
equation, the least square method cannot estimate the
parameters here. Instead, choose to use Two-Stage
Least Squares Estimation. The first step is to apply
the least-squares method to the reduced-form
equation of the endogenous variable 𝑌
as the
explanatory variable to obtain its estimated value 𝑌
.
The second step is to substitute the estimated value
𝑌
. into the right side of the estimated structural
equation to replace the endogenous variable 𝑌
as the
explanatory variable, and then apply the least square
method again to obtain the estimated value of the
structural parameter.
2) Correlation of Exogenous Variable: The
use condition of Two-Stage Least Squares Estimation
is that there is no serious multicollinearity between
exogenous variables. So, the correlation between
exogenous variables needs to be tested.
3 ASSUMPTION
1. Assume that people all over China do not have
serious prejudice against hairtail.
The Forecast of the Fish Consumption in China based on Experimental Analysis
739
2.Assume that per capita GDP is even people’s
disposable income.
3. Assume that there is no large-scale outbreak of
infectious diseases (such as the outbreak of Covid19).
4 RESULT
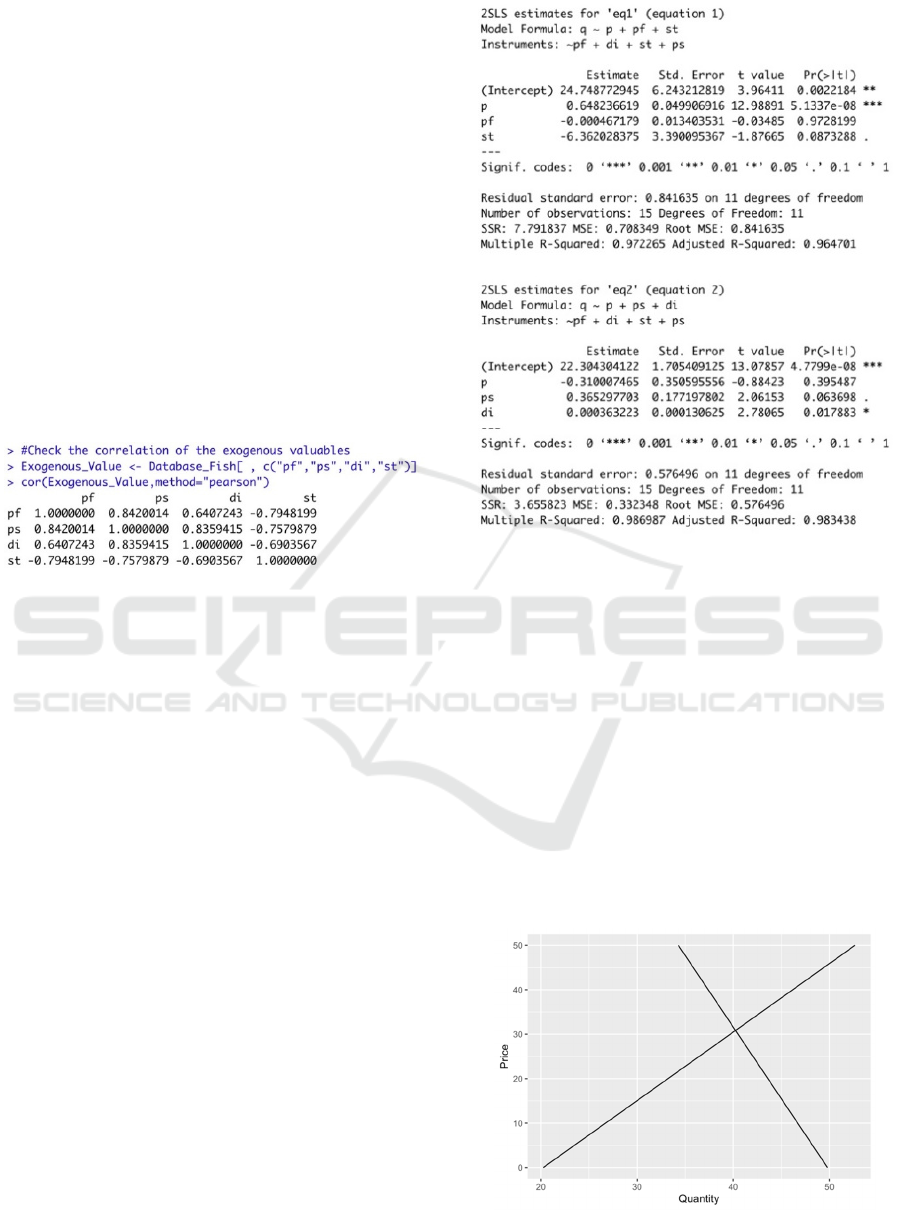
4.1 The Result of Correlation of
Exogenous Variable
Test the correlation between exogenous variables
using the c𝑜𝑟() function in R, as shown in figure 2
below. As a result, it can be found that there is a certain
correlation between exogenous variables, but the
severity of multiple gong xian x cannot be clearly
defined. Therefore, it cannot be judged whether there
is serious multicollinearity between them.
Figure 2: The result of the correlation of exogenous variable
by using 𝑐𝑜𝑟() in r.
4.2 Estimated Supply and Demand
Function
According to the result of the 𝑠𝑦𝑠𝑡𝑒𝑚𝑓𝑖𝑡() function
in r (Figure 3). The estimated parameters of structural
equations of supply and demand function can be
determined. The estimated supply function is
𝑄 = 24.748772945 + 0.648236619𝑃
− 0.000467179𝑃𝐹
+ −6.362028375𝑆𝑇
and the estimated demand function is
𝑄 = 22.304304122 + −0.310007465𝑃
+ 0.365297703𝑃𝑆
+ 0.000363223𝐷𝐼
Figure 3: The estimated parameters of structural equations
of supply and demand function.
4.3 Verification
Bring the values of the four variables of PT, PS, DI,
and ST in 2018 into the estimated supply equation and
demand equation, and get the estimated supply
equation:
𝑄 = 20.2406741474 + 0.648236619𝑃
and the estimated demand equation
𝑄 = 49.79757141783484099 − 0.310007465𝑃
The graph of the two equations can be shown in
figure 4.
Figure 4: The estimated supply equation and demand
equation for 2018.
BDEDM 2022 - The International Conference on Big Data Economy and Digital Management
740

Combining these two equations can then get the
predicted value of the price 𝑃
,
49.79757141783484099 − 0.310007465𝑃
= 20.2406741474
+ 0.648236619𝑃
𝑃
= 30.8449
Then substitute the predicted value into the
estimated supply equation to get the predicted value of
the fish consumption 𝑄
,
𝑄
= 20.2406741474 + 0.648236619 ∗ 30.8449
= 40.2354678367931
Compared with the actual value of the price 𝑃=
27.3467,
𝐸𝑅𝑅 =
|𝑃 − 𝑃
|
𝑃
≈ 0.1134136707
Therefore, the relative error of the model is about
11.3%.
5 CONCLUSION
In general, the simultaneous equation model used in
this article can get a rougher supply equation and
demand equation. I think three reasons affect the
accuracy of the model: The first reason is that the
Pearson correlation coefficient obtained in the
previous correlation test of exogenous variables is
significant, which shows that the correlation between
exogenous variables is very high. It may affect the
accuracy of the model. The second reason is that I used
per capita GDP instead of the more real per capita
disposable income. This approach has significantly
improved the judgment of the people's economic level,
which will shift the demand equation. The third is that
I used the price of hairtail to replace the price of fish,
but hairtail is not a very accurate replacement for the
cost of fish. Because hairtail is not so popular in every
part of China, people in the mainland may reduce their
consumption of hairtail because of its fishy smell.
In addition, the more severe problem is that the
method in this article can only get the estimated supply
equation and demand equation. But if you want to use
this estimated equation to predict fish consumption in
China, you need to predict the values of four
exogenous variables (ST, DI, SF, and PS). This is
more difficult than getting the estimated supply and
demand equation.
ACKNOWLEDGMENT
We would like to thank Professor Sangeet Kumar
Srivastava who provided useful comments on this
research. In addition, I also need to thank other
students who helped us in this research.
REFERENCES
Economic Models. Retrieved 5 December 2021, from
https://www.sfu.ca/math-
coursenotes/Math%20157%20Course%20Notes/sec_e
conomic_models.html.
Heffernan, S. (2021). How much protein can fish provide
us with?. Retrieved 5 December 2021, from
https://www.rte.ie/brainstorm/2021/1027/1256148-
fish-protein-health/.
How Much Protein Is Simply Too Much?. Retrieved 5
December 2021, from
https://www.sclhealth.org/blog/2019/07/how-much-
protein-is-simply-too-much/.
Hu, Y., Pan, Z., Han, Z., Lin, Z., & Tao, Z. (2020,
November). Forecasts for the fish Migration and
Fishing time under Marine Environment Changes based
on the ARIMA model. In 2020 2nd International
Conference on Economic Management and Model
Engineering (ICEMME) (pp. 352-355). IEEE.
Hu, Y., Pan, Z., Zhang, C., & Tao, Z. (2020, November).
Risk Assessment and Investment Strategy of Fishery
Company under Marine Environment Changes. In 2020
2nd International Conference on Economic
Management and Model Engineering (ICEMME) (pp.
692-695). IEEE.
OECD-FAO Agricultural Outlook 2015-2024. (2015).
Retrieved 5 December 2021, from
https://www.fao.org/3/i4738e/i4738e.pdf.
Pettinger, T. (2021). Factors affecting demand - Economics
Help. Retrieved 5 December 2021, from
https://www.economicshelp.org/microessays/equilibri
um/demand/.
Sustainable Seafood 101 - Sustainable Fisheries UW.
Retrieved 5 December 2021, from
https://sustainablefisheries-uw.org/seafood-101/.
Ye, Y. (1999). Retrieved 5 December 2021, from
https://www.fao.org/3/X3216e/X3216E00.pdf.
Yobero, C. (2016). Simultaneous Equation Models:
Estimating Supply and Demand Functions. Retrieved 5
December 2021, from https://rstudio-pubs-
static.s3.amazonaws.com/195495_d47be7c818424a3c
9bfa5452dd17c6c6.html.
The Forecast of the Fish Consumption in China based on Experimental Analysis
741
