
WAGE Returns to Education under Different Levels of Higher
Education based on Big Data Analysis
Jing Wang
1,2 a
and Hui Zhang
1b
1
School of Economics and Management, Wuhan University, Luojia Street, Wuhan, China
2
Economics, The University of Sheffield, Sheffield, UK.
Keywords: Wage, Higher Education, 2SLS, Endogeneity Test, Big Data.
Abstract: In recent years, the rapid growth of the internet has brought about an era of big data, bringing opportunities,
challenges and changes to both higher education and people's income levels. The labour market and the
education market are closely linked and the level of education is crucial to a country's economic development.
This paper uses data from CLDS 2018 and regression analysis method in big data analysis to argue for a
relationship between them and to test for endogeneity. The findings show that there is a significant positive
correlation between the level of higher education and wage, and this feature will be maintained over time.
Therefore, the country and government should focus on how to make higher education more accessible and
should make higher levels of higher education accessible to those in the labour market.
1 INTRODUCTION
The current era is the era of big data, in which
artificial intelligence is becoming more and more
developed. In addition to driving economic growth, it
also poses a huge challenge to the modern labour
market, which requires people in the labour market to
have a higher level of education in order to take
advantage. According to the National Bureau of
Statistics of China, since 1995, when the development
strategy of "developing the country through science
and education" was proposed, the national financial
expenditure on education has risen from RMB
1,411,523,300,000 in 1995 to RMB 400,465,500,000
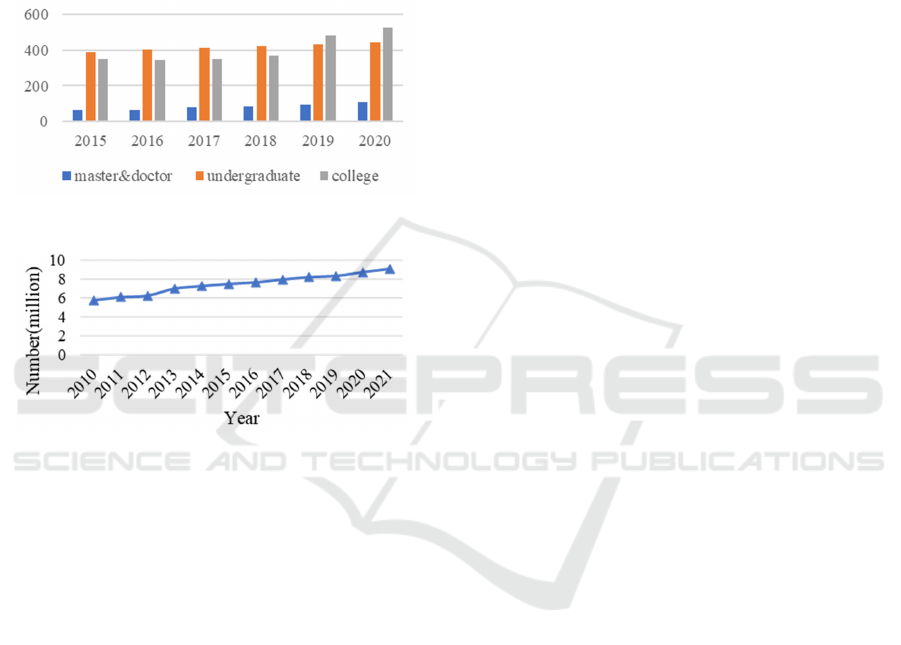
in 2019, that is, an increase of 183.79%. Figure 1
shows the number of students who received higher
education for the six years from 2015 to 2020, from
which it can be found that the number of people who
can receive higher education in China is increasing
year by year, and the scale of higher education is
expanding rapidly, which makes Chinese higher
education change from elite education to mass
education and increases people's access to receive
higher education, which can satisfy the needs of the
development of the times. Figure 2 shows the number
of graduates who have received higher education
a
https://orcid.org/0000-0003-2338-4444
b
https://orcid.org/0000-0003-2377-4000
from 2010 to 2021, with the number of higher
education graduates in 2021 being approximately
1.58 times that of 2010, and the overall trend predicts
that in the future labour market, the number of the
graduates who have received higher education in the
labour force is expected to increase in the future.
However, the quality of higher education has
become one of the major concerns of scholars.
According to the National Bureau of Statistics of
China, as of 2019, the number of doctoral graduates
in China is 625,780,000, the number of master's
graduates is 577,088,000, the number of
undergraduate graduates is 3,947,157,000, and the
number of college graduates is 3,638,142,000, and
from the analysis of the data, the college graduates
account for 44% of the total graduates who have
received higher education, undergraduate graduates
account for 48% of the total graduates, the number of
master's degree graduates accounts for 7% of the total
number of university graduates, while doctoral
graduates only account for 1% of the total number of
university graduates. This shows that although there
are many graduates with higher education in the labor
market, the higher the level of education, the smaller
the number of graduates, and the doctor degree is
definitely at the top of the education pyramid.
Wang, J. and Zhang, H.
Wage Returns to Education under Different Levels of Higher Education based on Big Data Analysis.
DOI: 10.5220/0011360600003440
In Proceedings of the International Conference on Big Data Economy and Digital Management (BDEDM 2022), pages 979-985
ISBN: 978-989-758-593-7
Copyright
c
2022 by SCITEPRESS – Science and Technology Publications, Lda. All rights reserved
979
Currently, most of the papers on the study of
higher education attainment levels and their income
in China are from the perspective of the theoretical
foundations of pedagogy, with less empirical research
on the relationship between the two. Therefore, this
paper will analyse and study the relationship between
people with higher education levels and their wage in
China based on the context of big data analysis, using
data from the 2018 China Labour Force Dynamics
Survey and an empirical research approach.
Figure 1: The number of higher education enrolment.
Figure 2: The number of college graduates in China.
2 LITERATURE REVIEW
With the development of the Big Data era, higher
education institutions can use this opportunity to
enhance the education of their students and provide
innovative educational experiences (Huda, et al.,
2016). In his thesis, Kang (Kang 2004) integrated and
summarised the whole process of higher education
reform in China since the founding of New China, in
which the state also focused on the balanced
development of quantity and quality among regions,
for example, transferring educational resources to the
western region, and at the same time, the reform of
higher education also brought about rapid economic
development. Lee et.al. (Lee, et.al, 2015) argued that
access to higher education may actually be a risky
investment. They develop a model in which they state
that the income return to higher education is not the
same for each individual, as it is a continuum: firstly,
to determine whether it is possible to enter university
for higher education, and secondly, whether it is
possible to successfully complete higher education
and obtain the corresponding degree. Walker and Zhu
(Walker, Zhu, 2008) used cross-sectional data from
the 1994-2006 Quarterly Labour Force Survey in the
UK to examine how the sharp increase in higher
education graduates in the UK would affect the level
of the wage premium and conclude that, although
there are large fluctuations in the results of the
empirical study, the relatively small scale of the
significant increase in university higher education
graduates The increase in the number of graduates
from university higher education did not result in a
significant wage premium due to their relatively small
size. In the study, Fortin (Fortin 2006) pointed out
that there is a strong link between policies on higher
education, the number of students enrolled in higher
education and wages between states, as there is some
variation between states in the US. Livanos and
Nunez (Livanos, Nunez, 2012) comparatively
analysed differences in earnings returns to higher
education by gender using data from case and labour
force surveys in Greece and the UK and using Oxaca-
Blinder's decomposition method. The results of the
study found that most of the differences in higher
education graduates in Greece and the UK could be
explained, with only a very small number of
unexplained reasons. In his study, Zhong (Zhong
2011) pointed out that most of the studies on higher
education and return on income nowadays have
mostly used people's years of schooling as a measure
of the level of education received, and few have
studied the relationship between the quality of higher
education and return on income from higher
education, and most of the studies have focused on
developed countries such as the UK and the US. In
his study, he therefore examines the relationship
between the quality of higher education and its return
to income using OLS regression analysis, using the
quality of higher education as an indicator, in the
context of China, the world's largest developing
country. Fang (Fang 2012) conducted an empirical
study of higher education schools with transnational
higher education programmes in China, comparing
the differences between research and teaching
universities. Colclough et.al. (Colclough, et.al, 2010)
pointed out that although education does not have a
direct interest in the market, it can help people to be
more productive and earn more in the labour market,
thus indirectly creating social productivity and
generating wage returns for people. Asadullah et.al.
(Asadullah, et.al, 2020) studied the returns to
education in the Chinese labour market using data
from two rounds of the Chinese General Social
Survey and based on Mincer's income equation and
BDEDM 2022 - The International Conference on Big Data Economy and Digital Management
980

the least squares (OLS) method, which showed that
those with higher education degrees had higher
earnings from education.
From the above studies, it can be tentatively
concluded that there exists a strong link between
higher education and wage returns, and that the two
are positively related. Most of the existing studies
have examined the relationship between years of
education and wage return earnings, and there is some
literature on the relationship between education levels
and labour market wage earnings in China, but most
studies have compared the difference in wage returns
between primary and tertiary education. With the
reform of higher education in China in recent years,
more and more people have been able to access higher
education, higher education has become universal,
and the wage income levels of those who have
received higher education are significantly higher
than those who have only received primary education,
so more attention should be paid to studying the
relationship between higher education and wage
income returns. However, there are different
classifications and standards for the quality of higher
education in China, and existing studies do not take
into account the actual national context of China.
Therefore, this thesis classifies the level of higher
education according to four different levels: college,
undergraduate, master and doctor, according to the
actual situation in China. In addition, the traditional
'education-income' model does not take into account
the endogeneity of education, so this paper uses an
instrumental variables approach to correct for
endogeneity.
3 DATA AND METHODOLOGY
3.1 Data
The data used in this paper is the China Labour Force
Dynamics Survey data included in the 2018 survey by
the Social Science Research Centre of Sun Yat-sen
University, referred to as CLDS 2018. The China
Labour Force Survey is a project started by Sun Yat-
sen University since 2012, and this project is a
biennial tracking survey of urban and rural residents
in China, covering individuals, households and
communities in almost all provinces of China (except
Taiwan Province and Tibet), and the coverage of the
survey includes the education level, employment and
income of the respondents, and the data are cross-
sectional. The CLDS study used a round-tripping
questionnaire in which the sample was randomly
divided into four sections, which were followed for a
total of six years and then updated. The data structure
of this survey can be roughly divided into six layers:
information about the individual's community,
information about the individual's family, basic
information about the individual and his/her parents,
information about the individual's work, information
about the individual's history and some other
information about the individual. The relationship
between higher education qualifications and wage
returns is the subject of this study, and the survey
includes the qualifications of the individual
respondents, which meets the needs of this study. A
total of 16,537 respondents were included in the
CLDS2018 data, and after excluding some missing
samples, the study data for this paper is 1,480.
3.2 Methodology
The underlying model used in this paper is the Mincer
income equation model, which can be expressed by
the following equation.
lnwage=α+β
0
E+β
1
S+β
2
exp+β
3
exp
2
+γZ+ε (1)
The following are the meanings of the expressions
in the formula. The first variable lnwage represents the
logarithm of the respondent's wage and the wage
chosen is the wage level given in the database for
2017. S indicates the number of years of education of
the respondent, but the database chosen does not give
the number of years of education of the respondent
directly, so it should be calculated using equation (3).
β
0
represents the wage returns to different higher
education qualifications, β
1
is a coefficient on years of
education, β
2
is a coefficient on years of work, and β
3
is a coefficient on the square of years of work. E
represents the different levels of education in higher
education and exp represents the work experience of
the respondents, but as work experience is not
measurable, the number of years the respondents have
worked was chosen as a measure of work experience,
and exp2 represents the squared term of work
experience, Z is some other control variable and ε is
the residual term. However, the years of work is also
not given directly in the database of CLDS2018.
Therefore, it needs to be calculated by equation (4) to
obtain it.
age=2018-birth year (2)
S=Highest degree graduation yea
r
-
b
irth yea
r
-6 (3)
Of the three additional equations, equation (2) is
used to calculate the age of the respondents, as the
Wage Returns to Education under Different Levels of Higher Education based on Big Data Analysis
981
database used in this paper is from 2018, and therefore
the age of the respondents in the context of the
prevailing environment is 2018 minus their respective
year of birth, which is represented in this paper as birth
year. Equation (3) is used to calculate the years of
education of the respondents. In China, people's
formal education starts at the age of 6, so the years of
education need to be subtracted by 6 from the end of
the highest education minus the year of birth. Equation
(4) is used to calculate the years of work of the
respondent, the principle is to use the respondent's age
first minus the years of education, as the years of
education does not include the period of time before
the individual is 6 years old, so you need to calculate
the result on the result minus 6, so the final result to
get the years of work of the respondent, used to
represent the work experience of the respondent.
Overall, the idea of this paper is to use a stepwise
regression approach, adding the four control variables
in turn to obtain the best-fit equation, and then observe
the validity of the model and the change in the
coefficients to obtain a relationship regarding the
relationship between higher education qualifications
and wage returns. Finally, as education is somewhat
endogenous, the paper subsequently uses the
educational attainment of the respondent's mother as
an instrumental variable to correct for endogeneity.
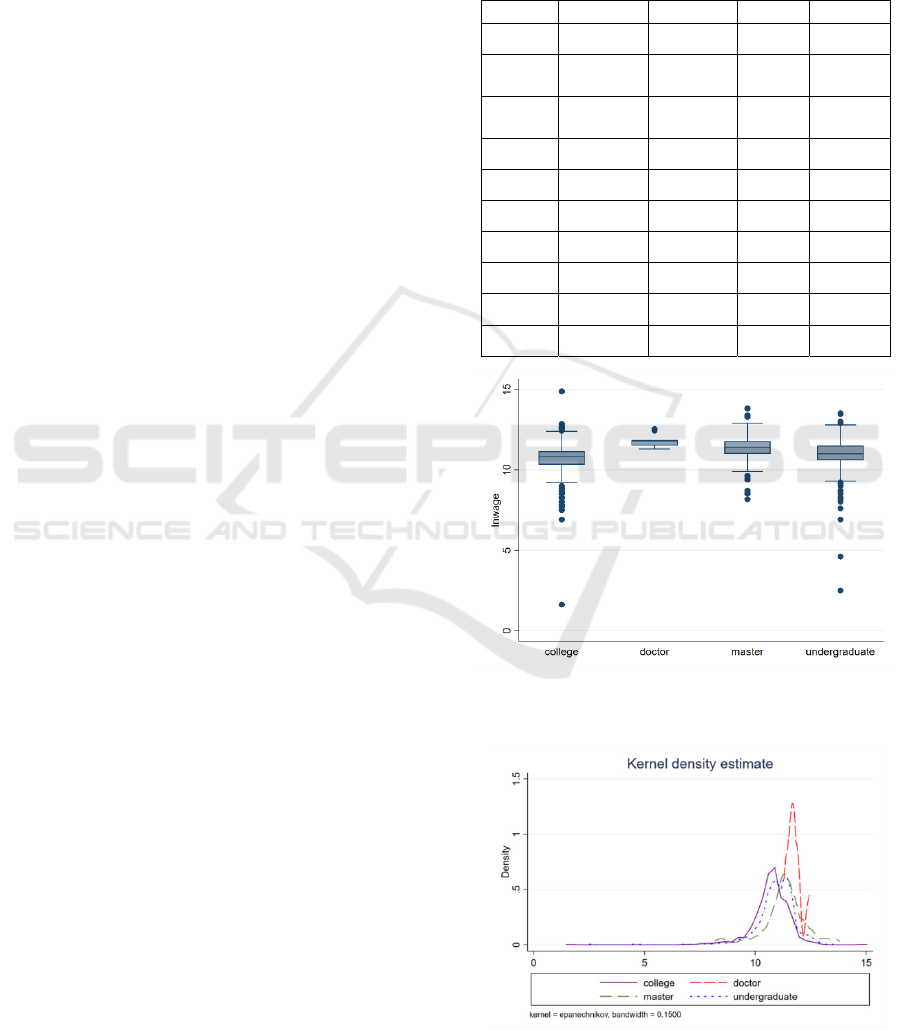
3.3 Descriptive Statistics
Table 1 provides the summary statistics of the dataset.
As can be seen from the table 1, the mean of the
logarithm of wage returns is 10.855, a figure that is not
significantly different from the median figure, a result
that indicates a relatively even distribution of income
return receipts among the respondents in the database.
Figure 3 shows a box plot of the logarithm of higher
education levels on wage returns for different levels of
education, from which the following results can be
found. The first is that it is clear from the figure that
the average level of wage returns by qualification
tends to increase with higher education qualifications,
for example respondents with a doctor degree have a
significantly higher average level of wage returns than
respondents with other qualifications. Secondly, in
terms of the distance between the upper and lower
quartiles, the box plot for PhD qualifications has the
smallest distance between the upper and lower
quartiles, indicating the most concentrated distribution
of wages, followed by masters, undergraduates and
colleges in that order. Figure 4 shows the Kernel wage
distribution for different levels of tertiary education.
From the figure, it can be seen that the trends of the
curves of the Kernel wage distribution for the four
higher education levels are broadly similar, but the
peaks appear at different locations for each
qualification, indicating that each higher education
level corresponds to a different probability density of
wage returns.
Table 1: Summary statistics.
mean sd min max
Edu 1.568 0.622 0 4
S 10422 30611
-
98013
9838
exp -10520 30359
-
97981
48
exp2 1.03e+09 2.97e+09 0 9.6e+09
lnwage 10.855 0.939 1.609 14.88
gender 0.497 0.500 0 1
lnWage 0 1.000 -9.85 4.288
lnS 3.823 2.675 1.099 11.49
Exp 0 1.000 -2.88 0.348
lnexp2 6.321 6.118 0 22.99
Figure 3: lnwage box plot at different levels of higher
education.
Figure 4: Kernel wage distribution in different levels of
higher education
BDEDM 2022 - The International Conference on Big Data Economy and Digital Management
982
4 RESULTS
4.1 Analysis of OLS Regression Results
As it can be seen from the previous analysis, there are
multiple control variables in this study, so this paper
has chosen a stepwise regression analysis to
investigate the relationship between higher education
qualifications and wage earnings by adding control
variables one by one. The estimation results in Table
2 demonstrate the impact of four different tertiary
education qualifications on wage earnings under
different control variables, and allow the robustness of
the regressions to be analysed in the light of the
results. The control variables selected in this paper are
lnS, Exp, lnexp2 and gender, which are added to
models 2, 3, 4 and 5 in turn. These five models are
denoted as M1, M2, M3, M4 and M5 respectively, and
M5 is the final result presented after the addition of the
four control variables. As can be seen from the table,
the regression coefficient for M1 is 0.264, expressing
the implication that after controlling for the remaining
four control variables, there is a positive relationship
between the respondents' level of tertiary education
and their wage returns, and that for each level of
tertiary education, their average wage returns increase
by 26.4%. The regression coefficient for educational
attainment is gradually increasing with the inclusion
of the control variables. At M5, the regression
coefficient is 0.324, indicating that with the inclusion
of all of the paper's control variables, their average
wage return increases by 32.4% when each level of
higher education qualification is increased. R-sq in the
table is the square of R, which represents the fit of each
model, i.e. the percentage change in the dependent
variable for the fitted model, and it can be seen from
the table that the overall model has a perfect good fit.
The F-values in the table represent the F-statistic,
which is a variance test for the validity of each
corresponding model. Based on the F-values obtained
in the table it can be seen that the F-values for models
1 to 5 are all statistically significant at the 1% level
and therefore all five models are valid. The results of
this stepwise regression illustrate that an increase in
higher education qualifications does have a positively
correlated contribution to wage returns.
Table 2: OLS estimation of the effect higher education
quality on wage returns.
Var M 1 M 2 M 3 M 4 M 5
Edu
0.264
***
0.298
***
0.298
***
0.330
***
0.324
***
(6.40) (7.00) (6.96) (7.73) (7.65)
lnS
0.023
***
0.034 0.061 0.026
(2.36) (0.32) (0.58) (0.25)
Exp 0.030
0.684
***
0.534
*
(0.11) (2.28) (1.79)
Ln
exp2
0.100
***
0.090
***
(6.54) (5.91)
gend
e
r
0.276
***
(5.44)
_cons
-0.419
***
-0.544
***
-0.586
-1.355
***
-1.287
***
(-5.96) (-6.54) (-1.45) (-3.19) (-3.06)
N 1480 1427 1427 1396 1396
R-sq 0.026 0.034 0.034 0.061 0.079
F
41.016
*
**
26.405
*
**
17.595
*
**
23.473
*
**
25.081
*
**
t statistics in parentheses
* p<0.1, ** p<0.05, *** p<0.01
4.2 The Result of 2SLS
In the case of the education-income model, the
endogeneity of education arises because of omitted
variable errors. In practice, it can be found that even
if two people have the same years of education and
the same work experience, there is still a certain
difference in their salaries, which is caused to a large
extent by the different "abilities" of the two people,
for example, one is more efficient than the other. The
reason for this is to a large extent that two people have
different "abilities", for example, one is more
efficient than the other, so it is not really possible to
determine whether the person with the higher salary
has a higher level of education or whether it is
because he is more competent. In this paper, the
instrumental variables approach will be used to
address the issue of endogeneity. Based on the data
available in CLDS2018, the household location of the
respondents was selected as an instrumental variable
to correct for educational endogeneity. Table 3 show
the results of the 2SLS regression. The Hausman test
was first conducted and the result was less than 0.005,
so the original hypothesis of "all explanatory
variables are exogenous" can be rejected, that is, there
Wage Returns to Education under Different Levels of Higher Education based on Big Data Analysis
983

are endogenous explanatory variables. The F-value of
the weak instrumental variables was then tested, and
was greater than 10, so the original hypothesis could
be rejected. In addition, according to the first stage
regression results of 2SLS, the respondents'
household location was positively correlated with the
level of higher education they could receive,
indicating that the level of higher education that those
living in urban areas could receive was significantly
higher than those living in rural areas. According to
the results of the second stage of the 2SLS regression,
the conclusions obtained from the 2SLS are
consistent with the OLS findings, that is, the higher
the level of higher education that people can receive
has a significant positive correlation with wage
income.
Table 3: The result of 2SLS.
2SLS results
First-stage regression (explained
variable: Edu)--Household
registration
0.08
Second-stage regression (explained
variable: lnwa
g
e
)
--Hi
g
her education
1.628
N
1076
R
2
0.0448
Weak identification test——F value
10.928
Hausman test——Prob>chi2
0.0042
5 CONCLUSION
The findings of this paper are as follows. Firstly,
higher education has become more common in China
and more and more people are able to access it, but
the quality of the higher education people receive is
still the point of greatest concern for the state and the
people who need it. In this context, the quality of
higher education can have two meanings: one is the
level of qualifications in higher education and the
other is the quality of the schools in which higher
education is offered. In recent years, Chinese
economy has been growing faster and faster, and this
faster economic growth relies heavily on the level of
education of the workforce. The more educated
workers are, the quicker they can integrate into the
labour market, thus reducing training costs to a
certain extent and generating greater returns in the
labour market. Therefore, in the future development
of higher education in China, we should not only
focus on quantitative growth, but also on quality
education for students. Secondly, it is important for
individuals and families to be properly aware of the
level of importance of investment in higher education
as well as the quality of higher education. According
to the empirical results of this paper, the higher the
level of quality of higher education received, the
greater will be their future wage return income. It is
therefore important for individuals and families to
take a longer-term view, recognise the future benefits
of education and achieve long-term education and
sustainability of their own education. What is more,
regional differences have a large impact on access to
higher education, and there are two aspects to
regional differences: urban-rural differences and
differences between cities. To address this problem,
the country and government should introduce
relevant policies and incentives to allocate more
quality teachers to teach in rural areas, and provide
more education funds to rural areas so that they have
better education resources than they do now; at the
same time, they should also focus on the development
and balanced distribution of higher education
between provinces, and establish more higher
education schools in provinces that currently have
fewer higher education schools. enabling students to
have greater access to higher levels of higher
education. Finally, the findings of this paper confirm
that there is indeed a close relationship between the
quality of higher education and wage returns, which
also suggests that there is also a close relationship
between the further development of China's future
labour market and people's higher education
qualifications. The current era is the era of big data
and artificial intelligence. Some of the more basic
jobs may be replaced by artificial intelligence step by
step in the future, and more people may face the
dilemma of unemployment. But it also requires us to
focus on the development of our own education and
not to stick to the status quo, but to keep learning new
skills to cope with the trends and developments in the
world. At the same time, the state should also pay
more attention to the cultivation of the quality of
human capital. To make people's lives better in the
future, it should devote itself to raising the level of
people's education quality, and should also narrow the
gap in the uneven distribution of educational
resources, for example, by assigning more excellent
teachers to remote places such as the West, raising the
level of welfare, attracting more talents to teach in the
countryside, and raising the overall level of higher
education in China step by step to ensure the stable
development of the economy.
BDEDM 2022 - The International Conference on Big Data Economy and Digital Management
984

REFERENCES
Asadullah, M. N., & Xiao, S. (2020). The changing pattern
of wage returns to education in post-reform china.
Structural Change and Economic Dynamics, 53, 137-
148.
Colclough, C., Kingdon, G., & Patrinos, H. (2010). The
changing pattern of wage returns to education and its
implications. Development Policy Review, 28(6), 733-
747.
Fang, W. (2012). The development of transnational higher
education in China: A comparative study of research
universities and teaching universities. Journal of
Studies in International Education, 16(1), 5-23.
Fortin, N. M. (2006). Higher-education policies and the
college wage premium: Cross-state evidence from the
1990s. American Economic Review, 96(4), 959-987.
Huda, M., Anshari, M., Almunawar, M. N., Shahrill, M.,
Tan, A., Jaidin, J. H., ... & Masri, M. (2016). Innovative
teaching in higher education: The big data approach.
TOJET, 1210-1216.
Kang, O. (2004). Higher education reform in China today.
Policy Futures in Education, 2(1), 141-149.
Lee, S. Y. T., Shin, Y., & Lee, D. (2015). The option value
of human capital: Higher education and wage inequality
(No. w21724). National Bureau of Economic Research.
Livanos, I., & Nunez, I. (2012). The effect of higher
education on the gender wage gap. International Journal
of Education Economics and Development, 3(1), 33-47.
Walker, I., & Zhu, Y. (2008). The college wage premium
and the expansion of higher education in the UK. The
Scandinavian Journal of Economics, 110(4), 695-709.
Zhong, H. (2011). Returns to higher education in China:
What is the role of college quality? China Economic
Review, 22(2), 260-275.
Wage Returns to Education under Different Levels of Higher Education based on Big Data Analysis
985
