
Research on Financial Quality Evaluation of New Energy Listed
Companies based on Factor Analysis and Cluster Analysis
Ziyu Huang
a
School of Economics and Management, Beijing Jiaotong University, Beijing, China
Keywords: Factor Analysis, Cluster Analysis, Financial Situation, New Energy Listed Companies.
Abstract: This paper will study the financial conditions of 118 listed companies in the energy industry in 2020, extract
four common factors reflecting four aspects of financial conditions from 12 indicators by factor analysis, and
rank the companies by calculating the scores of each factor and the total scores. According to the four factors
extracted, the clustering analysis is carried out on the companies, and the 118 companies are divided into three
types by means of multiple comparison of the mean value, namely, strong companies, ordinary companies
and problem companies, which provides certain basis for the managers to make business decisions and
investors to make investment decisions. Finally, countermeasures and suggestions are put forward to improve
the operating performance of listed companies in the energy industry, pointing out the direction for energy
enterprises to improve their performance and better development.
1 INTRODUCTION
Since the 21st century, the rapid development of
Tesla has stimulated the innovation of the new energy
industry and the overall quality improvement of
related industries, and the development is in the
ascendant. Under a series of complex backgrounds
such as global economic integration and sluggish
world economy, China's new energy listed companies
are facing a very severe situation and are under great
pressure at home and abroad.
2 LITERATURE REVIEW
Since the 20th century, foreign scholars have studied
many methods of financial quality evaluation,
including enterprise credit ability index, DuPont
financial analysis system, Balanced Scorecard, Z
scoring model. Later, with the popularity and
maturity of statistical software such as SAS, SPSS
and STATA, multivariate statistical analysis method
was also applied to various fields such as financial
quality analysis, including factor analysis.
Hornungova, Jana et al. (Jana, et al, 2016) used
correlation analysis and factor analysis to eliminate
a
https://orcid.org/0000-0003-2387-4020
information duplication, reduce dimensions, and
reduce the 13 financial indicators originally
concentrated in basic indicators into three categories.
Meanwhile, Pearson chi-square test shows that the
above indicators are correlated with the company size
to a certain extent, and the largest and most
significant indicator related to the company size is
"operation indicator". Yulin GE and Jing Y used
factor analysis method to study the financial quality
of listed retail companies and know the development
level of each company in the industry through
comparison, which provides a direction for
improving the financial quality of enterprises.
Santosh Kumar Yadav, M. Dharani (2019) examined
the financial quality of banks based on the financial
ratio study, obtained the final ranking of banks by
using the TOPSIS method from 2010 to obtain the
standard value by using the entropy method.
After the reform and opening up, domestic
scholars began to explore and study enterprise
financial quality and established a perfect enterprise
financial quality evaluation system from two research
perspectives. First of all, on the macro understanding,
such as professor Zhang Xinming (Zhang, 2013)
believes the financial quality terms from the book to
see the quality of the enterprise financial situation,
have the profit is the main business of the company
986
Huang, Z.
Research on Financial Quality Evaluation of New Energy Listed Companies based on Factor Analysis and Cluster Analysis.
DOI: 10.5220/0011361600003440
In Proceedings of the International Conference on Big Data Economy and Digital Management (BDEDM 2022), pages 986-991
ISBN: 978-989-758-593-7
Copyright
c
2022 by SCITEPRESS – Science and Technology Publications, Lda. All rights reserved

can rely on production of timely and efficient
distribution of dividends, bonuses, etc., should at
least include asset quality quality, quality of capital
structure, profits and cash flow quality. Other
scholars, starting from the micro aspect, evaluate the
financial quality through a variety of analysis
methods, the more common methods are factor
analysis, EVA evaluation method, balanced
scorecard method and entropy method. For
example, Based on the financial data of 13 listed
companies of Xinjiang Production and Construction
Corps, Wang Haixia and Guo Jiaxi (Guo, 2016)
found that the listed companies of Xinjiang
Production and Construction Corps had a low level of
proximity from the effectiveness analysis of DEA
model, and Malquist index was used for dynamic
analysis, suggesting that the relative performance
from 2010 to 2014 declined instead of rising. Li
Xiaoyan (Li, 2014) analyzed the index data of 16
commercial banks in 2011 with the entropy method
of objective weighting, and obtained the ranking of
16 commercial banks through comprehensive
evaluation. During the analysis, she found that
profitability and growth play an important role in
evaluating the financial quality of commercial banks.
3 SAMPLE SELECTION AND
DATA SOURCES
All financial data in this paper are from the CSMAR
database. According to the definition of the new
energy industry, 118 a-share new energy listed
companies in Shanghai and Shenzhen are selected in
this paper, including Kaier New Materials, Yueng
Holdings... Gigaweft lithium energy, etc. In order
to comprehensively analyze the financial quality of
the new energy industry, *ST company is retained
and the following companies are excluded :(1)
companies that have just been listed for less than two
years, which are not conducive to empirical research;
(2) companies with incomplete financial data and
obvious errors in some information are excluded from
the sample.
Based on the relevant theory of financial capacity,
this paper selected twelve variable indicators,
including current ratio, cash ratio, asset-liability ratio,
growth rate of total assets and net profit growth rate,
operating income growth, accounts receivable
turnover, inventory turnover, total assets turnover
ratio, total assets net profit margin, net interest rate of
the return on net assets and business, this paper
selects indicators in 2020.
4 THE RESEARCH PROCESS
4.1 Factor Analysis
4.1.1 KMO and Bartlett's Test
The closer KMO value is to 1, the stronger the
correlation between variables is, and the more
suitable the original variables are for factor analysis.
Bartlett is used to test whether the correlation matrix
is a unit matrix, that is, whether each variable is
independent. In factor analysis, if the null hypothesis
is rejected, factor analysis can be done; if the null
hypothesis is not rejected, it means that these
variables may provide some information
independently and are not suitable for factor analysis
(Wang 2018).
KMO and Bartlett sphericity tests were carried
out on the data, and the results were shown in Table
4.1. The KMO value was 0.681, over 0.5 and close to
0.7, and the P value was 0.000<0.05. It can be seen
that the original data is suitable for factor analysis.
Table 1: KMO and Bartlett's Test.
Kaiser-Meyer-Olkin Measure of Sampling
Ade
q
uac
y
.
0.681
Bartlett's Test of
Sphericity
Approx. Chi-Square 789.652
df 66
Sig. 0.000
4.1.2 Factor Out
As the selected indicators are different, the
measurement units and orders of magnitude of data
indicators are different, so the original data are
standardized first. SPSS software was used for factor
naming and rotation of standardized data, and the
total variance of interpretation was shown in Table2.
Four common factors are extracted from the ten
factors, and the contribution rates of the four principal
components are 28.185%, 19.117%, 10.023% and
9.322% respectively (as can be seen from the
percentage of variance). The cumulative variance
contribution rate of the four common factors is
66.647%, that is, the combined influence of all
common factors on the dependent variable is
66.647%. It can accurately describe the financial
quality of listed new energy companies.
Research on Financial Quality Evaluation of New Energy Listed Companies based on Factor Analysis and Cluster Analysis
987
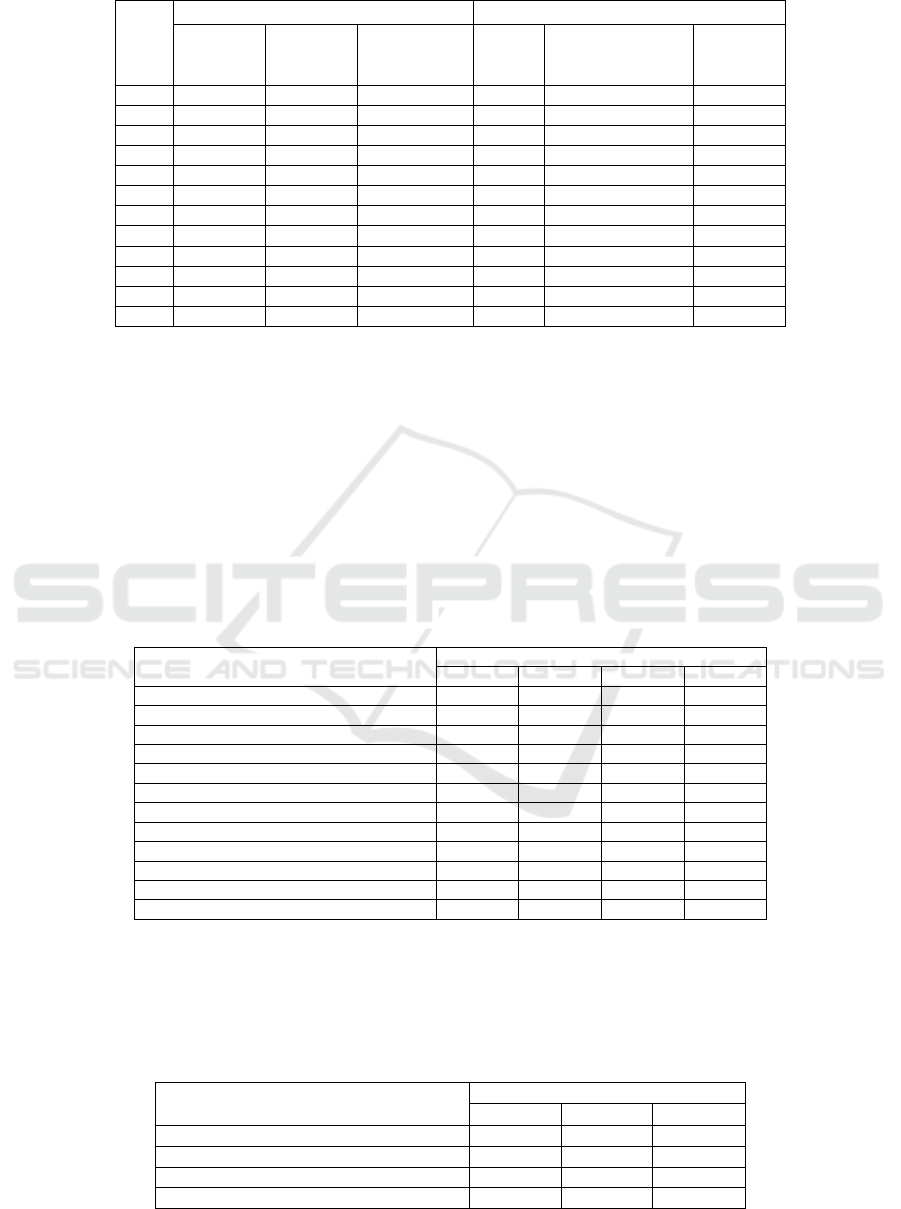
Table 2: Total Variance Explained
Compon
en
t
Initial Eigenvalues Sum of squares of rotational loads
Total
% of
Variance
Cumulative % Total
Sum of squares of
rotational loads
% of
Variance
1 3.633 30.275 30.275
3.382 28.185 28.185
2 2.083 17.358 47.633
2.294 19.117 47.302
3 1.189 9.911 57.544
1.203 10.023 57.326
4 1.092 9.103 66.647
1.119 9.322 66.647
5 0.958 7.981 74.628
6 0.876 7.304 81.932
7 0.846 7.047 88.979
8 0.558 4.653 93.632
9 0.389 3.239 96.870
10 0.217 1.807 98.677
11 0.140 1.164 99.841
12 0.019 0.159 100.000
4.1.3 Define Factor Variable
Since the typical representative variables of each
main factor in the unrotated load value are not very
prominent, in order to more accurately describe the
inherent economic significance of each factor and to
better describe the obtained factor with realistic
language, SPSS is used to rotate the factor load
matrix and the rotation component matrix is obtained
in Table3. It can be seen from the figure that net
interest rate on total assets, return on net assets and
net operating interest rate reflect the profitability of
the enterprise, while liquidity ratio, cash ratio and
asset-liability ratio reflect the solvency, receivables
turnover, inventory turnover and total assets turnover
reflect the operating capacity of the enterprise. The
growth rate of total assets, net profit and operating
income reflects the development ability of
enterprises. These four factors just confirm the four
representative indicators reflecting the financial
ability of enterprises.
Table 3: Rotated Component Matrix
Componen
t
1 2 3 4
Zscore (curren
t
ratio) -0.005 0.919 0.039 -0.115
Zscore (cash ratio ) 0.085 0.826 0.060 0.136
Zscore (lev) -0.183 -0.834 -0.034 -0.017
Zscore (growth rate of total assets) 0.449 -0.075 -0.012 -0.323
Zscore (net profi
t
growth rate) 0.727 0.118 -0.018 0.070
Zscore (growth rate of revenue) -0.037 -0.037 0.415 -0.521
Zscore (accoun
t
receivable turnove
r
) 0.025 -0.022 0.223 0.820
Zscore (inventory turnover) 0.057 0.006 -0.715 0.052
Zscore (total assets turnover) 0.114 0.134 0.670 0.168
Zscore(rate of return on total assets) 0.956 0.144 0.076 0.037
Zscore(return on equity) 0.958 0.075 0.075 0.030
Zscore(Ne
t
operating interes
t
rate) 0.873 0.069 -0.050 0.006
4.1.4 Calculated Factor Score
Variables are coded for the factors, and expressions
between 12 indicators and 4 factors are constructed.
F
1
is defined as profitability factor, F
2
as debt paying
ability factor, F
3
as operating ability factor and F
4
as
development ability factor. The scoring coefficient
matrix based on factor analysis is shown in Table 4.
Table 4: Component Score Coefficient Matrix
Componen
t
1 2 3
Zscore(current ratio)
-0.068 0.424 -0.022
Zscore(cash ratio )
-0.036 0.366 -0.009
Zscore(lev)
0.005 -0.368 0.029
Zscore(growth rate of total assets)
0.147 -0.057 -0.003
BDEDM 2022 - The International Conference on Big Data Economy and Digital Management
988

Zscore(net profit growth rate)
0.215 0.001 -0.039
Zscore(growth rate of revenue)
-0.012 -0.026 0.372
Zscore(account receivable turnover)
-0.001 -0.050 0.161
Zscore(inventory turnover)
0.030 0.043 -0.607
Zscore(total assets turnover)
0.011 0.006 0.550
Zscore(rate of return on total assets)
0.283 -0.010 0.036
Zscore(return on equity)
Zscore(Ne
t
operating interes
t
rate)
0.288
0.265
-0.041
-0.029
0.040
-0.063
According to the component scoring coefficient
matrix in Table 4, the factor scoring function can be
obtained as follows:
F
1
=-0.068X
1
-
0.036X
2
+0.005X
3
+0.147X
4
+0.215X
5
-0.012X
6
-
0.001X
7
+0.030X
8
+0.011X
9
+0.283X
10
+0.288X
11
+0.2
65X
12
F
2
=0.424X
1
+0.366X
2
-0.368X
3
-
0.057X
4
+0.001X
5
-0.026X
6
-
0.050X
7
+0.043X
8
+0.006X
9
-0.010X
10
-0.041X
11
-
0.029X
12
F
3
=-0.022X
1
-0.009X
2
+0.029X
3
-0.003X
4
-
0.039X
5
+0.372X
6
+0.161X
7
-
0.607X
8
+0.550X
9
+0.036X
10
+0.040X
11
-0.063X
12
F
4
=-0.131X
1
+0.096X
2
+0.011X
3
-
0.291X
4
+0.055X
5
-
0.481X
6
+0.729X
7
+0.071X
8
+0.123X
9
+0.019X
10
+0.0
14X
11
-0.002X
12
According to the calculation result of factor
analysis, to new energy of the listed company profit
ability factor, debt paying ability factor, development
capacity factor and operation ability factor score
values as independent variables, explanation as
dependent variable, namely to Y represent new
energy listed companies financial quality score, build
multivariate linear regression model (Shen 2012),
formula is:
Y=(0.30275F
1
+0.17358F
2
+0.09911F
3
+0.09103F
4
)/0.66647
4.1.5 Ranking
The score of factor analysis is summarized and the 118
enterprises are ranked according to the score. The
paper only lists the top six and the bottom three listed
new energy enterprises.
Table 5: New energy enterprise score and ranking
Company name F
1
F
2
F
3
F
4
Y Ranking
Star power -0.005 1.150 0.969 6.051 1.27 1
Yuxing real stake -0.222 4.240 -0.332 0.157 0.98 2
Suzhou solid
technetiu
m
-0.050 3.198 0.306 0.329 0.90 3
Wanli shares -0.526 4.279 0.222 -0.365 0.86 4
Donghua energy 0.255 -0.437 2.376 2.343 0.68 5
Aoke shares 0.180 0.371 1.733 1.394 0.63 6
…… …… …… …… …… …… ……
Jiaru co -0.775 -1.027 0.506 -0.353 -0.59 113
Eicon Tec -1.222 -0.613 -0.207 0.174 -0.72 114
Jia new can 0.5256 0.175 -7.478 0.397 -0.77 115
Million lida -2.795 -0.549 0.581 -0.696 -1.42 116
*ST Huayi -6.315 -0.505 -0.606 -0.179 -3.11 117
ST King Kong -7.347 -0.487 -0.560 -0.211 -3.58 118
Comprehensive analysis: In terms of
comprehensive scores, 64 companies, including Star
Power, Yuxing, Suzhou Guzuo, Wanli, Donghua
Energy and Oke, have positive comprehensive scores
and their financial quality is higher than the average
level. The remaining 54 companies scored negative,
with only one company with a score greater than 1,
and eight companies with a score greater than 0.5,
indicating that some enterprises in China's energy
industry have insufficient financial resources, and
there is a large difference among enterprises, with the
overall financial level being average. From the point
of view of individual enterprises, star power, Yuxing
shares and Suzhou Gootechnetium and other listed
companies total score is high, the financial level is
significant, while Yi Lida, *ST Huayi and ST King
Research on Financial Quality Evaluation of New Energy Listed Companies based on Factor Analysis and Cluster Analysis
989

Kong and other enterprises total score is significantly
lower than the average. Sort by composite scores, the
top five companies have good financial quality
because of their four or most common factor score in
a hierarchical levels, explain the company's financial
quality not only see one aspect, such as low solvency
is not a good use of financial leverage a performance,
and to see whether the comprehensive factors.
4.2 Cluster Analysis and Results
Table 6: Cluster analysis.
category company name
1(34)
Star Power, Yuxing Co., LTD., Suzhou Gootechnetium Co., LTD., Wanli Co., LTD., Donghua
Energy Co., LTD., Oke Co., LTD., Chuantou Energy, Chengfei Integration, Zhongtian Technology,
Yicheng Xinneng, Yingluohua, Kuanda Technology, Dangsheng Technology, Shengyang Shares,
Cairn Co., LTD., Kesida Co., LTD., Longji Co., LTD., Beiba Media Co., LTD., Yunnan Energy
Investment Co., LTD., Hengdian Dongci Co., LTD., Shougang Co., LTD., Igor, Longma Sanitation,
Bowei Alloy, Camel Stock, Kaier New Material, Sheneng Stock, China Power, Daming city, New
Zhou Bang, Yutong Bus, Baoxin Energy, Yiwei Lithium energy, Leading Intelligence
2(82)
Linyang Energy, Fosu Technology, Aerospace Rainbow, Dongcai Technology, Jiangsu Xineng,
Jingsheng Electromechanical, Nanbo A, Zhuhai Port, Shenseg, Disen Shares, Putai Lai, Ganfeng
Lithium, North International, Longstar Chemical, Hengtong Optoelectronics, Daijin Heavy Industry,
Shangwei Shares, China Power Xingfa, Xinwangda, Jiangnan Chemical, Taisheng Wind Energy,
Naura Chuang, Changjiang Power, Woer Nuclear Materials, Ganeng Shares, Chengzhi Shares,
Zhonglai shares, Yinghe Technology, Nandu Power Supply, Fengyuan shares, Sunshine Power
Supply, Tianshun Wind Energy, Jixin Technology, Sinomaterial Technology, Dunan environment,
Dongfang Electric, Dongfang Risheng, Huawu Shares, Tianeng Heavy Industry, Gaolan Shares,
Shanshan Shares, Yonker Environmental Protection, Shao Shares, dongshan precision, hubei energy,
environmental protection, division of manufacturing, in the group, since the ranks, crystal
photoelectric, investment power, byd, large groups, core technology, vibration, jiang in electric,
electric, gansu hin tech center, its the big, huadian power international, Beijing can power, turbine in
China, the amalekites, Beijing express, Shenzhen Energy, Yueng Holding, Guodian Electric Power,
Tuori Xineng, Teride, Huaneng International, Ediqi Environment, Datang Power Generation,
Baochange Electric, Shanghai Electric Power, Duofudo, Huayin Power, JDIAN Shares, King Kong
Glass, Jia Yu Shares, Ikang Technology, Jia Ze Xineng, Yi Lida
3(2) *ST Huayi, ST King Kong
In this paper, k-means clustering method is adopted
to classify listed companies in the new energy
industry based on financial quality (Zhao 2019),
namely score Y, on the basis of factor analysis and
factor and comprehensive score, in order to identify
problems and draw conclusions more easily. The
results are shown in Table6.
The first Gradient company has the best business
performance, with 34 companies, accounting for
nearly one-third, indicating that there are many high-
quality companies in China's energy industry, and
such companies have strong strength, and investors
can get better returns if they invest in such companies.
The second gradient company has the middle and
lower business performance level, accounting for
nearly three-quarters of the total sample. This kind of
company is characterized by the overall performance
is generally lower, has its own advantages, but also
has certain problems, investors should hold a wait-
and-see attitude to this kind of company. There are
only two third gradient companies, poor business
performance, factor score and comprehensive score
are unsatisfactory, for *ST Huayi and ST King Kong
managers, want to reverse the situation is very high
pressure.
5 CONCLUSIONS
The new energy industry is in the stage of rapid
growth, with the support of national policies, is an
important part of the national strategy, and attracts the
attention of a large number of investors. New energy
listed companies are the "leader" of the new energy
industry, so the conclusion based on new energy listed
companies is more typical for the new energy
industry. The main research and innovation of this
paper are as follows:
With the method of factor analysis and cluster
analysis of 118 new energy to evaluate the financial
quality of listed companies and the company is
BDEDM 2022 - The International Conference on Big Data Economy and Digital Management
990

divided into three categories, the profitability as the
main factor is obtained and the quality of new energy
industry as a whole financial general conclusions, on
the basis of other scholars to further verify the
effectiveness of the factor analysis and
cluster analysis.
In view of the large gap between enterprises, the
lack of financial capacity of some enterprises and the
weakness of some enterprises in a certain aspect, the
government should allocate support resources
reasonably and effectively according to the r&d and
innovation capacity of enterprises in the new energy
industry. For enterprise managers, we should find out
the company's competitive advantages and
disadvantages, always seek innovation and upgrading,
encourage all staff to participate in enterprise cost
management.
REFERENCES
Hornungová, Jana, Milichovský, František. Financial
Performance Evaluation of the Czech Agricultural
Companies with Factor Analysis[J]. Scientific Papers
of the University of Pardubice, Series D, 2016, 23(37).
Hu Peng, Bai Bai, Wang Zhilin. Research on the
application of ahp-dea method in hospital financial risk
evaluation [J]. China health economics, 2018,37 (12):
104-107.
Li Xiaoyan. Performance evaluation analysis of listed
commercial banks based on entropy method [J].
Finance and Accounting Communications, 2014(17):
21-22.
Liang Mengxue. Comprehensive financial evaluation of
listed biomedical companies based on factor analysis
[J]. Hebei Enterprises, 2017(08):52-53.
Ma Shuzhong, Chen Li, ZHANG Hongsheng. International
business research, 2018, 39 (02):48-66.
Santosh Kumar Yadav and M. Dharani. Prioritising of
Banking Firms in India Using Entropy-TOPSIS
Method [J]. International Journal of Business
Innovation and Research, 2019, 20(4)
Shen Youdi, Shen Wang. Technology economics, 2012,
31 (7):66-72.]
Wang Haixia, Guo Jiaxi. Performance evaluation of listed
companies in Xinjiang Production and Construction
Corps based on DEA Model and Malmquist Index [J].
Finance and Accounting Communications, 2016 (29):
38-42.
Wang Jianhua, LI Ruting. New energy listed companies
performance evaluation system construction and
application [J]. Friends of Accounting, 2018(08).
Wang Lei, LIU Huiping. Performance evaluation of
Chinese agricultural listed companies based on factor
analysis [J]. Economic Research Reference, 2016(56).
Yulin GE,Jing YE. Empirical Analysis of Financial
Performance of Listed Company in Retail Based on
Factor Analysis Method [J]. International Business and
Management, 2018, 16(1).
Zhang Xinmin, Wang Xiuli. The quality characteristics of
enterprise financial Position [J]. Accounting Research,
2003 (09): 35-38.
Zhao Teng, Yang Shizhong. Application of Entropy weight
TOPSIS method in enterprise financial risk evaluation:
A Case study of Jiujiu Liquor Company [J]. Finance
and Accounting Monthly, 2019(3):9-16.
Zhao Xiangzhong, ZHANG Ying. Comprehensive
evaluation of financial risk of Listed companies in
Guangxi based on factor Analysis [J]. Finance and
Accounting Communications, 2016(14): 32-35.
Research on Financial Quality Evaluation of New Energy Listed Companies based on Factor Analysis and Cluster Analysis
991
