
Influencing Factors of Housing Price in New York-analysis: Based on
Excel Multi-regression Model
Yuqi Yan
New York University, New York, NY, 10012, U.S.A.
Keywords: Housing Price, GDP, Recession, Housing Bubble, Home Ownership Rate, Urban Economy.
Abstract: Since the beginning of 21th century, the real estate market in New York has experienced rapid growth and
the current housing price index is more than doubled from 2000. To figure out what can be related to the boom
of the real estate market, this paper investigates the factors that influence the housing price index in New
York. Specifically, the investigation focuses on data of recent 20 years (collected from ECONOMIC
RESEARCH of FRED), using EXCEL to construct a linear regression model to find the correlation between
the housing price index and four potential main factors-resident population, per capita personal income, GDP
and home ownership rate. Also, the significance of each factor in the linear regression model is also considered
and the improved model is based on eliminating non-significant factors. The result shows the housing price
index has a strong correlation with GDP and home ownership rate. For this result, a further analysis based on
macroeconomics cycle and housing bubble indicates that the housing price in New York may not correspond
to the GDP growth in recession or recovery period. For home ownership rate, it can affect the housing price
independently, but it is a significant factor that influences the rate of change in housing price.
1 INTRODUCTION
Real estate economy refers to the economic
relationship between people around the production,
distribution, exchange and consumption of real
estate, which is the organic combination of real estate
economic relationship and real estate productivity
(Ahmad, 2021, Taha, 2021, Endut, 2021, Baatwah,
2021). The real estate economy is a key part of the
city economy, and the economic development of New
York state is inseparable from the contribution of the
real estate industry. The good development of real
estate can accelerate the development of the city and
optimize the structure of urban economic
development. In addition, as a necessity of life, a
house also profoundly affects people's life quality
level and satisfaction. There are many factors that
affect home prices in New York State, and the extent
to which these factors affect home prices varies. By
analyzing and comparing the influence of these
variables on the housing price in New York state, we
can not only predict the future trend of housing price,
but also control the housing price by controlling these
factors, so as to prevent its soaring price from
disturbing the market order.
New York state is the nerve center and economic
heart of the United States. It is of great significance
to study the real estate economy of New York State
for better developing the economy of New York state
and improving the living quality of residents. This
report plans to take the House Price Index for New
York as the dependent variable, and select the
Resident Population, per capita personal income,
gross domestic product in New York, and home
ownership rate as independent variables to conduct
multiple linear regression. The purpose of this report
is to find out the important factors influencing the real
estate economy in New York State and analyze their
influence.
2 VARIABLES DESCRIPTION
AND DATA SELECTION
This report plans to take the House Price Index for
New York as the dependent variable, and select the
Resident Population, per capita personal income,
gross domestic product in New York, and home
ownership rate as independent variables.
Yan, Y.
Influencing Factors of Housing Price in New York-analysis: Based on Excel Multi-regression Model.
DOI: 10.5220/0011362000003440
In Proceedings of the International Conference on Big Data Economy and Digital Management (BDEDM 2022), pages 1005-1009
ISBN: 978-989-758-593-7
Copyright
c
2022 by SCITEPRESS – Science and Technology Publications, Lda. All rights reserved
1005

2.1 Dependent Variable
House Price Index for New York: The House Price
Index for New York is the best indicator of home
prices in New York State as a whole (Ma, 2021, Liu,
2021, Sing, 2021). Housing price index selected for
this report is all annual data (mathematically
processed from quarterly data), and 1980Q1 is taken
as the base period for research. The variable is
represented by HPI.
2.2 Independent Variable
Resident population: Resident population is the most
important factor affecting the real estate economy.
Generally speaking, it can be considered that the
more permanent population, the higher the demand
for housing, the market will be in short supply,
housing price index will rise. The unit of permanent
population variable is thousand people, and the data
type is annual data. The variable is represented by RP.
Per capita personal income: Per capita personal
income refers to the income that can be completely
used for daily life control, which indirectly reflects
the concern of home buyers on the housing price. It is
generally believed that per capita personal income is
positively correlated with housing price index. The
unit of per capita disposable income is the dollar, and
the data type is annual data. This variable is
represented by PCPI.
Gross Domestic Product in New York: Gross
Domestic Product is a macro reflection of a region's
economic development level. When a region's
economic development is better, people's income
level will continue to increase, indirectly reflecting
the improvement of the ability to buy a house. The
unit of Gross Domestic Product is millions of dollars,
and the data type is annual data. This variable is
represented by GDP.
Homeownership rate: home ownership rate is a
commonly used index to examine the living
conditions of residents in the world. It refers to the
number of households living in their owner-occupied
housing as a proportion of the total number of social
housing households (Margo, 1996). The residential
ownership rate is reflected in the form of a
percentage, and the data type selected is annual data.
This variable is represented by HWR.
2.3 Data Selection
This report selects the annual data of various
variables in New York State from 2000 to 2020 as
data, with a total of 105 data values, and all data are
not seasonally adjusted. Data source of ECONOMIC
RESEARCH (Valadez, 2011).
Year
NYSTHPI
(1980:Q
1=100)
NYPOP
(Reside
nt
Populatio
n,Thousa
nds of
Persons
)
NYPCPI
(Per
Capita
Personal
Income
in New
York,doll
ar)
NYNGSP
(Gross
Domestic
Product,
Millions
of
Dollars)
NYHOW
N
(Home
ownershi
p Rate
for New
York,%)
2000 349.7 19001.78 36090 841181.3 53.4
2001 382.56 19082.84 37283 878346.5 53.9
2002 422.86 19137.8 37088 890258.1 54.8
2003 466.38 19175.94 37576 912474.6 54.3
2004 526.39 19171.57 39329 967151.9 54.8
2005 594.68 19132.61 40884 1016038 55.9
2006 633.38 19104.63 44128 1075155 55.7
2007 637.05 19132.34 47428 1119382 55.9
2008 618.18 19212.44 48184 1116591 55
2009 591.69 19307.07 47027 1160081 54.4
2010 574.95 19399.96 48818 1223530 54.5
2011 563.01 19499.92 51167 1247606 53.6
2012 555.89 19574.36 53599 1328234 53.6
2013 559.92 19626.49 54117 1365529 53
2014 571.07 19653.43 56270 1430923 52.9
2015 591.07 19657.32 58743 1487628 51.5
2016 611.52 19636.39 60833 1551354 51.5
2017 640.08 19593.85 64964 1603903 51.1
2018 672.59 19544.1 67357 1694958 51
2019 701.64 19463.13 69951 1777752 52
2020 736.75 19336.78 74472 1724759 53.6
Figure 1: The Data of NY Housings Price Index, Resident Population, Per Capita Personal Income, GDP and Homeownership
rate from 2000-2020.
BDEDM 2022 - The International Conference on Big Data Economy and Digital Management
1006
3 EMPIRICAL METHODS
This report uses multiple linear regression to conduct
regression analysis on the influencing factors of real
estate price in New York state, and the main formula
is shown in Equation (1).
HPI = β
+β
RP + β
PCPI + β
GDP + β
HWR + ε (1)
Where, β
,β
,β
,β
are the regression
coefficients, β
is a constant term, ε is the random
error term. To eliminate possible multicollinearity,
the logarithm of all data is taken to eliminate
multicollinearity. The formula after treatment is
shown in Equation (2)
lnHPI = β
+β
lnRP + β
lnPCPI + β
lnGDP +
β
lnHWR + ε (2)
4 EMPIRICAL RESULTS AND
ANALYSIS
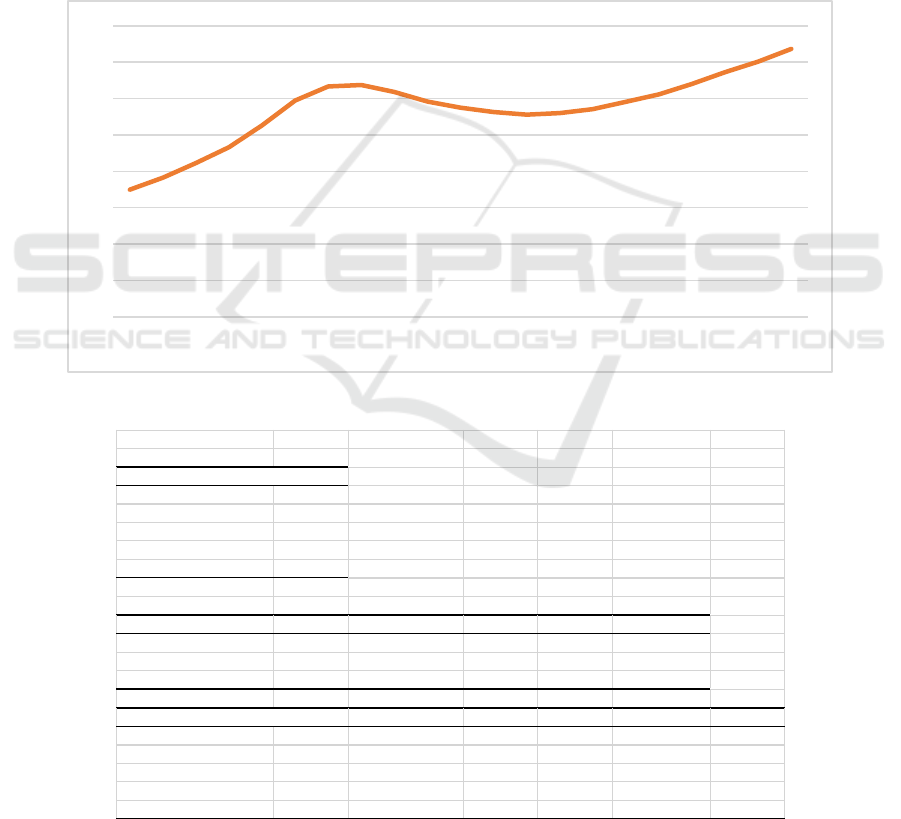
Figure 1 shows the trend of the housing price index
over the past 21 years. It can be seen that the overall
housing price index has an upward trend, although
there has been a slight decline in the intervening
years. The data analysis function in Excel is used to
fit the multiple linear regression equation, and the
fitting results are shown in Equation (3).
lnHPI = 16.053 + 4.683lnRP + 0.967lnPCPI +
2.097lnGDP + 4.414lnHWR (3)
Figure 2: The trend of the house price index over the past 20 years in New York.
SUMMARY OUTPUT
Regression Statistics
Multiple R 0.950938
R Square 0.904283
Adjusted R Square 0.880353
Standard Error 0.065641
Observation 21
ANOVA
df SS MS F Significance F
Regression 4 0.651304759 0.162826 37.78969 5.8016E-08
Residual 16 0.068939943 0.004309
Total 20 0.720244702
Coefficient
s
Standard Error t Stat P-value Lower 95% Upper 95%
Intercept 16.05312 29.6190269 0.541987 0.595296 -46.73641 78.84265
X Variable 1 -4.68314 3.074900623 -1.52302 0.147272 -11.201642 1.835354
X Variable 2 -0.96747 0.684125639 -1.41417 0.176477 -2.4177485 0.482815
X Variable 3 2.096999 0.716019445 2.928691 0.009837 0.57910594 3.614893
X Variable 4 4.414207 0.804317998 5.488137 4.96E-05 2.70912926 6.119285
Figure 3: Excel regression results.
0
100
200
300
400
500
600
700
800
2000
2001
2002
2003
2004
2005
2006
2007
2008
2009
2010
2011
2012
2013
2014
2015
2016
2017
2018
2019
2020
Influencing Factors of Housing Price in New York-analysis: Based on Excel Multi-regression Model
1007

According to Excel regression results, the
determination coefficient is 0.951, indicating that the
model has a good fitting effect, and the F value is
37.790. The model as a whole passes the significance
test. As can be seen from the results, the coefficient
of the resident population is 4.683, which means that
the housing price index increases by 4.683% when
the resident population increases by 1%. The
coefficient of per capita personal income is 0.967,
which means that the house price index increases
0.967% for every 1% increase in per capita personal
income. The coefficient of Gross Domestic Product
is 2.097, which means that for every 1% increase in
Gross Domestic Product, the house price index
increases by 2.097%. The coefficient of the home
ownership rate is 4.414, meaning that with every 1%
increase in the homeownership rate, the house price
index increases by 4.41 %. Furthermore, according to
the result, if the significant level is set as α=0.05,the
p-value for x variable 1(resident population) and x
variable 2(per capita personal income) are much
greater than the significance level. Therefore, these
two values can be considered as not significant in this
multiple linear regression model. If they are
eliminated, the new regression equation is shown in
Equation (4)
lnHPI = −27.184 + 1.038lnGDP +
4.764lnHWR (4)
SUMMARY OUTPUT
Regression Statistics
Multiple R 0.94232648
R Square 0.887979194
Ad
j
usted R S
qu
0.875532438
Standard Error 0.066950393
Observations 21
ANOVA
df SS MS F Significance F
Regression 2 0.63956231 0.319781 71.34222 2.77772E-09
Residual 18 0.080682392 0.004482
Total 20 0.720244702
Coefficients Standard Error t Stat P-value Lower 95% Upper 95%
Intercept -27.1842815 3.92342295 -6.92872 1.78E-06 -35.42708725 -18.9415
X Variable 1 1.037680143 0.08895842 11.66478 7.95E-10 0.850785438 1.224575
X Variable 2 4.764216468 0.738255601 6.453343 4.51E-06 3.213199004 6.315234
Figure 4: Improved regression results.
After improving the model by eliminating
resident population and per capita personal income,
the R value and R Square still remain the same which
indicates a strong relationship. For F-value, it
improved from 37.790 to 71.342. For both variables,
Gross Domestic Product and house owner rate, shows
very low p-value which means a high significance.
The coefficient of Gross Domestic Product is 1.038
saying that if the increase ratio of GDP is 1%, the
housing price index may increase 1.038%. The
coefficient of house ownership rate is 4.762
suggesting that 1% increase in house owner rate
would indicate the house price index is increased by
4.762%.
5 DISCUSSION
The regression model tells us the house prices in New
York largely depends on
Gross Domestic Product and home ownership
rate. Based on the model, we may approximately
approach the truth of what can predict the housing
price. But what larger stories does the truth tell us?
The reason why these two factors make an effect on
the housing price may be the pivot to figure out the
development of the New York real estate market in
recent 20 years. Gross Domestic Production evaluate
the total good and services in a region. From another
perspective, it shows the consumptions, investments,
government income and net import- a higher GDP
means more flourishing economic activity. Housing
price reflects the demand for houses to some extent.
People prefer to invest in houses in a city with a high
GDP where they can obtain genuine incomes or the
housing price itself potentially would increase which
leads to wealth appreciation. However, because a
strict causation relationship cannot be proven, it is
difficult to assert that GDP is a factor that causes
rising housing prices. In Ray M. Valadez’s research,
he indicates that “ The causes underlying the
relationship between the HPI and GDP may be
indirect or overlap in such a way as to provide pairing
or interdependence.” (Valadez, 2011) Although the
BDEDM 2022 - The International Conference on Big Data Economy and Digital Management
1008

regression model presents a strong correlation
between GDP and housing price, the data shows an
anomaly between the period from 2009 to 2012: GDP
recovered but housing prices continuously fall. To
explain this abnormality, the bubble of the US real
estate market since the beginning of 21th century and
the recession in 2008. In the article “The Great
American Housing Bubble: Re-Examining Cause and
Effect”, the author Robert Hardaway concludes that
“over-extended homeowners, greedy Wall Street
financiers and investment bankers, compromised
realtors, accountants, credit rating agencies, and
ineffective and inattentive regulators have all played”
in the housing bubble (Hardaway, 2009). In 2007, the
subprime mortgage industry collapsed and “At least
25 subprime lenders, which issue mortgages to
borrowers with poor credit histories, have exited the
business, declared bankruptcy, announced significant
losses, or put themselves up for sale.”(Hovanesian,
2007). After the burst of the housing bubble, the
Great Recession began. Based on the data, the GDP
obviously recovered in 2009, but the negative effect
of Great Recession on the real estate market still
existed. It is can be considered as a housing price
correction which means the price gradually and
eventually reaches the normal level. When the
housing price reached a comparatively low level, it
raised again accompanied by booming GDP.
Analyzing the recession effect on housing price, we
may primarily conclude that housing price has a
strong correlation with GDP, but when a housing
bubble exists and bursts, the price may not follow
with GDP since the moderation and recovering can
happen at the same time.
Nonetheless, the rate of home ownership cannot
predict the trend of housing prices on its own.
According to the linear regression model for only
house ownership and housing price index, the R-
value is only 0.202 and the p-value is 0.378 which is
not significant. A potential reason behind this is
house ownership rate does not directly reflect the
actual demand and supply on real estate market.
However, the multi regression model shows that
despite in the housing price correction period, when
the GDP increase, a higher house ownership rate
would lead to a more intensive increase, and a lower
house ownership rate may indicate a week increase in
housing price.
6 CONCLUSIONS
In the first regression model, we can see that the
resident population is the most important factor
affecting the housing price index, followed by the
residential ownership rate, followed by Gross
Domestic Product, and finally the per capita
disposable income. Due to the significance test,
resident population and per capita personal income
show low significance. After modifications, the
improved model of how the housing price index
relates to GDP and homeownership rate demonstrates
a strong and significant correlation. Based on the
model, we can conclude that at the situation of
economic growth (booming GDP) and high house
ownership rate (comparatively more residents own a
house), the housing price would continuously
increase. However, during recession and following
recovery period, the housing price would meet a large
correction to a balanced level even though GDP
increase. Moreover, although this model may help to
predict future housing price in New York or other
states with a metropolitan, its own limitations should
be considered. For example, the data is only based on
recent 20 years, which is a short time interval. Also,
the recession period from 2007 to 2009 may affect the
preciseness of the model, since recession is not a high
probability event and the whole economic situations
are different between recessions. More independent
variables, such as interest rate, housing tax, and
unemployment rate, should be added in future
research to build a model that is more likely to reveal
the truth.
REFERENCES
Ahmad, N., Taha, R., Endut, W. A., & Baatwah, S. R. A.
(2021). The effects of house price and taxation on
consumers’ burden: The case of Malaysia. Kasetsart
Journal of Social Sciences, 42(2), 281-286.
Ma, L., Liu, H., & Sing, M. (2021). Responsiveness of
residential construction-production progress to house
price dynamics. International Journal of Housing
Markets and Analysis.
Margo, R. A. (1996). The rental price of housing in New
York City, 1830–1860. The Journal of Economic
History, 56(3), 605-625.
Valadez, R. M. (2011). The housing bubble and the GDP:
A correlation perspective. Journal of Case Research in
Business and Economics, 3, 1.
Hardaway, R. (2009). "The Great American Housing
Bubble: Re-Examining Cause and Effect." University
of Dayton Law Review 35(1): 33-60.
Hovanesian, M. D. (2007). "The Mortgage Mess Spread."
from https://www.bloomberg.com/news/articles/2007-
03-07/the-mortgage-mess-spreadsbusinesswMeek-
business-news-stock-market-and-financial-advice.
Influencing Factors of Housing Price in New York-analysis: Based on Excel Multi-regression Model
1009
