
Automata-based Explainable Representation
for a Complex System of Multivariate Times Series
Ikram Chraibi Kaadoud
a
, Lina Fahed
b
, Tian Tian
c
, Yannis Haralambous
d
and Philippe Lenca
e
IMT Atlantique, Lab-STICC, UMR CNRS 6285, F-29238 Brest, France
Keywords:
Multivariate Time Series, Representation, Explainability, Finite-state Automata, Complex System.
Abstract:
Complex systems represented by multivariate time series are ubiquitous in many applications, especially in
industry. Understanding a complex system, its states and their evolution over time is a challenging task. This
is due to the permanent change of contextual events internal and external to the system. We are interested in
representing the evolution of a complex system in an intelligible and explainable way based on knowledge
extraction. We propose XR-CSB (eXplainable Representation of Complex System Behavior) based on three
steps: (i) a time series vertical clustering to detect system states, (ii) an explainable visual representation using
unfolded finite-state automata and (iii) an explainable pre-modeling based on an enrichment via exploratory
metrics. Four representations adapted to the expertise level of domain experts for acceptability issues are
proposed. Experiments show that XR-CSB is scalable. Qualitative evaluation by experts of different expertise
levels shows that XR-CSB meets their expectations in terms of explainability, intelligibility and acceptability.
1 INTRODUCTION
A complex system is described by a set of a
large number of entities, i.e., variables, interacting
over time, which integration achieves a common
goal (Harel, 1987). It is thus used in many sectors
such as energy, medicine, urban traffic, etc. (Carlos-
Sandberg and Clack, 2021). A complex system is
characterized by its structure, i.e., the nature of its
variables, their interactions, or by their non-trivial
collective behaviors (multistationarity, chaos, bifurca-
tions, self-organization, emergence, feedback loops,
etc.) (Guespin-Michel, 2016). Although there is no
consensus on its definition, a complex system can
be represented by multivariate time series, where
each series represents a variable of the system (Has-
sanibesheli et al., 2020). Very often, in complex sys-
tems we can describe the values of time series by re-
ferring to states, which correspond to intervals of val-
ues. Thus, to understand the system is to understand
the semantics and the interaction of these states.
Explaining the behavior of a complex system is
a
https://orcid.org/0000-0001-8393-1262
b
https://orcid.org/0000-0002-7207-0580
c
https://orcid.org/0000-0003-0303-0873
d
https://orcid.org/0000-0003-1443-6115
e
https://orcid.org/0000-0001-5014-2347
a challenging task. Actually, domain experts can
understand a complex system thought the acquisi-
tion of “implicit knowledge,” i.e., working habits, ex-
pertise, their interaction with the system and their
growing experience, that is still difficult to verbalize.
The expert’s implicit knowledge is important for the
cognitive process of inference of non-conscious op-
erating rules. However, extracting and formalizing
such knowledge is a complex task, requiring a deep
analysis of the system and thorough interaction with
it (Chraibi Kaadoud et al., 2022).
Data visualization techniques have been proposed
in order to monitor the behavior of a complex sys-
tem (Harel, 1987; Theissler, 2013; Pham et al., 2019),
such as parallel coordinates techniques, scatter plot
matrices, etc. However, for an even more complex
system, in which the states, the internal (i.e., techni-
cians’ interventions) and external context (i.e., regu-
lation), are themselves changing, it is difficult to de-
termine the relevant characteristics that contribute to
a change of state. Existing techniques do not allow to
visualize these changes in an intelligible way to a hu-
man expert. We thus address the following challenge:
how to understand the states of the complex system’s
multivariate time series? How to detect and under-
stand the evolution of the system’s states over time?
How to represent this evolution in an intelligible and
explainable way?
170
Chraibi Kaadoud, I., Fahed, L., Tian, T., Haralambous, Y. and Lenca, P.
Automata-based Explainable Representation for a Complex System of Multivariate Times Series.
DOI: 10.5220/0011363400003335
In Proceedings of the 14th International Joint Conference on Knowledge Discovery, Knowledge Engineering and Knowledge Management (IC3K 2022) - Volume 1: KDIR, pages 170-179
ISBN: 978-989-758-614-9; ISSN: 2184-3228
Copyright
c
2022 by SCITEPRESS – Science and Technology Publications, Lda. All rights reserved

Explainability and intelligibility in AI are an
important aspect in crafting acceptable AI sys-
tems (Weld and Bansal, 2019), and have been ac-
knowledged as much more important than sheer per-
formance in AI systems (Gunning, 2019; Barredo Ar-
rieta et al., 2020). Several reasons can be given: facil-
itating user control and acceptance, improving human
insight, as well as legal issues
1
. One of the challenges
of designing intelligible and eXplainable AI (XAI) is
communicating a complex computational process to a
human which requires interdisciplinary skills (Lenca,
2002; Le Saux et al., 2002).
Complex systems in form of multivariate time se-
ries can be represented as a finite-state automaton
(FSA), which is considered as a low-dimensional rep-
resentation i.e., that results from a dimensional data
reduction process that contains as much information
as possible as the original data. Recently, automata-
based approaches have been proposed that involve
discretization of the time series (Zhang et al., 2017;
Soto et al., 2021). These techniques reduce the al-
gorithmic complexity and offer a high level of ex-
plainability. We thus draw inspiration from these ap-
proaches to propose a representation that explains the
system’s behavior, commonly called an explainable
representation. Such a representation captures the
states of all or part of a complex system (from now
on, by “system” we will mean “complex system”).
Our main hypotheses are the following: (i) The
values of the time series at a timestamp t represent
the state of the system at t. Their analysis allows to
detect states, and in particular “rare” states. (ii) The
states of the system can be characterized by differ-
ent exploratory metrics related to the evolution of the
time series. (iii) The states of the system, as well as
their exploratory metrics can be considered as being
parts of a FSA, for which there are efficient visual rep-
resentations. (iv) The FSA is a synthetic, intelligible
and comprehensible representation of the behavior of
a system over time and therefore a decision making
aid. (v) The level of expertise in an application do-
main has an impact on the acceptability and the per-
ception of explainable representations.
Basing on these hypotheses, we propose an EX-
plainable Representation of Complex System Behav-
ior (XR-CSB) method using FSA for multivariate
times series, with three main originalities:
• Knowledge Extraction: XR-CSB uses a clustering
based approach that we call vertical clustering of time
series in order to detect states of the system. This
approach is original as it is independent of the size
1
The European Union’s General Data Protection Regu-
lation (GDPR) legislation acknowledges the citizens’ right
to explanation—other nations may follow this initiative.
of time series and can be applied to uni- or to multi-
variate series, contrary to traditional clustering. This
leads to complexity control.
• Explainable Knowledge Representation: XR-
CSB uses FSA to represent system’s behavior. Au-
tomata provide a visual explanation likely to be in-
telligible for human experts. The acceptability of
this representation is evaluated via qualitative experi-
ments.
• Pre-modeling Explainability: XR-CSB uses ex-
ploratory metrics to enrich automata like in pre-
modeling explainability domain-specific explainable
feature-engineering (Moshkovitz et al., 2020).
The paper is organized as follows. Section 2
presents related works about XAI and representation
of complex systems. Related definitions are presented
in Section 3 and the proposed method in Section 4.
Experimental results are presented in Section 5, and a
conclusion is given in Section 6.
2 RELATED WORKS
We here present some state-of-the-art works related
to the understanding and representation of a complex
system. Having labeled data is often very costly and
is simply not possible for several domains. This is the
case of our application. Thus, non-supervised meth-
ods must be applied (Braud et al., 2021).
• Clustering for Multivariate Time Series: Clus-
tering for multivariate time series have already been
proposed in order to analyze the behavior of time
series (Desmarais and Lemieux, 2013; Aghabozorgi
et al., 2015; Zhang et al., 2017). In such approaches,
time series are clustered, i.e., entire series are grouped
in clusters, according to the similarity of their same-
position values. These approaches require that the
whole series are available and have the same size for
proper functioning of the clustering and reliability of
results. They allow the detection of common behav-
ior between time series in order to automatically la-
bel the series thereafter, to detect frequent patterns,
etc. However, they do not allow representation of the
behavior across time series, i.e., the behavior charac-
terized by values from different time series at a given
time. Such approaches are thus not suitable for our
objective as they do not allow a discretization or a
simplification of the entire system.
• Explainable Artificial Intelligence (XAI): XAI has
become a very challenging domain
2
facing the high
2
Recall that models with explanation and transparency
goals have been proposed a long time ago (Shortliffe, 1974).
However, the term XAI has been introduced only recently.
Automata-based Explainable Representation for a Complex System of Multivariate Times Series
171

development of “black-box models” that are very effi-
cient in modeling systems (Guidotti et al., 2019). XAI
makes models more intelligible, transparent, and ac-
cessible or directly designs explainable ones (Guidotti
et al., 2019; Barredo Arrieta et al., 2020). XAI
can provide an explanation of the internal mecha-
nisms and the reasons behind the behavior of a sys-
tem. An explanation can be considered as an informa-
tion that is self-sufficient and addressed to the target
audience considering its knowledge and its expecta-
tions of the system’s behavior, and the context (van
Fraassen, 1988). An explanation is thus an interface
between the complex system to explain and the tar-
get audience, which are the domain experts in our
case (Gunning, 2019; Chraibi Kaadoud et al., 2021).
Note that a clear distinction has been made between
models that are transparent by design and those that
can be explained by means of external methods, i.e.,
post-hoc methods (Bennetot et al., 2021).
Recently, it has been proved that visual represen-
tations highly impact human trust. Moreover, vi-
sual representations combined with human knowl-
edge yield much better comprehension of a system
and thus lead to much better decisions (Yang et al.,
2020). Such studies confirm our choice of visual rep-
resentation of a system. However, most of recent
visualization techniques deal with black box visual-
ization through sensitivity analysis (Cortez and Em-
brechts, 2013; Weitz et al., 2021), and ignores aspects
related to the multidimensionality of data. It is impor-
tant to note that our objective is to exploit visualiza-
tion techniques as a way to represent the results of a
transparent model (clustering) on a system.
Our work is motivated by state-of-the-art
works (Higgs and Abbas, 2014; Zhang et al., 2017)
in which time series are segmented by means of
change point detection: simple clustering is applied
on explanatory variables and time windows. The
main disadvantage of such an approach is that it loses
sight of dynamic and time information and misses the
interaction and dependency between time series.
• Representation of Multivariate Time Series using
Automata: Using FSA for representing, monitoring,
estimating or even predicting the states of systems is
of great importance for interaction with the system
and for decision taking. Research works on FSA gen-
eration based on clustering have been proposed (Des-
marais and Lemieux, 2013; Higgs and Abbas, 2014;
Zhang et al., 2017). In such works, exploratory vari-
ables are extracted from each time series—they con-
stitute the states of the system and the succession of
these variables represents a sequence of states, a kind
of discretization of each time series. A clustering is
then performed to detect similar patterns (successions
of states) between the time series. This allows to ex-
tract a common behavior shared between the time se-
ries, but is not applicable in case of a very small num-
ber of series and, in any case, does not allow extrac-
tion of the global behavior of the system because it ig-
nores the interaction and the dependence (or not) be-
tween the time series. It is important to note that such
works are not adapted to complex systems as they do
not provide an intelligible simplification of the global
behavior of the system.
• Clustering and Automata Extraction during Dy-
namic Knowledge Construction of Neural Net-
works: We use the automata generation algorithm
proposed by (Chraibi Kaadoud et al., 2022) and
adapted from (Omlin and Giles, 1996). Note that
these algorithms have been used in the interpretability
field for the study of recurrent neural network latent
representations that are built in the multidimensional
space of the hidden layer. See (Chraibi Kaadoud et al.,
2021) for a set of definitions about the concepts of la-
tent representations and latent layers.
3 DEFINITIONS
This section is dedicated to the definition of sev-
eral concepts related to complex systems, multivari-
ate time series and automata. Several are inspired
from (Pham et al., 2019; Soto et al., 2021).
Definition 3.1. We denote a complex system as a set
of variables represented by multivariate time series.
A state, at timestamp t, is represented by the values at
t of the system’s variables (i.e., time series). A state
can last in time (making a cycle) and thus can be ob-
served within a time period, i.e., a window. We repre-
sent the evolution of states over time via finite-state
automata (FSA), the transitions of which represent
the evolution of the system. All states are final, since
we consider a continuous flow of states rather than
given finite-length words of a formal language. These
concepts are defined below illustrated in Figure 1.
Definition 3.2. A multivariate time series is an or-
dered sequence of m vectors: X = [X
1
. . . , X
m
] ∈
R
d×m
. For a timestamp t, X
t
= [x
t,1
, . . . .x
t,d
] is a d-
dimensional vector containing the values recorded at
t: t = 1, . . . , .m, i.e., the values of all time series at t.
The dimension d of the multivariate time series repre-
sents the number of series. A vector of d dimensions
recorded at t
0
is noted as X
t
0
,d
.
Definition 3.3. Given a multivariate time series X =
[X
1
, . . . , X
m
], a contiguous segment of X is called a
KDIR 2022 - 14th International Conference on Knowledge Discovery and Information Retrieval
172

Figure 1: A general scheme of our model XR-CSB: Multivariate time series, clustering and automata.
(sliding
3
) window and denoted by W . The length w
of W is less than or equal to the length of X: w ≤ |m|.
Definition 3.4. A finite-state automaton (FSA) A is a
tuple A = (S, T ) where S is a finite set of states and
T is a transition relation (a metric or a reason of this
transition). An automaton is represented as a directed
graph with states as nodes and transitions as edges.
Definition 3.5. We denote by S
(t
start
,t
end
)
the state of
the automaton A of the system represented by the mul-
tivariate time series X. A state starts at timestamp t
start
and ends at t
end
(t
start
and t
end
included).
Definition 3.6. In an automaton A, a path p of length
k is a sequence of states S
1
, ..., S
k
such that (S
i
,S
i+1
) ∈
T (the transition relation) for each 1 ≤ i < k. Note that
a path p is extracted from a window W . Note also
that no relation can be observed between k and w, e.g.
for a window of length w = 50, an automaton path of
length k = 2 can be obtained.
Definition 3.7. Explainable and Intelligible Repre-
sentation: Given a representation as the model out-
put. We say that this representation is intelligible ac-
cording to the degree that a human expert can predict
how a change to a feature, (e.g., an increase of the
value of a time series) will change the model’s output
(i.e., the system state). Note that if one can simu-
late the model, i.e., predicting its output such as the
next system’s state according to the general tendency
of time series, then one can predict the effect of a
change, but not vice versa. In our work, the degree
of explainability and intelligibility will be measured
via a qualitative questionnaire for human experts and
also via explicitly reported events.
3
A sliding window is the most common type of win-
dows.
4 XR-CSB METHOD
We present now the details of XR-CSB. Recall that
our work focuses on (i) studying the behavioral
changes of a system represented by multivariate time
series, (ii) detecting and understanding the evolution
of its states to other states, and (iii) representing its
evolution in an intelligible and explainable way.
To achieve these objectives, we propose XR-CSB,
a 3-step model that (i) performs a vertical cluster-
ing of multivariate time series related to the system,
(ii) generates an automaton representing the behavior
of this system over time, (iii) enriches the automa-
ton with explanatory metrics and semantic informa-
tion for explainability purposes. A general scheme is
presented in Figure 1. Next, we detail XR-CSB steps.
4.1 Step 1: Vertical Clustering
In order to perform what we call a vertical clustering
for time series, we use the k-means algorithm (Zeng
et al., 1993) but not in a traditional way. Our entry
point is the multivariate time series X represented by
a set of vectors X = [X
1
, . . . , X
m
] and a fixed tempo-
ral window W of length w (measured in minutes in
our application). We apply k-means in a way that it
partitions the first w vectors into k clusters. For ex-
ample, in Figure 1, when w = 3, we cluster the first
three vectors. Here, k-means minimizes the distance
between samples within each partition using the eu-
clidean distance. We thus obtain k clusters that group
vectors according to their values and independently of
the associated timestamp. The application of such a
vertical clustering allows to extract clusters that rep-
resent system’s states (see definition 3.5). These clus-
ters emerge from the values of the different time series
grouped together. Also, by conception, this vertical
clustering groups correlated time series in the same
Automata-based Explainable Representation for a Complex System of Multivariate Times Series
173

cluster, regardless of the distance measure.
By this step, each vector X
t
of the window W
belongs to a cluster C
i
which represents a state S
i
of the system. Our method can automatically fix
the optimal number of cluster k using the silhouette
score (Rousseeuw, 1987). However, for explainabil-
ity and acceptability issues, k is finally determined in
close coordination with domain experts.
Let us go back to the clustering and chosen dis-
tance. Clustering multivariate time series is a chal-
lenging task and is intrinsically associated to the no-
tion of distance. However, in order to define a dis-
tance between arbitrary multivariate time series, no
obvious or standard way exists in the state-of-the-
art (Ghassempour et al., 2014). For multivariate time
series containing only continuous variables, some
well-defined distances are usually employed, such as
Euclidean distance (Yang and Shahabi, 2004). Eu-
clidean distance has shown a high performance for
a high number of variables with complex correlation
structure (Giorgino, 2009). For these reasons, after
normalizing data (to have the same scale), we use Eu-
clidean distance for vertical clustering using k-means.
4.2 Step 2: Explainable Representation
via Automata
Automata Generation Process (figure 2.(a)): Given
the clusters extracted in step 1, we generate an au-
tomaton that represents the states of the system.
As each vector X
t
belongs now to a cluster C
i
,
we start generating the automaton by verifying, for
each vector X
t
, whether its associated cluster is al-
ready represented as a state in the automaton. If it
is not the case, a new node is added to the automaton.
Each state is numbered with the corresponding clus-
ter’s number. A direct edge is created with a weight
of 1 between the previous state and this new state.
In case the state already exists in the automaton, the
weight of the edge is incremented by 1, otherwise a
new edge with a weight of 1 is created. In the case
where two consecutive vectors X
t
and X
t+1
belong to
the same cluster, a loop (a cycle) is added to the state
representing the cluster. This process results in the
generation of an automaton with weighted transitions
explaining the configuration of the clusters (states).
Figure 2.(a) represents an example of the resulting au-
tomaton. The weight of the transitions is indicated by
a color, it represents how long the system stays in a
state: the darker it is, the more important is the weight
of the transition. This automaton generation process
is inspired from (Chraibi Kaadoud et al., 2022).
Path Generation Process: Unfolded Automaton
(figures 2.(b, d)): As represented in figures 2.(a),
such an automaton is not always intelligible nor ex-
plainable for domain experts. In order to make
this representation more explainable, we generate an
unfolded automaton, which is a temporal path that
moves along states of the system (i.e. a word in the
formal language of the system’s behavior). We pro-
pose two visual representations of such a path and of
the evolution of the states over time (Figures 2.(b) and
(d)): Figure 2.(b) represents the duration of each state
via numerical information (time in minutes and date
UTC and UTC+2 explained). To keep track of sim-
ilar states at different timestamps, the state number
is explicitly displayed inside each state symbol. Fig-
ure 2.(d) represents each state by a rectangle, and the
state’s duration is proportional to the rectangle’s size.
The longer the system remains in a state, the larger is
the associated rectangle. Same states have the same
color code.
4.3 Step 3: Pre-modeling Explainability
Process: Explanatory Metrics
In order to enrich the unfolded automaton with more
intelligible and useful information, a pre-modeling
explainability process is applied. To do so, each state
S
(t
start
,t
end
)i
is characterized by extracting the values of
three metrics out of the set of vectors associated to
window W ∈ [t
start
,t
end
]:
• Average Speed Sp that represents the mean of the
speeds of change of values between time t and t − 1.
• Average Velocity Vl that represents the mean of the
velocities calculated for each speed. This metric also
shows the dynamics of the evolution of the values for
the considered state S
i
.
• Average Acceleration Ac that represents the rapid-
ity of change of speed Sp of the states’ values in evo-
lution on a given window W .
Note that if a state S
i
occurs twice in a window W ,
then the explanatory metrics will be computed twice.
Figure 2.(c) represents an unfolded automaton with
the various metrics.
5 EXPERIMENTS
We now present experiments performed in order to
evaluate our XR-CSB. We first describe the dataset
and then evaluate the scalability of XR-CSB and the
explainability power of the representations. The re-
sults are discussed at the end of the section
4
.
4
Experiments have been run on a Max OSX BigSur
v 12.2.1, Processor Apple M1 8 cores, 16 GB memory.
Python scientific stack is used, namely Numpy, Scipy, Mat-
plotlib, Networkx, Scikit-learn and Pandas.
KDIR 2022 - 14th International Conference on Knowledge Discovery and Information Retrieval
174
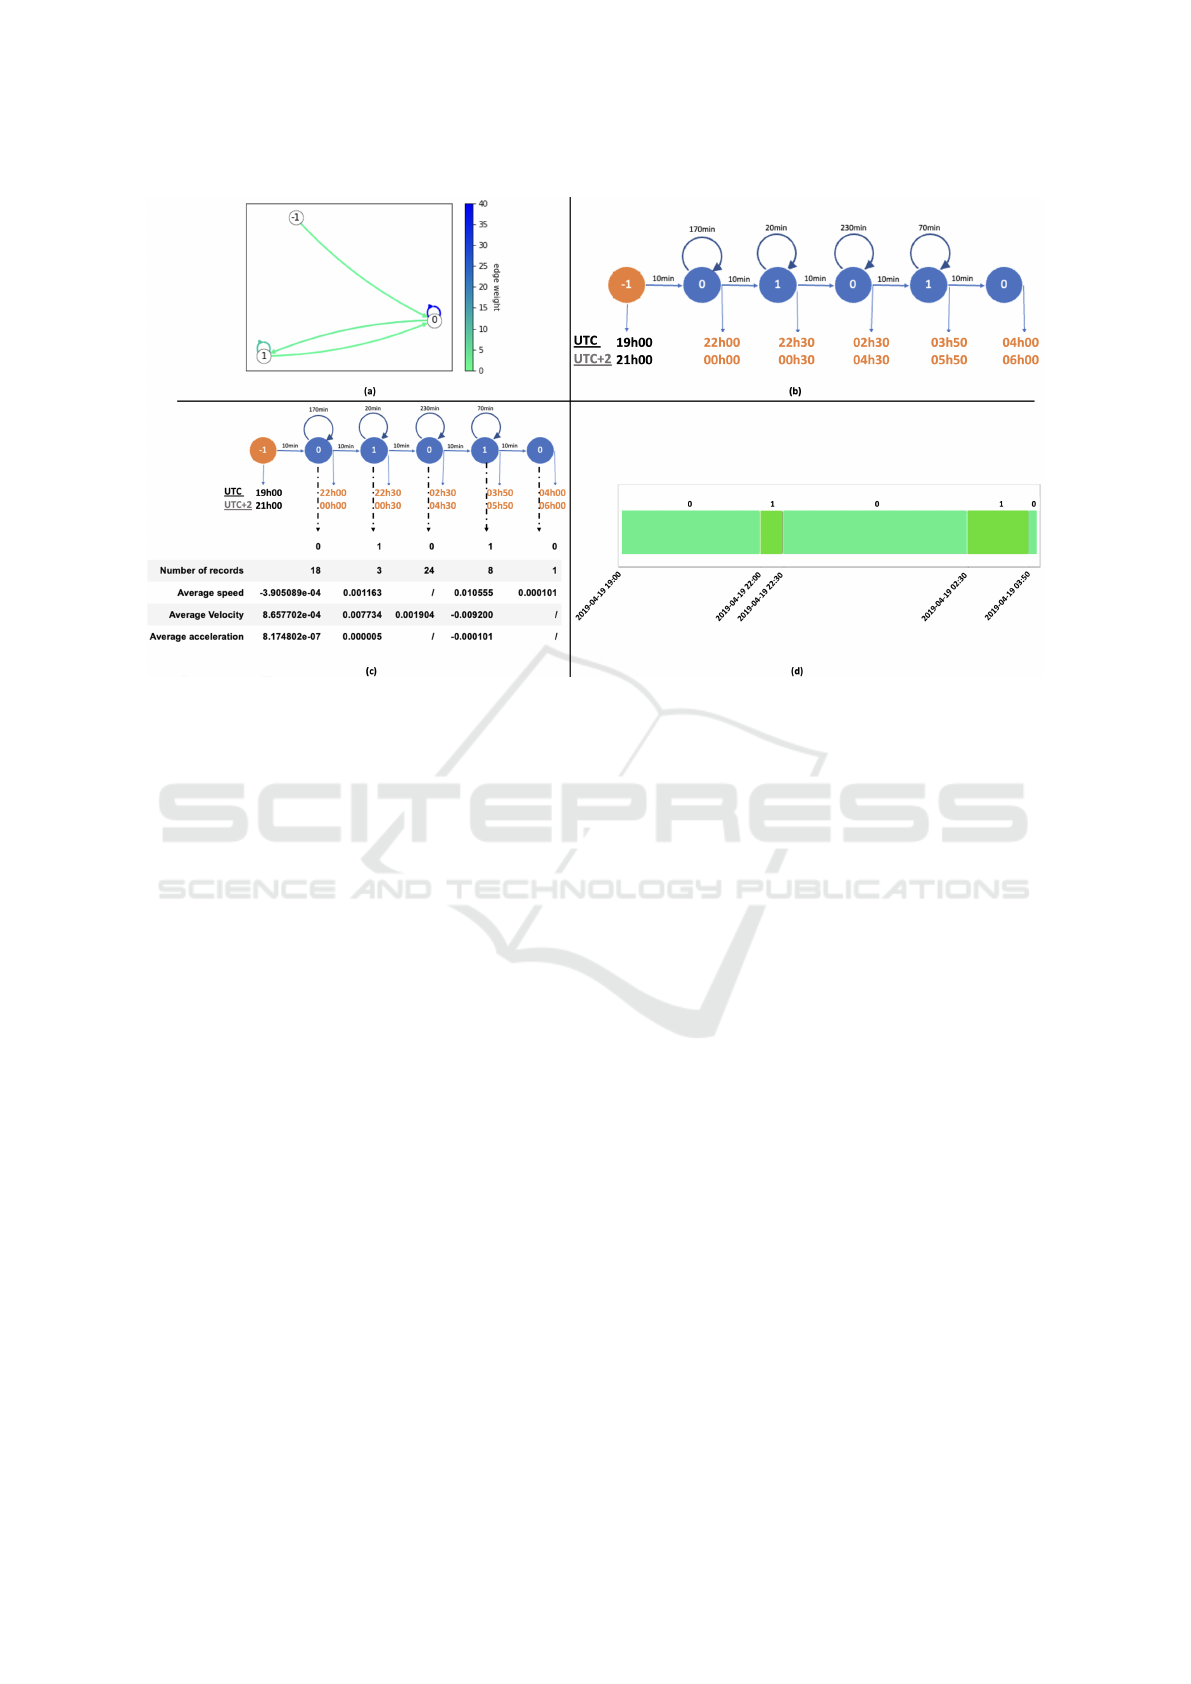
Figure 2: XR-CSB Step 3: The four representations evaluated for the qualitative study obtained from the analysis of a single
sensor with monotonic behavior (i.e., no significant variation in values) that has been clustered with k = 2. (a) an automaton:
the −1 node designates the beginning of the analysis and is not part of the data group. Transitions are given a color that
indicates their weight: the darker the color, the higher the weight of the transition; (b) an unfolded automaton with a visual
representation of time for each state through numerical values; (c) an unfolded automaton with explanatory metrics; (d) an
unfolded automaton with a visual representation of time for each state.
5.1 Description of the Industrial Dataset
Our dataset is related to energy generation: a thermal
power station that burns coal and gas to produce steam
in order to generate electricity. This power station has
five boilers and other equipment. Each equipment is
monitored through a multitude of sensors. Our dataset
contains 377 times series representing the recordings
of 377 sensors every 10 minutes during three years.
In the current work we present the results on 92 time
series of a specific boiler B. For each window W ,
we consider the related PDF reports (written every 8
hours by technicians that maintain the power station )
for post-hoc validation. For confidentiality issues, the
dataset cannot be published online. Practically, at the
pre-processing level, given a time window W and a
number of times series to analyze, the considered data
can be represented as a matrix of dimension (m × d)
where m ∈ {1, . . . , w} and dimension d is the num-
ber of time series (see Figure 1). Data processing can
be incremental and dynamic: in real-time processing,
for each new timestamp, a new column is added to the
matrix with the values of the corresponding variables,
which is a real advantage. As time series represent
sensors with different units, all values are normalized
(through mean and standard deviation). When d > 1,
an average is calculated from the normalized values.
5.2 Scalability Evaluation
Figure 3 represents the execution time w.r.t. the num-
ber of clusters k, for a fixed window. We study 92
time series over w = 144 timestamps (i.e. 24 hours).
k varies between 3 and 100. Figure 4 represents the
execution time w.r.t. the window length w, for k = 7
clusters. w is varied in such a way that we can evalu-
ate the necessary computation time over days, months
and years. For both analyses, the execution time in-
creases nearly linearly and the algorithm presents a
good scalability. For k < 40, the execution time is
reasonable: 1.25 seconds. For k = 100, the execu-
tion time is of 1.997 seconds. To analyze more than
2 years of data, our method requires about 20 min-
utes. This time remains relatively reasonable given
the industrial context and the fact that the technicians
themselves generate reports every 8 hours.
5.3 Qualitative Evaluation of
Explainability
The results of XR-CSB are intended to domain ex-
perts of our industrial partners. Thus, a subjective
analysis was done via a questionnaire on the represen-
tations quality and the explainability of the thermal
Automata-based Explainable Representation for a Complex System of Multivariate Times Series
175
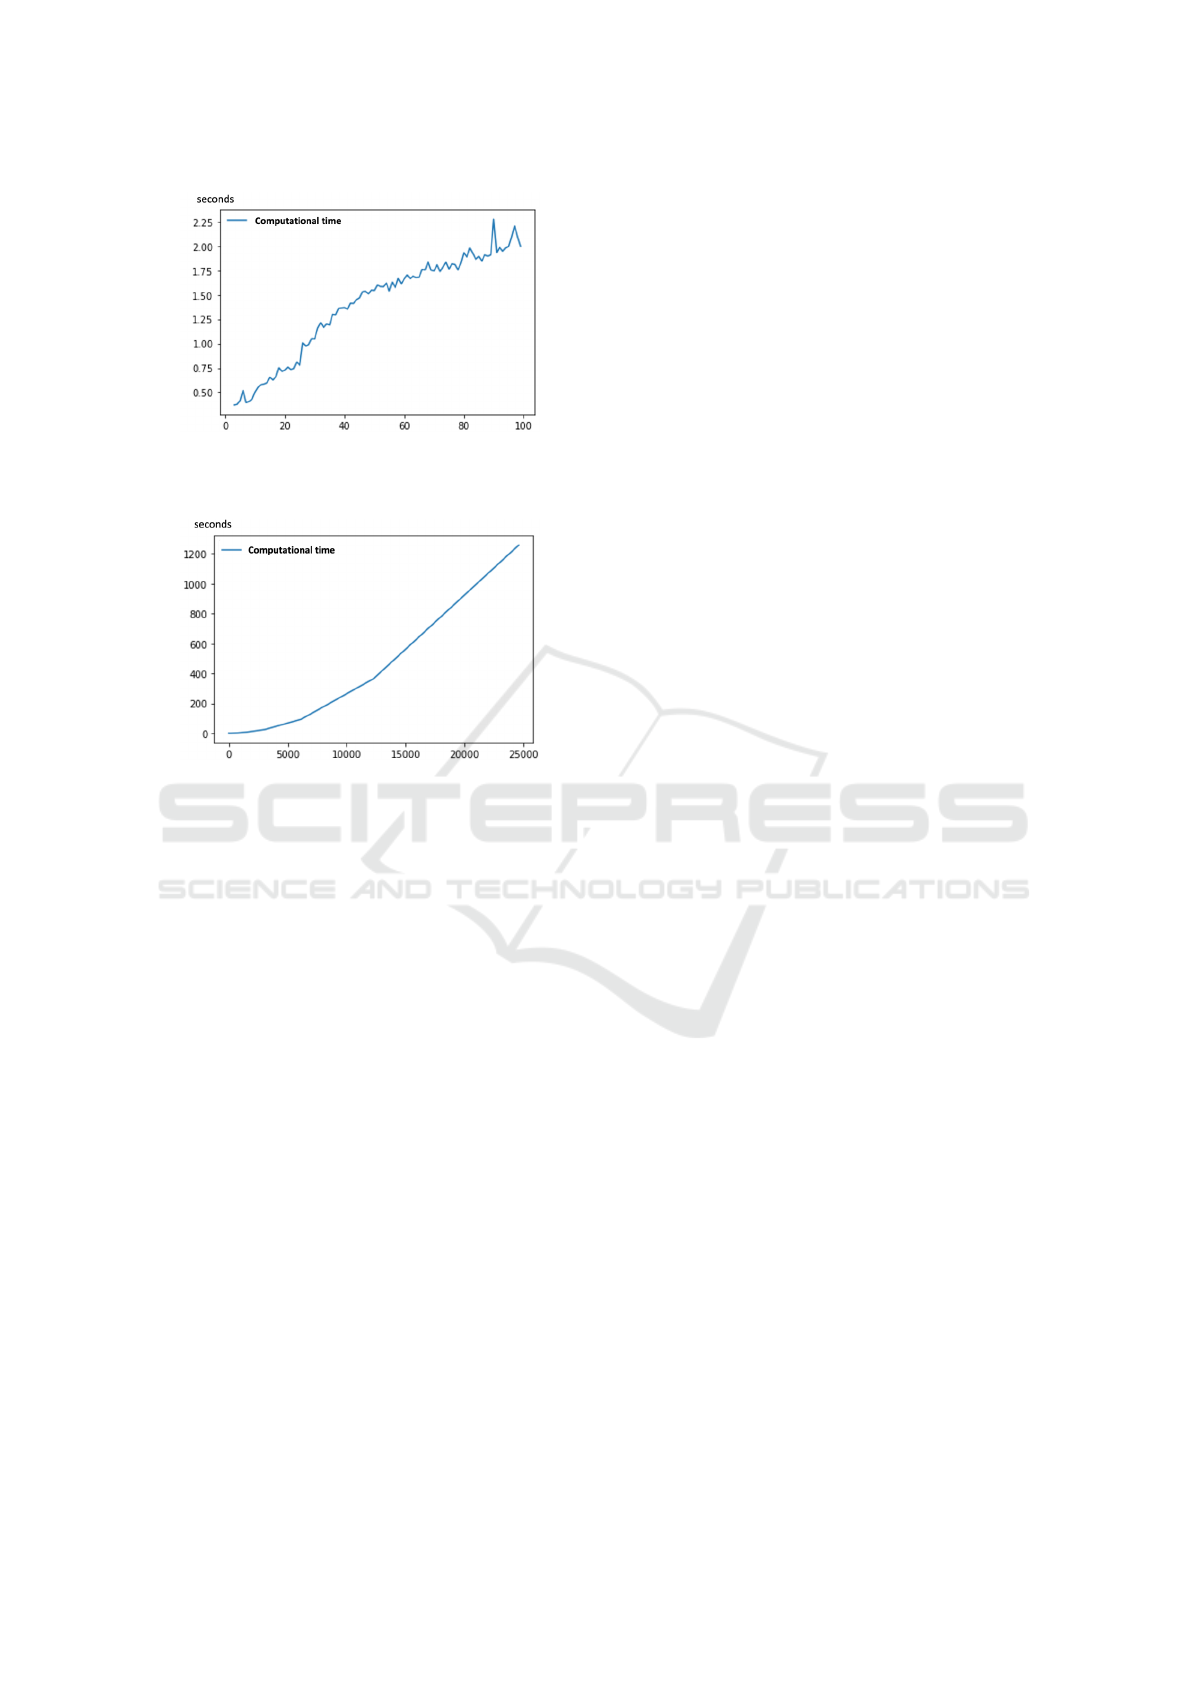
Figure 3: Execution time w.r.t. the number of clusters k:
Analysis of 92 sensors over 24 hours, i.e., 144 records, for
k in {3, . .. , 100}.
Figure 4: Execution time w.r.t the window length w: Anal-
ysis of 92 sensors, for k = 7 and hours h in {8, 16, 24, 48,
96, 192, 384, 768, 1.536, 3.072, 6.144, 12.288, 24.576} .
power station’s behavior. The questionnaire contains
four parts. The first three ones deal with case studies
and the last one deals with the domain expert’s profile.
5.3.1 Use Cases
We evaluate several representations aiming at explain-
ing the system’s behavior over time according to dif-
ferent use cases: (i) Use case (A.1): analysis of
a sensor C
1
whose physical unit is “tons per hour”
(t/h) when it presents a monotonous behavior i.e. flat
curve, (ii) Use case (A.2): when C
1
presents a dy-
namic behavior as the curve varies; (iii) Use case (B):
analysis of 92 sensors of boiler B. For each use case,
4 representations, presented in Figure 2, are proposed.
5.3.2 Profile of Sampled Respondents
The employees of two IT companies answered the
questionnaire: Company 1 works with data from the
thermal power station and therefore has a precise
knowledge about the industrial context. Company 2
works on the development of websites and interfaces
of tools dedicated to data management.
Concerning Company 1, among the 6 respondents: 4
data scientists, 1 machine learning engineer and 1 op-
erations manager. All of them have been working on
complex systems: 3 for less than a year, 1 for 1 to 2
years and 2 for more than 5 years. They all use visual
representations in their daily work to explain or trans-
mit information. Regarding Company 2, among the 7
respondents: 4 developers/engineers, 1 project man-
ager, 1 product manager, 1 R&D engineer. None of
them have experience in complex systems, few have
experience in AI tools, but 6 of them have more than
1 year experience in interface design and user expe-
rience issues (human-machine interaction and human
factors): 2 have an experience between 1 and 2 years,
2 have an experience between 2 and 5 years and two
have an experience of more than 5 years. Finally, con-
cerning the use of visual representations in their daily
work: 4 use them only when necessary, 2 use them
regularly and only 1 daily.
• Trust and Explanations in AI System Behavior:
For Company 1: 4 respondents prefer multi-modal ex-
planations (combining several forms), 1 prefers visual
representations and 1 answered that only results mat-
ter (especially in supervised machine learning). Re-
garding Company 2: 6 prefer multi-modal explana-
tions and only 1 prefers visual explanations. Let us
underline two important points: (i) on both companies
no respondent prefers uni-modal explanations (textual
or tabular), and (ii) all have trust in AI systems results
only according issues at stake.
• Professional Experience Related to the Behavior
of Complex Systems: Regarding the problem of rep-
resenting the behavior of complex systems over time,
at the level of Company 1, 2 encounter it “occasion-
ally” (50% of their projects), 3 encounter it “some-
times” (60% of their projects) and 1 encounters this
problem “regularly” (70% of his/her projects). In
Company 2, 1 encountered this problem “occasion-
ally”, 1 “rarely”, and 5 never worked on this type of
problem.
5.3.3 Evaluation of Acceptability and
Explainability Power of Representations
In this section, we evaluate the acceptability of the
representations for each of the 3 use cases for both
companies. Figure 5 and 6 present respectively the
results of the evaluation by the industrial experts of
Company 1 and those of Company 2.
Globally, for Company 1, representations (b), (c)
and (d) are considered as “Little representative” or
“Totally representative”. Representation (a) did not
convince the experts. Of the 3 use cases, representa-
tion (d) proved to be the most interesting for the ex-
perts. Finally, the free comments of the experts show
a recommendation to merge the representations (b)
and (d) described as intuitive and interesting as the
states are identifiable as well as the temporal distribu-
KDIR 2022 - 14th International Conference on Knowledge Discovery and Information Retrieval
176
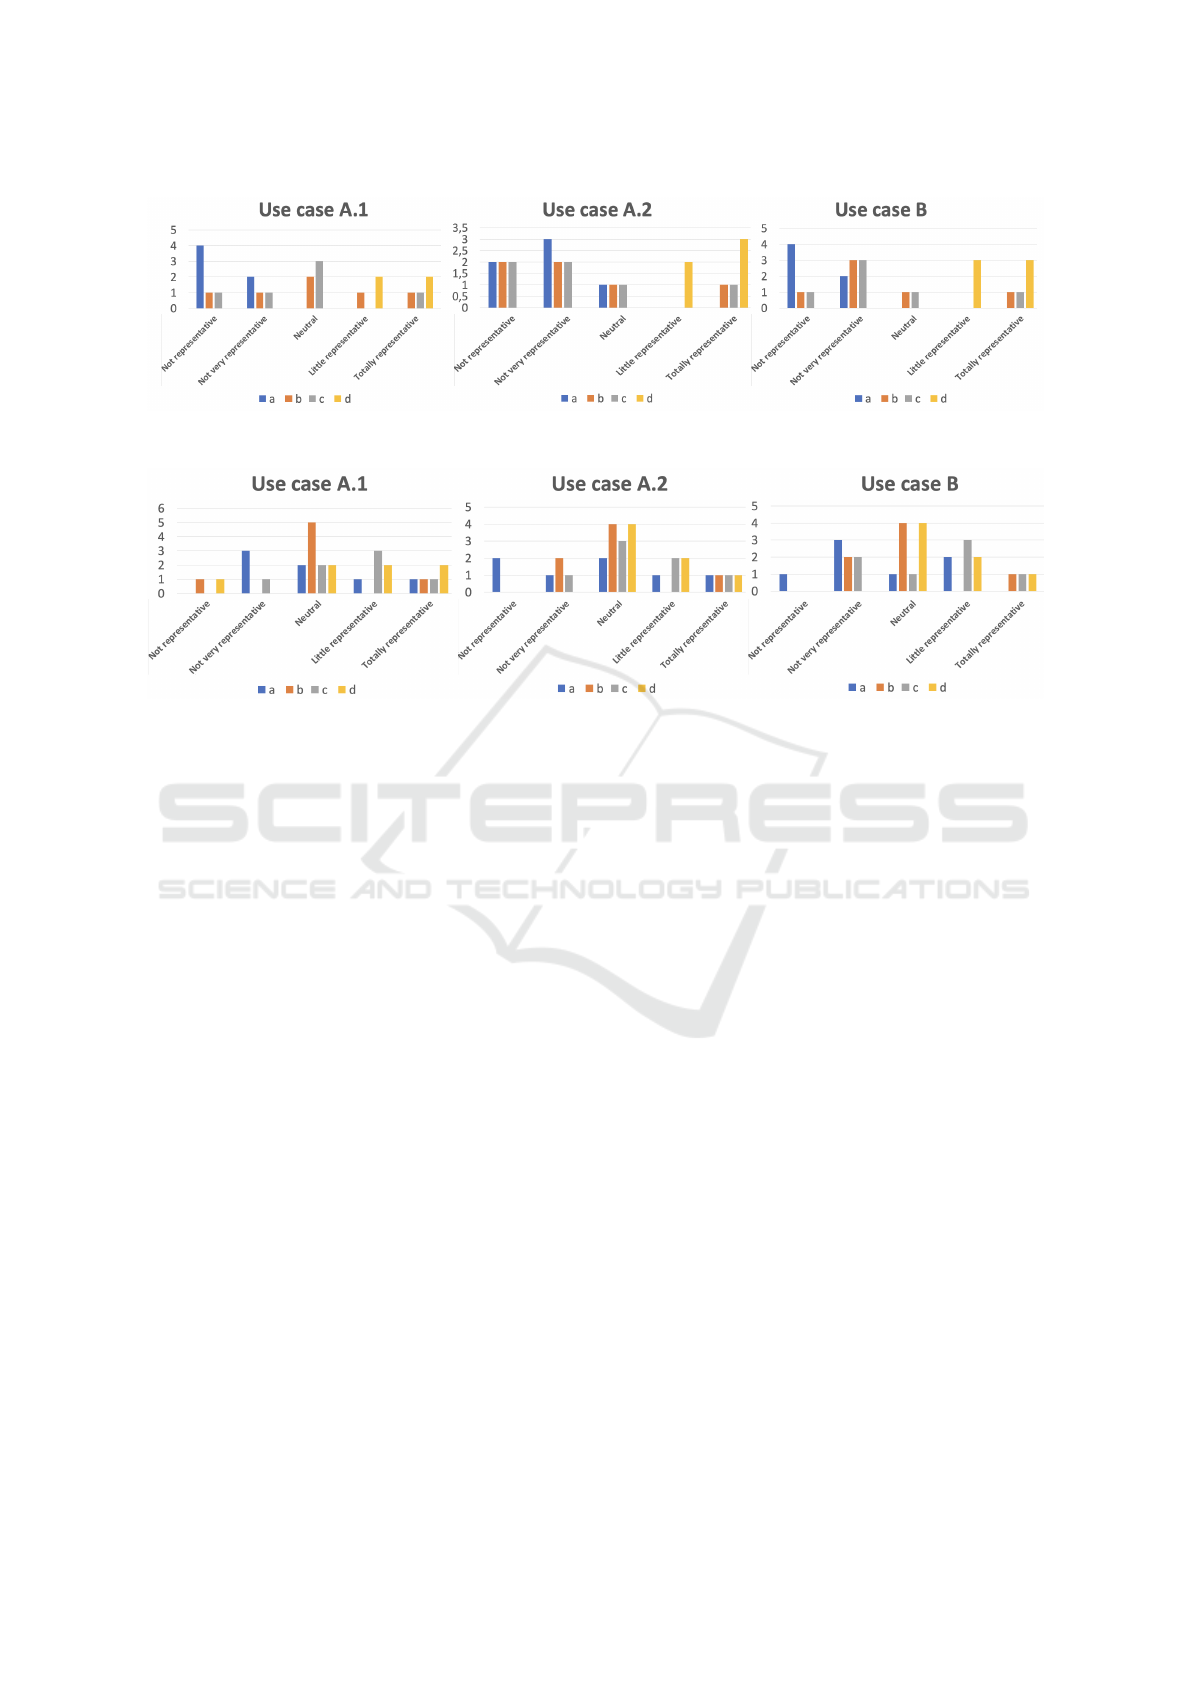
Figure 5: Company 1: Explainability evaluation of representations a, b, c, d for each use case. Values designate number of
respondents.
Figure 6: Company 2: Explainability evaluation of representation a, b, c, d for each use case. Values designate number of
respondents.
tions.
For Company 2, representations (c) and (d) were posi-
tively perceived regardless of the use case considered.
Representation (a) evolved from a globally positive
perception (“clear representation” according to one
respondent) to a more negative perception as the com-
plexity of the use cases and the number of nodes in
the automaton increased. The perception of the rep-
resentation (b) is mostly neutral in the 3 use cases.
Finally, the comments added by the experts show that
the representation (c) is to be preferred as it is more
informative due to the added explainable metrics. It
was designated as the most useful on the three case
studies to understand the behavior of a system during
a time range. Finally, representation (d) is described
as the most explicit in terms of time representation.
5.3.4 Acceptability of Representations: The Role
of Exploratory Metrics
According to Figure 7, regardless of the case studies
and the respondents’ Company, the unfolded repre-
sentations (b) and (c) received a good evaluation on its
ability to represent the behavior of a system over time.
Representation (d) was particularly convincing due to
the color systems, simplicity of the color schemes and
simplicity of visualization.
Representations (a) and (c) were perceived differ-
ently by respondents from Company 1 and Company
2: Respondents from Company 1 considered repre-
sentation (c) interesting but limited in terms of ex-
plainability of behavior. There was no rejection of
it but no major adoption either. Several factors can
explain this result: the choice of metrics and the cre-
ation of the representations were done (i) by a data-
oriented approach (data science approach), (ii) with-
out a strong involvement of the experts (our target
audience), (iii) without an explicit need for explain-
ability on their part, and (iv) without a context on the
objective of the present work. Finally, representation
(a) did not find support at Company 1.
Respondents from Company 2, on the other hand, per-
ceived representations (a) and (c) as informative, with
a better evaluation of representation (c). The combi-
nation of visual and numerical information, i.e. multi-
modal explanations, made it possible to evaluate the
representation as informative and to be favored for the
understanding of the behavior of complex systems.
Thus, our multi-modal representation (c) has proven
to be aligned with the preferences of the respondents
who mostly prefer multi-modal explanations.
Finally, the experts’ feedback on the intelligibility
thresholds of the automata is sensibly the same be-
tween the two companies: between 5 and 10 nodes
maximum for a graph. The number of sensors beyond
which the analysis of the system becomes complex
varies between the respondents of both companies:
For Company 1, the threshold is between 10 and 15
Automata-based Explainable Representation for a Complex System of Multivariate Times Series
177

(a) Company 1 (b) Company 2
Figure 7: Experts answers to the question “To understand the system which of these representations is most useful to you?”.
(confirmed by a senior expert of Company 1
5
) and for
Company 2, between 5 and 50 (the respondent who
marked 50 sensors underlined his lack of knowledge
of the domain). Finally, a respondent from Company
2 considered that the proposed graphs allowed to free
oneself from the thresholds of intelligibility in terms
of sensors number.
To conclude, the results of the questionnaire show
a difference in perception of the acceptability of a
representation according to the profile of the com-
pany’s experts, the apriori knowledge of the domain,
and the technical experience with the subject: the
neophyte profiles of a domain prefer more informa-
tion on the considered complex system (Company 2),
whereas those familiar with the subject seem not to
need this information there (Company 1). The aver-
age comments of the experts leads to the following
conclusion: the visual representation seems essential
for the information transmission aspect, but it must,
of course, be relevant and easily understandable. This
highlights an important trade-off between the perfor-
mance of AI approaches, the relevance of the visual
explanations and its intelligibility for the target audi-
ence. Note that in our study, the representations and
the clustering have been validated by the domain ex-
perts. Finally, all the results confirm that the XR-CSB
method allows generating an explainable and intelli-
gible visual representation of the behavior of a com-
plex system that interfaces with experts as well as
neophytes.
6 CONCLUSION
We proposed XR-CSB: an original method to repre-
sent and explain complex system’s behavior based on
vertical clustering and (unfolded) automata through
four original representations (Figure 2). Our exper-
5
The respondent with a technical profile who has the
most experience (more than 5 years) in the given industrial
domain recommends 6 nodes for an unfolded graph and an
analysis between 10 and 15 sensors.
imental study shows that representations are inter-
esting for experts with different profiles and levels
of expertise because they give multi-modal explana-
tions i.e. information about the behavior of the sys-
tem whether it is simple (one time series) or complex
(in our case, almost a hundred time series). Experts
with different expertise levels have evaluated and vali-
dated specific proposed representations showing a dif-
ference the acceptability of a representation according
to their profile.
In future works, we aim to include the technical
PDF reports (that have comments with explicit tempo-
ral information about actions undertaken) to make an
automatic post-hoc validation process of the extracted
unfolded automata. It is thus possible to link states
of the unfolded automaton to specific comments and
hence to label those states, which can be done easily
as our method is flexible. In addition, we would like
to integrate additional time series represented by cat-
egorical variables (e.g. PDF reports). However, this
makes it impossible to extend traditional clustering
techniques because of the traditional distance mea-
sure. Therefore, it is important to propose an adapted
distance measure, that can be inspired from (Ghas-
sempour et al., 2014) in order to handle the data het-
erogeneity. Finally, we aim to focus on the detection
and explainability of relevant sensors that play a dis-
criminatory role in the state of the system. This can
help managers to identify boilers that are most impor-
tant for the power station management, and globally
contributes to explainability issues related to time se-
ries clustering.
ACKNOWLEDGEMENTS
Thanks to the Conseil r
´
egional de Bretagne and the
European Union for funding this work via the FEDER
program. Thanks to the companies Energiency and
Script&Go for their collaboration and Rapha
¨
el Char-
bey for his guidance in graphic visualization.
KDIR 2022 - 14th International Conference on Knowledge Discovery and Information Retrieval
178

REFERENCES
Aghabozorgi, S. R., Shirkhorshidi, A. S., and Teh, Y. W.
(2015). Time-series clustering - A decade review. Inf.
Syst., 53:16–38.
Barredo Arrieta, A., Diaz-Rodriguez, N., Del Ser, J., Ben-
netot, A., Tabik, S., Barbado, A., Garcia, S., Gil-
Lopez, S., Molina, D., Benjamins, R., Chatila, R., and
Herrera, F. (2020). Explainable artificial intelligence
(XAI): Concepts, taxonomies, opportunities and chal-
lenges toward responsible AI. Inf. Fusion, 58:82–115.
Bennetot, A., Donadello, I., Qadi, A. E., Dragoni, M.,
Frossard, T., Wagner, B., Saranti, A., Tulli, S.,
Trocan, M., Chatila, R., Holzinger, A., d’Avila
Garcez, A., and D
´
ıaz Rodr
´
ıguez, N. (2021). A
Practical Tutorial on Explainable AI Techniques.
https://arxiv.org/abs/2111.14260.
Braud, A., Ganc¸arski, P., Grac, C., Herrmann, A., Le Ber,
F., and Vernier, H. (2021). Classification de s
´
eries
temporelles h
´
et
´
erog
`
enes pour le suivi de l’
´
etat des
cours d’eau. volume E-37 of RNTI, pages 71–82.
Carlos-Sandberg, L. and Clack, C. D. (2021). Incorpora-
tion of causality structures to complex network analy-
sis of time-varying behaviour of multivariate time se-
ries. Scientific Reports, 11(1):18880.
Chraibi Kaadoud, I., Fahed, L., and Lenca, P. (2021). Ex-
plainable AI: a narrative review at the crossroad of
knowledge discovery, knowledge representation and
representation learning. In MRC@IJCAI, vol 2995 of
CEUR Workshop Proceedings, pages 28–40.
Chraibi Kaadoud, I., Rougier, N. P., and Alexandre, F.
(2022). Knowledge extraction from the learning of
sequences in a long short term memory (LSTM) ar-
chitecture. Knowl. Based Syst., 235:107657.
Cortez, P. and Embrechts, M. J. (2013). Using sensitiv-
ity analysis and visualization techniques to open black
box data mining models. Inf. Sci., 225:1–17.
Desmarais, M. C. and Lemieux, F. (2013). Clustering and
visualizing study state sequences. In EDM, pages
224–227.
Ghassempour, S., Girosi, F., and Maeder, A. (2014). Clus-
tering multivariate time series using hidden markov
models. Int. J. of environmental research and public
health, 11(3):2741–2763.
Giorgino, T. (2009). Computing and visualizing dynamic
time warping alignments in R: the dtw package. J.
Stat. Softw., 31:1–24.
Guespin-Michel, J. (2016). La science des syst
`
emes com-
plexes. https://urlz.fr/hIxs. Visited: 2022-5-4.
Guidotti, R., Monreale, A., Ruggieri, S., Turini, F., Gian-
notti, F., and Pedreschi, D. (2019). A survey of meth-
ods for explaining black box models. ACM Comput.
Surv., 51(5):93:1–93:42.
Gunning, D. (2019). DARPA’s explainable artificial intelli-
gence (XAI) program. In Int. Conf. on Intelligent User
Interfaces. ACM.
Harel, D. (1987). Statecharts: A visual formalism for com-
plex systems. Sci. Comput. Program, 8(3):231–274.
Hassanibesheli, F., Boers, N., and Kurths, J. (2020). Recon-
structing complex system dynamics from time series:
a method comparison. New J. Phys, 22(7):073053.
Higgs, B. and Abbas, M. (2014). Segmentation and cluster-
ing of car-following behavior: Recognition of driving
patterns. IEEE Trans. Intell. Transp. Syst., 16(1):81–
90.
Le Saux, E., Lenca, P., and Picouet, P. (2002). Dynamic
adaptation of rules bases under cognitive constraints.
Eur. J. Oper. Res, 136(2):299–309.
Lenca, P. (2002). Human centered processes. Eur. J. Oper.
Res, 136(2):231–232.
Moshkovitz, M., Dasgupta, S., Rashtchian, C., and Frost,
N. (2020). Explainable k-means and k-medians clus-
tering. In ICML, pages 7055–7065.
Omlin, C. W. and Giles, C. L. (1996). Extraction of rules
from discrete-time recurrent neural networks. Neural
Networks, 9(1):41–52.
Pham, V., Nguyen, N., Li, J., Hass, J., Chen, Y., and Dang,
T. (2019). MTSAD: Multivariate time series abnor-
mality detection and visualization. In IEEE Big Data,
pages 3267–3276.
Rousseeuw, P. J. (1987). Silhouettes: a graphical aid to
the interpretation and validation of cluster analysis. J.
Computational Applied Mathematics, 20:53–65.
Shortliffe, E. H. (1974). A rule-based computer program
for advising physicians regarding antimicrobial ther-
apy selection. In ACM Annual Conference, page 739.
Soto, M. G., Henzinger, T. A., and Schilling, C. (2021).
Synthesis of hybrid automata with affine dynamics
from time-series data. In HSCC, pages 1–11.
Theissler, A. (2013). Detecting anomalies in multivari-
ate time series from automotive systems. PhD thesis,
Brunel Univ. School of Engineering and Design.
van Fraassen, B. (1988). The pragmatic theory of explana-
tion. Theories of Explanation, 8:136–155.
Weitz, K., Schiller, D., Schlagowski, R., Huber, T., and
Andr
´
e, E. (2021). “let me explain!”: exploring the
potential of virtual agents in explainable ai interaction
design. J. Multimodal User Interfaces, 15(2):87–98.
Weld, D. S. and Bansal, G. (2019). The challenge of crafting
intelligible intelligence. Commun. ACM, 62(6):70–79.
Yang, F., Huang, Z., Scholtz, J., and Arendt, D. L. (2020).
How do visual explanations foster end users’ appro-
priate trust in machine learning? In In. Conf. on Intel-
ligent User Interfaces, pages 189–201. ACM.
Yang, K. and Shahabi, C. (2004). A PCA-based similarity
measure for multivariate time series. In Int. workshop
on Multimedia databases, pages 65–74.
Zeng, Z., Goodman, R. M., and Smyth, P. (1993). Learn-
ing finite-state machines with self-clustering recurrent
networks. Neural Comput., 5(6):976–990.
Zhang, Y., Lin, Q., Wang, J., and Verwer, S. (2017). Car-
following behavior model learning using timed au-
tomata. IFAC-PapersOnLine, 50(1):2353–2358.
Automata-based Explainable Representation for a Complex System of Multivariate Times Series
179
