
Simulation of Swiss Market Index (SMI) for the First 20 Years in the
21
st
Century and Weekly and Monthly Average from 1990 to 2010
with Random Walk
Shaomin Yan
a
and Guang Wu
b
National Engineering Research Center for Non-Food Biorefinery, State Key Laboratory of Non-Food Biomass and Enzyme
Technology, Guangxi Academy of Sciences, 98 Daling Road, Nanning, 530007, Guangxi, China
Keywords: Big Data Mining, SMI, Random Walk, Simulation, Stock Market.
Abstract: This is the continuation of our series of studies on use the random walk model to simulate stock indices in
order to provide evidence to verify the efficient market hypothesis (EMH). In this study, our simulation is
directed to the Swiss Market Index (SMI). However, we expand our approach not only to the SMI in the first
20 years in the 21
st
century, but also to the period from 1990 to 2010 by using daily, weekly and monthly
close prices because our previous experience shows the volatility is the obstacle to set the command in Monte
Carlo algorithm correctly. The results not only confirm what we found in our previous studies that the random
walk model can simulate the SMI, but also provide fresh evidence on simulation on the moving average.
1 INTRODUCTION
The Swiss Market Index (SMI) is an important and
useful benchmark, which is composed of 20 most
important companies in Switzerland. It attracts many
investors/institutions and funds, not only because it
includes some world famous and renowned
companies such as ABB, Credit Suisse, Nestlé,
Novartis, Roche, Swiss Life, and UBS, but also it
serves as a thermometer for the health of Swiss
economy and those companies. Fairly enough, the
SMI is not as important as the stock indices such as
CAC40 and DAX in major European economy, but
the SMI has still been studied since early days
(Ranaldo, 2001, Thorbecke, 2018, Kato, 2018).
As a matter of modeling, the SMI is subject to
many mathematical and statistical studies (Tenreiro
Machado, 2012, Fallahgoul, et al., 2019, Dudukovic,
2014), and online software analyses, for instance, V-
Lab Analyses (V-Lab Analyses, 2021). However, to
the best of our knowledge, the random walk model as
an important analytical tool has yet to apply to the
investigation on SMI.
Random walk was proposed to support the
efficient market hypothesis (EMH) (Boya, 2019,
Urquhart 2016, McGroarty 2016), which was mainly
a
https://orcid.org/0000-0001-7642-3972
b
https://orcid.org/0000-0003-0775-5759
verified using statistical tools, for example, variance
ratio test, unit root test, autocorrelation test, and run
test (Lo, 1988, MacKinlay, 1988, Liu, 1991, He,
1991, Deo, 2003, Richardson, 2003, Chow, 1993,
Denning, 1993, Aktan, et al., 2019). Over recent
years, our group attempted to verify this hypothesis
with the random walk simulations on stock indices
(Yan, 2011, Wu, 2011, 2020, 2021). Although our
studies in conjunction with other studies provide us
with new insights into this issue, a solid conclusion
still cannot be drawn. This is because many technical
details, which are absolutely unexpected, appear
during the studies. This nevertheless requires more
studies to increase our first-hand experience. Hence,
we employ the random walk model to simulate the
SMI for the first 20 years in the 21
st
century.
2 MATERIALS AND METHODS
2.1 SMI Data
In Yahoo Finance (Yahoo Finance, 2021), the SMI
includes daily open, high, low, close, adjusted close
prices, and volume for download. Two sets of data
were used in this study.
1018
Yan, S. and Wu, G.
Simulation of Swiss Market Index (SMI) for the First 20 Years in the 21st Century and Weekly and Monthly Average from 1990 to 2010 with Random Walk.
DOI: 10.5220/0011364600003440
In Proceedings of the International Conference on Big Data Economy and Digital Management (BDEDM 2022), pages 1018-1022
ISBN: 978-989-758-593-7
Copyright
c
2022 by SCITEPRESS – Science and Technology Publications, Lda. All rights reserved

(1) The first 20 years in the 21
st
century includes
5029 trading days. In consistent with our previous
studies (
Yan, Wu, 2011, 2020, 2021), we divide this
period of 20 years into five segments: (i) 5029 trading
days the segment from 2001 to 2020, (ii) 3767 trading
days for segment from 2006 to 2020, (iii) 2508
trading days for segment from 2011 to 2020, (iv)
1255 trading days for segment from 2016 to 2020,
and (v) 252 trading days for segment for 2020.
(2) The daily, weekly and monthly close prices
from November 9, 1990 to July 30, 2010 include
4968 daily close prices, 1030 weekly close prices,
and 237 monthly close prices.
2.2 Classical Random Walk
The classical random walk (Feller, 1968) is quite
simple and straightforward. It is a path in x, y
coordinates, where the movement starts from the
origin and each step along the x-axis takes either 1/–1
along the y-axis. Historically, 1/–1 was generated by
tossing a fair coin, but nowadays 1/–1 is generated by
any computer program using the command to generate
a series of random numbers. If a random number is
larger or smaller than its previous one, then we round
the random number into 1/–1. Currently the most
popular algorithm to generate random numbers is the
Monte Carlo method.
2.3 SMI in Pattern of a Random Walk
In fact, we can let SMI mimic the classical random
walk by means of comparison between trading days,
that is, if an SMI close in a trading day is larger or
smaller that in its previous trading day, then we
consider it as 1/–1. With trading date as x-axis and
1/–1 as y-axis, we can pace an SMI in pattern of a
random walk. This SMI pathway in x, y coordinates
can compare with the random walk generated by the
Monte Carlo method, which can generate different
random walks with different seeds. Clearly, the best
simulation needs a seed which can generate a random
walk as approximate to the SMI in pattern of a
random walk as possible. Therefore the entire
becomes to search for such the best seed. Our
previous studies (
Yan and Wu, 2011, 2020, 2021a,b,c)
show that we need at least to search 100 000 seeds
ranged from 0 to 10 using SigmaPlot (
SPSS Inc.,
SigmaPlot, 2002)
in order to find a seed, which, though
not the best, is satisfactory.
Table 1: Procedure to compose a random walk simulation.
Date
SMI Close
Price
Compare
Previous
Close Price
Random
Walk in 1 or–
1 Pattern
Generated
Random
Number
Compare
Preceding
Random
Number
Random
Walk in 1 or–
1 Pattern
Generated
Random
Number
Random
Walk in
Decimal
Pattern
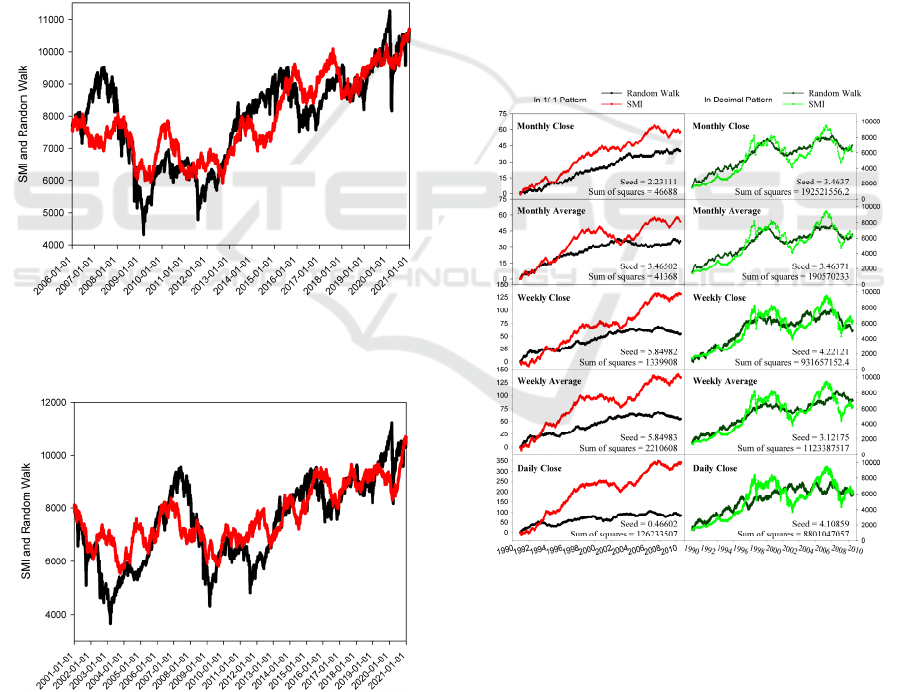
Jan 3, 2020 10699.82 0 –0.02686 0 84.8911 10699.82
Jan 6, 2020 10665.41 –1 –1 0.84546 1 1 –14.31492 10685.51
Jan 7, 2020 10686.8 1 0 –0.7544 –1 0 36.62705 10722.13
Jan 8, 2020 10652.16 –1 –1 0.9241 1 1 –96.3666 10625.76
Jan 9, 2020 10650.97 –1 –2 0.51223 –1 0 –34.41585 10591.35
Jan 10, 2020 10639.49 –1 –3 –0.15068 –1 –1 57.08906 10648.44
Jan 13, 2020 10622.41 –1 –4 0.39615 1 0 –76.11688 10572.32
Jan 14, 2020 10655.82 1 –3 0.75981 1 1 59.3287 10631.65
Jan 15, 2020 10670.74 1 –2 –0.82084 –1 0 20.01103 10651.66
2.4 Random Walk in Decimal Pattern
The limitation of classical random walk in simulation
is obvious because the SMI is the decimal data
although we can artificially change the SMI in a
pattern of 1/–1. Evidently, the classical random walk
needs to be decimally digitalized, that is, we can
directly use the generated random number to
compose a random walk in x, y coordinates: each
trading day goes along the x-axis and each generated
number goes along the y-axis.
3 RESULTS AND DISCUSSION
We explain how to compose the random walk
simulations in both 1/–1 and decimal patterns in
Table 1. Columns 1and 2 do not require an
explanation. Column 3 is the comparison of
sequential SMI closes in column 2 with 1/–1 for
larger or smaller than previous SMI close. Column 4
is the SMI in the 1/–1 pattern by means of the addition
of each value in column 3. Column 5 is the random
numbers generated by SigmaPlot. Column 6 is the
Simulation of Swiss Market Index (SMI) for the First 20 Years in the 21st Century and Weekly and Monthly Average from 1990 to 2010
with Random Walk
1019
comparison of sequential random numbers in column
5 with 1/–1 for larger or smaller than previous value.
Column 7 is the classical random walk by means of
the addition of each value in column 6. Column 8 is
the random numbers generated by SigmaPlot with the
upper/lower ranges of standard deviations of SMI
close in 2020. Column 9 is the random walk in the
decimal pattern by means of the addition of each
value in column 8. Comparisons can be made
between columns 4 and 6 for the 1/–1 pattern, and
between columns 2 and 9 for the decimal pattern.
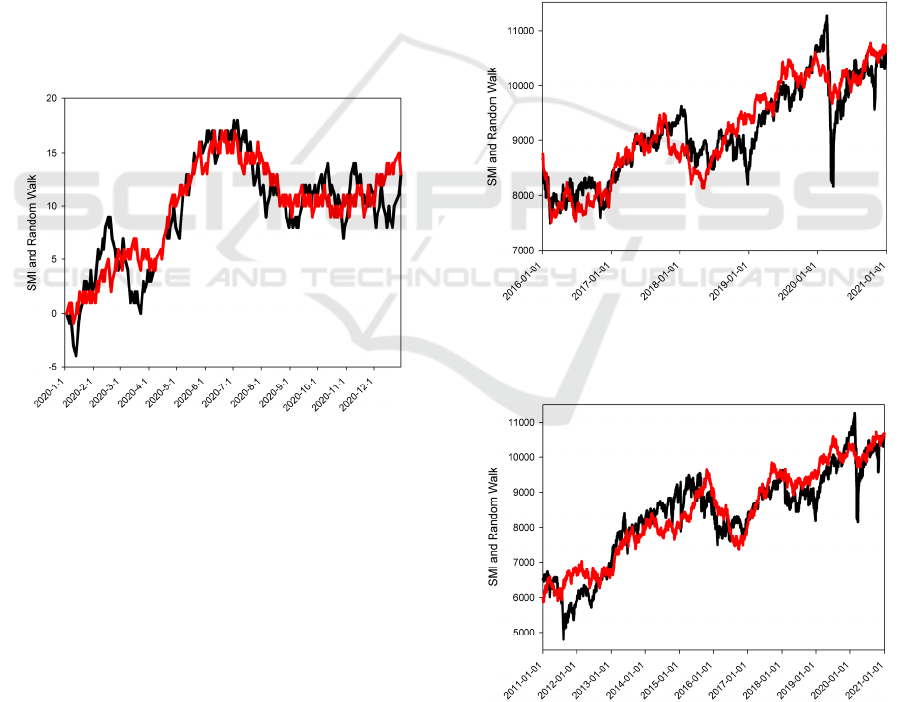
Figure 1 is the comparison between SMI close and
random walk simulation in the 1/–1 pattern for 2020.
Clearly, the simulation is very close to the SMI.
Figure 2 is the comparison between SMI close and
random walk simulation in the decimal pattern for
2020. Clearly, the simulation is not as good as that in
Fig. 1, but the simulation is reasonably fine. This
demonstrates the difficulty in the simulations in the
decimal pattern because of too many choices leading
too much computational time and the exhausting
seeds for Monte Carlo algorithm.
Figure 1: The SMI in 2020 in 1/–1 pattern (black line) and
its simulation (red line) generated by random walk in 1/–1
pattern using the seed of 3.15054.
In our previous studies (Yan, Wu, 2011, 2020,
2021)
, we used to detail the difference between
figures in order to indicate the impact of Covid-19
pandemic and financial crisis. However, we will not
repeat these details in this study because these events
not only affect the stock markets similarly but also
can be considered as random events due to their
unexpectedness. Therefore, importance is to simulate
the stock indices under these unexpected and
unpredictable random events rather than to detail
what occurs in figures.
Figures 3, 4, 5 and 6 are the comparison between
SMI close and random walk simulation in the decimal
pattern from 2016, from 2011, from 2006 and from
2001 to 2020. These figures as the figures in our
previous studies (Yan, Wu, 2011, 2020, 2021)
demonstrate the possibility to use a random walk
model to simulate the stock indices, but the suitability
is limited to short period of time because the
simulation for a short period of time is usually better
than the simulation for a long period of time.
However, if we dive into the depth of simulation, we
found that the random walk is not time-dependent,
but rather than volatility-dependent. The unexpected
and unpredictable events essentially sharply increase
the volatility of stock. This makes difficulty in
random walk simulation because the random walk is
based on the generated random numbers, whose
command sets four parameters, number to generate,
upper/lower ranges and seeds. How to the
upper/lower ranges is crucial.
Figure 3: The SMI from 2016 to 2020 (black line) and its
simulation (red line) generated by random walk in decimal
pattern using any of three seeds from 3.75113 to 3.75115.
Figure 4: The SMI from 2011 to 2020 (black line) and its
simulation (red line) generated by random walk in decimal
pattern using the seed of 3.76679.
BDEDM 2022 - The International Conference on Big Data Economy and Digital Management
1020
With increasing our experience in this type of
simulations, we consider that the minimization of the
volatility is perhaps a way to go around the difficulty
in choice of upper/lower ranges. Another possible
approach could use different seeds for different
periods of time. However, this type of simulations
seems to contradict to our understanding on
simulation.
In order to minimize the volatility, we consider
the approach of moving average, which can smooth
the fluctuations of the SMI in our study.
Figure 7 shows the comparison of simulations on
SMI daily, weekly and monthly average from 1990 to
2010. As can be seen, the simulations based on the
1/–1 pattern are worse than the decimal pattern in
general. This shortage could be attributed to the
extreme small probability for such a long period of
time.
Figure 5: The SMI from 2006 to 2020 (black line) and its
simulation (red line) generated by random walk in decimal
pattern using the seed of 1.25267.
Figure 6: The SMI from 2001 to 2020 (black line) and its
simulation (red line) generated by random walk in decimal
pattern using the seeds of 1.45015.
As we know that the probability for a perfect fit
for the 1/–1 pattern is ½n (
Yan, Wu, 2011, 2020, 2021),
where n is the number of points along the x-axis in x,
y coordinates. In such cases, the probabilities for
2020 is ½252, for the daily close from 1990 to 2010
is ½4968, for weekly close prices from 1990 to 2010
is ½1030, for monthly close prices is ½237. Clearly
these probabilities are very difficult to achieve.
4 CONCLUSIONS
In this study, we continue our efforts to verify the
EMH with simulation on the SMI. Moreover, we
attempt to simulate the SMI in its weekly and
monthly average in order to reduce the volatility,
which is due to unexpected random events. The
results not only confirm what we found in our
previous studies, but also shed lights on the
simulation based on the moving average. Thus, it
opens a new frontier for the simulations in the future.
Figure 7: Comparison of simulations on SMI daily, weekly
and monthly average from 1990 to 2010.
ACKNOWLEDGEMENTS
The authors are thankful to the Scientific
Development Fund of Guangxi Academy of Sciences
(2021YFJ1203).
Simulation of Swiss Market Index (SMI) for the First 20 Years in the 21st Century and Weekly and Monthly Average from 1990 to 2010
with Random Walk
1021

REFERENCES
Aktan, C., Iren, P. & T. Omay. (2019) Market development
and market efficiency: evidence based on nonlinear
panel unit root tests. Euro J Finan 25, 979–993.
Boya, C. M. (2019) From efficient markets to adaptive
markets: Evidence from the French stock exchange.
Res. Int. Bus. Finan. 49, 156–165, 2019.
Chow, K. V. & K. C. Denning. (1993) A simple multiple
variance ratio test. J. Econometrics 58, 385–401.
Deo, R. S. & M. Richardson. (2003) On the asymptotic
power of the variance ratio test. Econometric Theory
19, 231–239.
Dudukovic, S. (2014) A Cumulant-based stock market
volatility modeling – Evidence from the international
stock markets. J. Finan. Account. 17, 1–15.
Fallahgoul, H. A., Kim, Y. S., Fabozzi, F. J. & J. Park.
(2019) Quanto option pricing with Lévy models.
Comput. Economics 53, 1279–1308.
Feller, W. 1968. An introduction to probability theory and
its applications. John Wiley, New York, 3
rd
edition.
Liu, C.Y. & J. He. (1991) A variance ratio tests of random
walks in foreign exchange rates. J. Finan. 46, 773–785.
Lo, A. W. & A. C. MacKinlay. (1988) Stock market prices
do not follow random walks: Evidence from a simple
specification test. Rev. Finan. Studies 1, 41–66.
Ranaldo, A. (2001). Intraday market liquidity on the Swiss
Stock Exchange. Finan. Markets Portfolio Manage. 15,
309–327.
SPSS Inc., SigmaPlot 2002 for Windows Version 8.02.
(1986–2001).
Tenreiro Machado, J. (2012) Analysis of stock market
indices with multidimensional scaling and wavelets.
Math. Problems Engin. 2012, 819503.
Thorbecke, W. & A. Kato. (2018). Exchange rates and the
Swiss economy. J. Policy Modeling 40, 1182–1199.
Urquhart, A. & F. McGroarty (2016) Are stock markets
really efficient? Evidence of the adaptive market
hypothesis. Int. Rev. Finan. Anal. 47, 39–49.
V-Lab Analyses - Swiss Market Index AGARCH Volatility
Analysis. (2021)
https://vlab.stern.nyu.edu/volatility/VOL.SMI%3AIN
D-R.AGARCH
Yahoo Finance (2021) https://de.finance.yahoo.com/
Yan, S. & G. Wu. (2011) Fitting of SSEC index (Shanghai
composite) from January 2000 to July 2010 using
random walk model. Guangxi Sci. 18, 92–96.
Yan, S. & G. Wu. (2020) Fitting of impact of COVID-19
pandemic on S&P 500 Index using random walk.
Conference Publishing Services: ICEMME 4, 1007–
1011.
Yan, S. & G. Wu. (2021a) Fit Hang Seng index for 21
st
century with random walk model. Conference
Publication Series: CBFD 66–69.
Yan, S. & G. Wu. (2021b) Simulation of impact of COVID-
19 pandemic on Dow Jones index using random walk.
Proceedings in the 2nd International Conference on
Computing and Data Science (CONFCDS) 2021; 59–
64.
Yan, S. & G. Wu. (2021c) Simulation of NIKKEI 225 index
for 21
st
century using random walk. 2021 2nd
International Conference on Big Data and
Informatization Education (ICBDIE) 330–333.
BDEDM 2022 - The International Conference on Big Data Economy and Digital Management
1022
