
Data Driven Level Set Fuzzy Modeling for Cryptocurrencies Price
Forecasting
Leandro Maciel
1 a
, Rosangela Ballini
2 b
and Fernando Gomide
3 c
1
Department of Business Administration, Faculty of Economics, Business and Accounting, University of S
˜
ao Paulo,
S
˜
ao Paulo, Brazil
2
Department of Economic Theory, Institute of Economics, University of Campinas, S
˜
ao Paulo, Brazil
3
Department of Computer Engineering and Automation, School of Electrical and Computer Engineering,
University of Campinas, S
˜
ao Paulo, Brazil
Keywords:
Data Driven Fuzzy Modeling, Cryptocurrency, Forecasting.
Abstract:
The paper develops a data-driven fuzzy modeling procedure based on level set to forecast cryptocurrencies
prices. Data-driven level set is a novel fuzzy modeling method that differs from linguistic and functional
fuzzy models in how the fuzzy rules are built and processed. The level set-based model outputs the weighted
average of output functions associated with the fuzzy rules. Output functions map the activation levels of
the fuzzy rules directly in the model outputs. Computational experiments are done to evaluate the level set
method to forecast the closing prices of Bitcoin, Ethereum, Litecoin and Ripple. Comparisons are made with
ARIMA, ETS, MLP and na
¨
ıve random walk. The results suggest that the random walk outperforms most
methods addressed in this paper, but it is surpassed by the level set model for Ethereum. When performance
is measured by the direction of price change, the level set-based fuzzy modeling performs best amongst the
remaining methods.
1 INTRODUCTION
Since the creation of Bitcoin (Nakamoto, 2008), one
of the most popular cryptocurrencies, a rapid growth
of the digital coin market has been verified. Accord-
ing to CoinMarketCap website, the market capitaliza-
tion of cryptocurrencies on February 14, 2022 was
higher than USD 1.91 trillion, with Bitcoin account-
ing for more than USD 810 billion
1
. In contrast to tra-
ditional cash systems, advantages of cryptocurrencies
are decentralization, security and privacy, easy trans-
fer of funds, and lower transaction costs (Mukhopad-
hyay et al., 2016). On 2022, more than 2,000 types
of cryptocurrencies are available for public trading,
which reveals the significance of digital coins as an
electronic payment system also as a financial asset,
attracting substantial interest from the general public,
investors, and researchers (Zhang et al., 2021; Bal-
cilar et al., 2017).
a
https://orcid.org/0000-0002-1900-7179
b
https://orcid.org/0000-0001-6683-4380
c
https://orcid.org/0000-0001-5716-4282
1
Source:https://coinmarketcap.com/. Access on Febru-
ary 14, 2022.
One particular feature of most cryptocurrencies is
the high volatile price dynamic, which directly affects
investors and speculators profits and losses. The low
correlations of digital coins with conventional assets
also make the analysis of future price fluctuations
more difficult (Parfenov, 2022). Besides being a
high complex and risky market, cryptocurrencies
still represent an alternative investment instrument,
providing an alternate for portfolio diversification
(Sun et al., 2020). For example, (Selmi et al., 2018)
stated that Bitcoin serves as a hedge, a safe haven,
and a diversifier for oil price movements in terms
of diversification opportunities and downside risk
reductions. Hence, the development of accurate
price-forecasting models for cryptocurrencies is of
key interest by market participants.
The price of cryptocurrencies is influenced by
many factors that induce volatility such as the move-
ments of macroeconomic variables, news and fake
news, government policies, and social media con-
tents (Philippas et al., 2019). Researchers have de-
veloped many models to predict future prices move-
ments of cryptocurrencies, which can be broadly or-
Maciel, L., Ballini, R. and Gomide, F.
Data Driven Level Set Fuzzy Modeling for Cryptocurrencies Price Forecasting.
DOI: 10.5220/0011379400003332
In Proceedings of the 14th International Joint Conference on Computational Intelligence (IJCCI 2022), pages 193-198
ISBN: 978-989-758-611-8; ISSN: 2184-3236
Copyright © 2023 by SCITEPRESS – Science and Technology Publications, Lda. Under CC license (CC BY-NC-ND 4.0)
193

ganized into: i) traditional time-series model such as
Autoregressive Integrated Moving Average (ARIMA)
(Tandon et al., 2021), and Generalized Autoregres-
sive Conditional Heteroskedasticity (GARCH) mod-
els (Fung et al., 2021); and ii) machine learning ap-
proaches (Chowdhury et al., 2020), such as Support
Vector Machines (SVM) (Hitam et al., 2019), neural
networks (Zhang et al., 2021), and deep neural nets
(Lahmiri and Bekiros, 2019).
Few studies have addressed price forecasting
of cryptocurrencies using fuzzy models. For in-
stance, (Atsalakis et al., 2019) developed a hybrid
neuro-fuzzy model to forecast the direction in the
change of the daily price of Bitcoin. The method
outperformed two other computational intelligence
models, a simple neuro-fuzzy based approach, and
an artificial neural network. Also considering Bitcoin
price forecasting, (Garcia et al., 2019) used an
evolving granular fuzzy-rule-based model which has
a modified rule structure that includes reduced-term
consequent polynomials, supplied with an incremen-
tal learning algorithm that simultaneously inputs
missing data, and updates model parameters and
structure. The authors indicated the high accuracy of
the suggested approach when compared with fuzzy
and neuro-fuzzy evolving modeling methods for
Bitcoin price prediction.
This paper develops a data-driven fuzzy model
to forecast time series of cryptocurrencies. Data-
driven fuzzy modeling uses the concept of level sets
to shape a novel fuzzy modeling paradigm. It dif-
fers from previous fuzzy modeling paradigms in the
way that the fuzzy rules are built and processed. The
level set method outputs the weighted average of out-
put functions, functions that map the activation lev-
els of the rules in points of the output variable do-
main. It has been shown that the data driven level set
method (LSM) is simple, effective, and transparent
(Maciel et al., 2022). The efficacy of LSM model-
ing is evaluated in forecasting the daily closing prices
of the four most traded cryptocurrencies: Bitcoin,
Ethereum, Litecoin and Ripple. Its performance is
compared with the autoregressive integrated moving
average (ARIMA), the exponential smoothing state
model (ETS), the na
¨
ıve random walk, and a multi-
layer neural network (MLP) benchmarks.
Since cryptocurrencies price forecasting is still an
open topic in the literature, due to the particularities
of the market, fuzzy techniques appear as a potential
modeling tool, mainly when dealing with the impre-
cision of the digital coin price movements. For exam-
ple, in March 2021, Elon Musk had announced in a
series of tweets that people could begin buying Tesla
cars with Bitcoin, after which the prices of Bitcoin
rose about 5% afterwards
2
. The data driven level set
method is a potential candidate to model and forecast
nonlinear and time-varying dynamics such as cryp-
tocurrency prices. The LSM also seems appropriate
to model time series that are affected by intangibles
like market sentiments which, because its fuzzy na-
ture, limits the expressiveness of statistical and ma-
chine techniques.
After this introduction, the paper proceeds as fol-
lows. Section 2 summarizes the data driven fuzzy
modeling based on the level set framework. Compu-
tational experiments concerning modeling and price
forecast of cryptocurrencies are reported in Section 3.
Finally, Section 4 concludes the paper and lists topics
for future development.
2 DATA DRIVEN LEVEL SET
MODELING
This section summarizes the data driven fuzzy mod-
eling based on the notion of level set. A detailed cov-
erage is given in (Leite et al., 2022). Consider a fuzzy
model whose fuzzy rules are as follows
R
i
: if x is A
i
then y is B
i
(1)
where i = 1, 2,.. .,N and A
i
and B
i
are convex fuzzy
sets with membership functions A
i
(x) : X →[0,1] and
B
i
(y) : Y → [0,1]. Given an input x ∈ X , the data-
driven level set method is as follows (Leite et al.,
2022; Yager, 1991).
1. Compute the activation degree of each rule R
i
as
τ
i
= A
i
(x) (2)
2. Find the level set B
τ
i
for each τ
i
B
τ
i
= {y|τ
i
≤ B
i
(y)} = [y
il
,y
iu
] (3)
3. Compute the midpoint of the level set
m
i
=
y
il
+ y
iu
2
(4)
4. Compute the model output y as
y =
∑
N
i=1
τ
i
m
i
∑
N
i=1
τ
i
(5)
where y
il
is the lower bound, and y
iu
is the upper
bound of the level set. When fuzzy set B
i
is discrete,
m
i
is the average of the elements of B
τ
i
. We assume
2
Source: https://www.cnbc.com/2021/03/24/elon-
musk-says-people-can-now-buy-a-tesla-with-bitcoin.html.
Accessed on February 14, 2022.
FCTA 2022 - 14th International Conference on Fuzzy Computation Theory and Applications
194

that there exists an i such that τ
i
> 0, otherwise the
output is made null.
Let F
i
(τ
i
) = m
i
(τ
i
), and D = {(x
k
,y
k
)}, x
k
∈ R
p
,
y
k
∈ R such that y
k
= f (x
k
), k = 1,2, ... ,K be a data
set. The goal is to build a fuzzy model F to approxi-
mate the function f using D where
F (τ) =
∑
N
i=1
τ
i
F
i
(τ
i
)
∑
N
i=1
τ
i
(6)
In the simplest case F
i
is affine
F
i
(τ
i
) = v
i
τ
i
+ w
i
(7)
Coefficients v
i
and w
i
can be estimated using least
squares-based procedures, regularized, recursive, or
alternative solutions. Here we use the pseudo inverse-
based solution. The essential steps are as follows.
For each data pair (x
k
,y
k
) compute the activa-
tion degrees τ
k
i
= A
i
(x
k
), i = 1,2,. ..,N, and let s
k
=
∑
N
i=1
τ
k
i
. From (6) and (7), the corresponding output is
z
k
=
τ
k
1
(v
1
τ
k
1
+ w
1
)
s
k
+ . .. +
τ
k
N
(v
N
τ
k
N
+ w
N
)
s
k
(8)
Let d
k
= [(τ
k
1
)
2
/s
k
,τ
k
1
/s
k
,. ..,(τ
k
N
)
2
/s
k
,τ
k
N
/s
k
] and
let the vector of parameters u = [v
1
,w
1
,. ..,v
N
,w
N
]
T
.
The expression (8) becomes
z
k
= d
k
·u, k = 1,..., K (9)
If we let z = [z
1
,. ..,z
K
]
T
, D = [d
1T
,. ..,d
KT
]
T
,
and y = [y
1
,. ..,y
K
]
T
, then the set of equations (9) can
be expressed compactly as z = Du. The vector of pa-
rameters u is the solution of min
u
||y −z||
2
, namely
u = D
+
z (10)
where D
+
is the Moore-Penrose pseudo inverse of D
(Serre, 2010). Recalling that d = d(τ
1
,. ..,τ
N
) and
that τ
i
= A
i
(x), the model output for input x is
y = d ·u (11)
which is equivalent to (5).
In sum, the data driven level set method (LSM) is
as follows:
1. Cluster the data set D into N clusters.
2. Assign membership function A
i
to cluster i =
1,. ..,N.
3. Find consequent vector of coefficients using (10).
4. Compute model output using (11).
As it is well known in the fuzzy modeling litera-
ture, clustering can be done to identify the A
′
i
s using
any clustering algorithm such as the fuzzy c-means
(FCM) or its variations, adaptive vector quantization,
grid, or knowledge-based granulation. The member-
ship function parameters can be tuned using context
knowledge, or an appropriate search procedure.
3 COMPUTATIONAL RESULTS
3.1 Data
This section reports the computational experiments
using datasets of the daily closing prices of four
leading cryptocurrencies: Bitcoin (BTC), Ethereum
(ETH), Litecoin (LTC) and Ripple (XRP)
3
The data
was divided in in-sample and out-of-sample sets, for
models training and testing, respectively. Table 1
summarizes the in-sample and out-of-sample sets for
each cryptocurrency. In the table T denotes the num-
ber of samples (size) of the data set. The data cover
periods of high volatility for each cryptocurrency.
The idea is to avoid time periods with flat or nearly
stable price values because, in these situations, pre-
diction is easier, which explains why the sets are dif-
ferent for each digital coin. Forecasting is one-step-
ahead. The modeling and forecasting techniques con-
sidered for comparison are the autoregressive moving
average (ARIMA) (Box et al., 2016), the exponential
smoothing state space model (ETS) (Hyndman et al.,
2008), the na
¨
ıve random walk (RW), and a multilayer
perceptron neural network (Haykin, 2009).
Table 1: Data sets for cryptocurrency price forecasting.
Crypto
In-Sample Out-of-sample
Start End T Start End T
BTC 01/01/2021 07/16/2021 197 07/16/2021 01/24/2022 193
ETH 03/18/2021 07/15/2021 120 07/16/2021 01/24/2022 193
LTC 12/17/2020 07/19/2021 215 07/20/2021 01/24/2022 189
XRP 12/02/2021 07/12/2021 151 07/13/2021 1/24/2022 196
Performance evaluation of methods is done using
the mean squared error (MSE), the root mean squared
error (RMSE), and the normalized RMSE (NRMSE),
respectively:
MSE =
1
T
T
∑
t=1
(y
t
− ˆy
t
)
2
(12)
RMSE =
√
MSE (13)
NRMSE =
RMSE
sd(y
test
)
(14)
where y
t
is the actual price at time t, ˆy
t
the forecasted
price at t, T is the size of the out-of-sample data set,
3
Selection done choosing cryptocurrencies with the
highest liquidity and market capitalization. Data source:
https://coinmarketcap.com/
Data Driven Level Set Fuzzy Modeling for Cryptocurrencies Price Forecasting
195

sd(·) is the standard deviation, and y
test
the actual out-
of-sample data.
Additionally, in practice the direction of price
change is as important as, sometimes even more im-
portant than the magnitude of the forecasting error
(Burns and Moosa, 2015). A measure of forecast di-
rection is:
DA =
1
T
T
∑
t=1
Z
t
, Z
t
=
1, if ( ˆy
t+1
−y
t
)(y
t+1
−y
t
) > 0,
0, otherwise.
(15)
Na
¨
ıve random walk uses the current price as a
forecast of the next time step:
ˆy
t
= y
t−1
. (16)
RW forecasting follows the weak form of market
efficiency, which states that future securities prices
are random and are not affected by past events. It as-
sumes that information of stock prices are reflected in
the current prices and has no relationship with the past
market prices. Clearly, RW is not capable to predict
price direction.
As in time series modeling and forecast method-
ology, MLP and LSM model and forecast cryptocur-
rency prices using lagged values of the series as fol-
lows:
ˆy
t
= f (y
t−1
,y
t−2
,. ..,y
t−d
), (17)
where d is the number of lagged closing prices.
3.2 Results
Evaluation and comparison of LSM with ARIMA,
ETS, RW and MLP in one-step-ahead cryptocurren-
cies closing prices forecasting uses out-of-sample
data as testing data. LSM was implemented in
Python, and ARIMA, ETS and MLP were constructed
using R forecast package. Table 2 shows the paramet-
ric structure of each method. In ARIMA(p,d f ,q) p,
d f and q stand for the number of autoregressive, dif-
ference, and moving average terms, respectively. In
ETS(er,tr,sea) er, tr, and sea mean error, trend, and
seasonal type, respectively. For each of these A, M
and N denote additive, multiplicative, and none, re-
spectively. MLP(d,h
1
,h
2
,.. ., h
n
) denotes a neural net-
work with as many inputs as the number lagged val-
ues of the series model d, and with h
i
neurons in the
i-th hidden layer, i = 1,..., n. The MLP neural net-
works use sigmoid activation functions in the hidden
layer with linear output layer, trained with backprop-
agation. The structures of ARIMA, ETS and MLP
are selected automatically by R to produce the high-
est accuracy in the in-sample set. LSM(d,N) means a
LSM model with d lagged values, and N fuzzy rules
with Gaussian membership functions. LSM struc-
tures were chosen experimentally and the simplest
model with best accuracy was chosen. In this paper,
LSM used Gaussian membership functions. As the
model output functions are affine, the parameters are
the Gaussians modal values and dispersions, and out-
put functions coefficients (a total of four parameters
for each rule). Therefore, according to the structure
of the models given in Table 2, the LSM has 8, 8,
12 and 12 parameters for BTC, ETH, LTC and XRP,
respectively. Additionally, LSM used fuzzy c-means
clustering for data partitioning.
Table 2: Structure of the forecasting models.
Crypto ARIMA ETS MLP LSM
BTC (2,1,2) (A,N,N) (1;5,1) (1,2)
ETH (0,1,2) (M,N,N) (8;4,1) (1,2)
LTC (2,1,0) (M,N,N) (5;3,1) (1,3)
XRP (0,1,1) (M,N,N) (1;3,1) (1,3)
Table 3 summarizes the forecasting performance
in terms of MSE, RMSE, NRMSE and DA. The best
results are highlighted in bold.
Table 3: Cryptocurrencies price forecasting performance
evaluation.
Model MSE RMSE NRMSE DA (%)
Panel A: BTC
RW 2.78961 1.67021 0.19697 -
ARIMA 2.93753 1.71392 0.20212 47.19
ETS 2.84838 1.68771 0.19903 48.77
MLP 3.25329 1.80369 0.21271 47.00
LSM 2.82390 1.68040 0.19860 52.08
Panel B: ETH
RW 2.16047 1.46985 0.21153 -
ARIMA 2.36282 1.53715 0.22121 49.02
ETS 2.50985 1.58425 0.22799 47.30
MLP 2.38548 1.54450 0.22227 48.09
LSM 2.34059 1.52990 0.22017 51.04
Panel C: LTC
RW 0.82744 0.90964 0.28183 -
ARIMA 0.87168 0.93364 0.28926 50.20
ETS 0.86557 0.93036 0.28825 50.87
MLP 0.97365 0.98674 0.30571 49.16
LSM 0.83820 0.91550 0.28440 56.38
Panel D: XRP
RW 0.00244 0.04941 0.25065 -
ARIMA 0.00244 0.04940 0.25062 51.66
ETS 0.00244 0.04944 0.25082 51.74
MLP 0.00263 0.05126 0.26007 49.89
LSM 0.00244 0.04940 0.25061 53.72
Na
¨
ıve random walk outperforms all competitors
from the point of view of MSE, RMSE and NRMSE
metrics, except for Ripple (XRP) when LSM gives the
best result amongst the remaining ones (see Table 3).
These results are consistent with the “Meese-Rogoff
FCTA 2022 - 14th International Conference on Fuzzy Computation Theory and Applications
196
puzzle” (Meese and Rogoff, 1983) which states that
exchange rate forecasting models do not outperform
random walk. Interestingly, our simulations show that
this is also the case for cryptocurrency forecasts. For
BTC, ETH and LTC, LSM reaches the highest accu-
racy after RW. ARIMA, ETS and MLP achieve sim-
ilar performance, but LSM forecasts are either the
closest, or better than those of RW.
The literature (Moosa and Burns, 2014) and
(Burns and Moosa, 2015) reports empirical findings
showing that forecasting models can outperform the
na
¨
ıve random walk for out-of-sample data if the per-
formance is measured by economic/financial metrics
such as the direction of change and/or profitability as
in forecast-based trading operations. Indeed, this is
also the case in cryptocurrency price forecasting. As
Table 3 shows, LSM outperforms ARIMA, ETS, and
MLP from the point of view of the direction accu-
racy (DA). The random walk underperforms all the
methods when the direction is used for comparison.
This is of utmost importance when trading strategies
use direction, because the potential to anticipate price
change is crucial for the success.
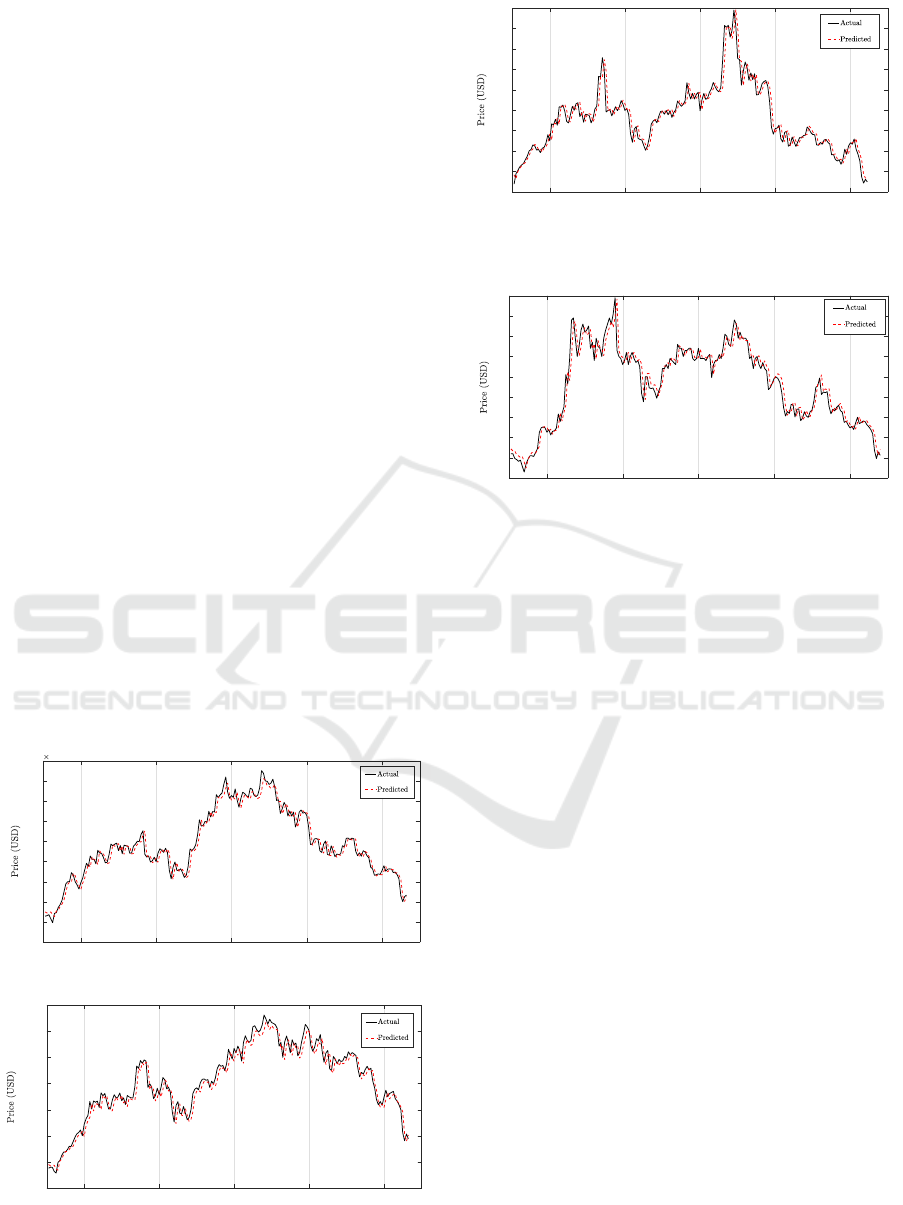
To further illustrate the efficiency of LSM in cryp-
tocurrencies forecast, Figures 1-4 show the actual
closing prices and the corresponding LSM forecasts
developed for BTC, ETH, LTC and XRP using test
data, respectively. The figures reveals that LSM accu-
rately predict price dynamics of the digital coins con-
sidered in this work, and unfolds as a potential fore-
cast tool to develop trading strategies in cryptocur-
rency market.
Aug 21 Sept 21 Oct 21 Dec 21 Jan 22
2.5
3
3.5
4
4.5
5
5.5
6
6.5
7
10
4
Figure 1: Actual Bitcoin prices and their LSM forecasts.
Aug 21 Sept 21 Oct 21 Dec 21 Jan 22
1500
2000
2500
3000
3500
4000
4500
5000
Figure 2: Actual Ethereum prices and corresponding LSM
forecasts.
Aug 21 Sept 21 Oct 21 Dec 21 Jan 22
100
120
140
160
180
200
220
240
260
280
Figure 3: Actual Litecoin prices and corresponding LSM
forecasts.
Aug 21 Sept 21 Oct 21 Dec 21 Jan 22
0.5
0.6
0.7
0.8
0.9
1
1.1
1.2
1.3
1.4
Figure 4: Actual Ripple prices and corresponding LSM
forecasts.
4 CONCLUSION
This paper has developed a data-driven fuzzy level
set-based model to forecast cryptocurrencies prices.
It differs from alternative fuzzy models mainly in the
way that the fuzzy rules are built and processed. A
level set-based model outputs the weighted average
of rule output functions, functions that map the ac-
tivation levels of the rules directly in a model out-
put. Computational experiments were done for one-
step-ahead forecasting of closing prices of Bitcoin,
Ethereum, Litecoin and Ripple. Comparison of the
data driven level set-based method was done against
ARIMA, ETS, MLP and na
¨
ıve random walk. The re-
sults indicate that random walk outperforms all the
competitors addressed in this paper, except for Ripple,
where LSM produced the highest out-of-sample accu-
racy. However, when performance is measured by the
direction of price change, the level set-based fuzzy
modeling rank is the highest. Future work shall con-
sider the use and evaluation of the data-driven level
set method in trading strategies to measure the fore-
cast performance in profitability terms.
Data Driven Level Set Fuzzy Modeling for Cryptocurrencies Price Forecasting
197

ACKNOWLEDGEMENTS
This work was supported by the Brazilian Na-
tional Council for Scientific and Technological De-
velopment (CNPq) under grants 304456/2020-9,
04274/2019-4 and 302467/2019-0, by the Ripple Im-
pact Fund, a donor advised fund of the Silicon Valley
Community Foundation, grant 2018-196450(5855) as
part of the University Blockchain Research Initiative,
UBRI, and by the Research Foundation of the State of
S
˜
ao Paulo (FAPESP), grant 2020/09838-0.
REFERENCES
Atsalakis, G. S., Atsalaki, I. G., Pasiouras, F., and Zopouni-
dis, C. (2019). Bitcoin price forecasting with neuro-
fuzzy techniques. European Journal of Operational
Research, 276(2):770–780.
Balcilar, M., Bouri, E., Gupta, R., and Roubaud, D. (2017).
Can volume predict bitcoin returns and volatility?
a quantiles-based approach. Economic Modelling,
62:74–81.
Box, G., Jenkins, G., Reinsel, G., and Jung, G. (2016). Time
Series Analysis, Forecasting and Control. John Wiley,
Hoboken.
Burns, K. and Moosa, I. (2015). Enhancing the forecasting
power of exchange rate models by introducing nonlin-
earity: Does it work? Economic Modelling, 50:27–39.
Chowdhury, R., Rahman, M. A., Rahman, M. S., and
Mahdy, M. (2020). An approach to predict and fore-
cast the price of constituents and index of cryptocur-
rency using machine learning. Physica A: Statistical
Mechanics and its Applications, 551:124569.
Fung, K., Jeong, J., and Pereira, J. (2021). More to cryp-
tos than bitcoin: A garch modelling of heterogeneous
cryptocurrencies. Finance Research Letters, page
102544.
Garcia, C., Esmin, A., Leite, D., and
ˇ
Skrjanc, I. (2019).
Evolvable fuzzy systems from data streams with miss-
ing values: With application to temporal pattern
recognition and cryptocurrency prediction. Pattern
Recognition Letters, 128:278–282.
Haykin, S. (2009). Neural Networks and Learning Ma-
chines. Pearson Education, Upper Saddle River.
Hitam, N. A., Ismail, A. R., and Saeed, F. (2019). An opti-
mized support vector machine (svm) based on particle
swarm optimization (pso) for cryptocurrency forecast-
ing. Procedia Computer Science, 163:427–433. 16th
Learning and Technology Conference 2019Artificial
Intelligence and Machine Learning: Embedding the
Intelligence.
Hyndman, R., Koehler, A., Ord, J., and Snyder, R. (2008).
Forecasting with exponential smoothing: the state
space approach. Springer-Verlag.
Lahmiri, S. and Bekiros, S. (2019). Cryptocurrency fore-
casting with deep learning chaotic neural networks.
Chaos, Solitons & Fractals, 118:35–40.
Leite, D., Gomide, F., and Yager, R. (2022). Data driven
fuzzy modeling using level sets. In 2022 IEEE World
Congress on Computational Intelligence, pages 1–10.
Maciel, L., Ballini, R., and Gomide, F. (2022). Data driven
level set method in fuzzy modeling and forecasting. In
2022 Annual Conference of the North America Fuzzy
Information Processing Society, pages 1–10.
Meese, R. and Rogoff, K. (1983). Empirical exchange rate
models of the seventies: Do they fit out of sample?
Journal of International Economics, 14(1–2):3–24.
Moosa, I. and Burns, K. (2014). The unbeatable random
walk in exchange rate forecasting: Reality or myth?
Journal of Macroeconomics, 40:69–81.
Mukhopadhyay, U., Skjellum, A., Hambolu, O., Oakley, J.,
Yu, L., and Brooks, R. (2016). A brief survey of cryp-
tocurrency systems. In 14th IEEE Annual Conference
on Privacy, Security and Trust (PST), pages 745–752.
Nakamoto, S. (2008). Bitcoin: A peer-to-peer electronic
cash system. Decentralized Business Review, 21260.
Parfenov, D. (2022). Efficiency linkages between cryp-
tocurrencies, equities and commodities at different
time frames. Procedia Computer Science, 199:182–
189.
Philippas, D., Rjiba, H., Guesmi, K., and Goutte, S. (2019).
Media attention and bitcoin prices. Finance Research
Letters, 30:37–43.
Selmi, R., Mensi, W., Hammoudeh, S., and Bouoiyour, J.
(2018). Is bitcoin a hedge, a safe haven or a diversi-
fier for oil price movements? a comparison with gold.
Energy Economics, 74:787–801.
Serre, D. (2010). Matrices: Theory and Applications.
Springer, New York.
Sun, X., Liu, M., and Sima, Z. (2020). A novel cryptocur-
rency price trend forecasting model based on light-
gbm. Finance Research Letters, 32:101084.
Tandon, C., Revankar, S., Palivela, H., and Parihar, S. S.
(2021). How can we predict the impact of the
social media messages on the value of cryptocur-
rency? insights from big data analytics. International
Journal of Information Management Data Insights,
1(2):100035.
Yager, R. (1991). An alternative procedure for the cal-
culation of fuzzy logic controller values. Journal of
the Japanese Society for Fuzzy Theory and Systems,
4:736–746.
Zhang, Z., Dai, H.-N., Zhou, J., Mondal, S. K., Garc
´
ıa,
M. M., and Wang, H. (2021). Forecasting cryptocur-
rency price using convolutional neural networks with
weighted and attentive memory channels. Expert Sys-
tems with Applications, 183:115378.
FCTA 2022 - 14th International Conference on Fuzzy Computation Theory and Applications
198
