
Impact of Usage Behaviour on the User Experience of Netflix,
Microsoft Powerpoint, Bigbluebutton and Zoom
Jessica Kollmorgen
1a
, Martin Schrepp
2b
and Jörg Thomaschewski
3c
1
University of Applied Sciences Lübeck, Lübeck, Germany
2
SAP SE, Walldorf, Germany
3
University of Applied Sciences Emden/Leer, Emden, Germany
Keywords: User Experience, Usability, Questionnaire, UEQ-Short, UMUX-Lite, SUS, UX Measurement, UX Survey.
Abstract: In order to be able to meaningfully classify the user experience and thus the popularity of products, UX
questionnaires such as the UEQ, SUS or UMUX are frequently used in practice to measure the UX. This
makes it possible to specifically evaluate the ratings of pragmatic and hedonic UX factors. However, it is
conceivable that, in addition to users' own perceptions, external factors also have an influence on the
evaluation of the UX of products. These include, for example, time or duration of use. It can be assumed that
users who rate the UX of a product as good also use this product more frequently and vice versa. Such a
consideration of influencing factors is particularly interesting for products that have been used frequently in
recent years and thus also during the pandemic. For this reason, Netflix, Microsoft PowerPoint, Zoom and
BigBlueButton were selected, which cover the range from primarily hedonic to primarily pragmatic quality.
These are examined for their UX ratings as well as influencing factors.
1 INTRODUCTION
In order to be able to assess how well products
support their users and how satisfied they are with
these products, questionnaires are commonly used. In
practice, the usability and user experience of certain
products can be easily measured with the help of
suitable standard questionnaires such as the User
Experience Questionnaire (UEQ) (Laugwitz, Schrepp
& Held, 2008) or the System Usability Scale (SUS)
(Brooke, 1996) in order to align them as closely as
possible with the needs of users (Schrepp, 2021).
However, if we look closer to the results, we often
see that different users access the user experience or
usability of the same product quite differently. Of
course there are many reasons for such differences
(Schrepp, 2021), for example personal preferences,
differences in the importance of certain UX factors
for the overall UX impression, or a different usage
behaviour (frequency of use, experience, product
used for different special tasks, etc.).
a
https://orcid.org/0000-0003-0649-3750
b
https://orcid.org/0000-0001-7855-2524
c
https://orcid.org/0000-0001-6364-5808
This in turn led to the research question of
whether there are external factors that influence the
perceived user experience of products in addition to
the classic UX factors and that can help to explain
differences in the UX evaluation.
On the one hand, it is conceivable that time and
the product adjustments associated with it have an
influence on the evaluation of the products (von
Wilamowitz-Moellendorff et al., 2007; Karapanos et
al., 2008). On the other hand, however, user
behaviour-dependent factors such as frequency of use
may also be relevant. People who use a product more
frequently typically know it better, have adjusted
their usage behaviour to avoid typical UX problems
of the product and therefore perceive the user
experience differently. Conversely, a product is
presumably only used more frequently if it offers a
good user experience.
In addition, the impact of such factors may also
depend on the UX scale. Here a distinction between
hedonic and pragmatic factors is relevant in order to
obtain a suitable overall impression of the products
Kollmorgen, J., Schrepp, M. and Thomaschewski, J.
Impact of Usage Behaviour on the User Experience of Netflix, Microsoft Powerpoint, Bigbluebutton and Zoom.
DOI: 10.5220/0011380100003318
In Proceedings of the 18th International Conference on Web Information Systems and Technologies (WEBIST 2022), pages 397-406
ISBN: 978-989-758-613-2; ISSN: 2184-3252
Copyright
c
2022 by SCITEPRESS – Science and Technology Publications, Lda. All rights reserved
397

measured (Hassenzahl, Diefenbach & Göritz, 2010).
While the pragmatic qualities (PQ) are related to the
ability of the product to support the user to reach
concrete goals, the hedonic quality (HQ) is aimed at
the fulfillment of psychological needs that do not
have the sole purpose of task fulfillment, such as fun
(Hassenzahl, 2008; Winter et al., 2017). It has already
been demonstrated in studies that the importance of
hedonic and pragmatic UX factors depend on the
product category (Winter et al., 2017; Kollmorgen et
al., 2021; Meiners et al., 2021). However, the usage
behaviour may have a different impact of pragmatic
and hedonic factors. As it is highly plausible that a
high expertise with a product may cause higher
ratings concerning pragmatic quality, it is quite
unclear if the same effect will exist for hedonic
qualities.
This led to the overarching research question, to
what extent the pragmatic as well as the hedonic
quality of products are influenced by the external
factors mentioned above. Does the impact of these
factors influence pragmatic and hedonic qualities
differently?
2 UX QUESTIONNAIRES
We try to evaluate the impact of demographic factors
and differences in product usage behaviour on
standard UX measures. Thus, we select 4 different
products and evaluate them with different
standardized UX questionnaires. Of course, we need
to consider the time that is required by a participant
to fill out multiple questionnaires and therefore we
selected three widely used UX questionnaires that are
relatively short: SUS, UMUX-LITE and UEQ-S.
2.1 System Usability Scale
The System usability scale (SUS) (Brooke, 1996) is a
short questionnaire containing 10 items that measure
classical usability criteria (ease of use, usefulness,
consistency, ease of learning). The items are short
statements about the product. Participants can express
their disagreement or agreement to these statements
on a 5-point response scale. Examples for such
statements are:
I found the system unnecessarily complex.
I felt confident using the system.
The SUS is at present one of the most popular
usability questionnaires. There is, in addition, a large
number of research papers that investigate the
psychometric properties of the SUS (Lewis, 2018).
The SUS provides an overall score between 0 and
100. For half of the SUS items agreement describes a
positive evaluation (see our second example item)
and the answers to these items are coded as 0 to 4
from disagreement to agreement. For the other half
(see our first example item) disagreement represents
the positive evaluation and these items are coded as 4
to 0 from disagreement to agreement. Thus, a 4
always represents the most positive evaluation and a
0 the most negative evaluation. Per participant the
scores are simply added up for all 10 items and the
result (which is between 0 and 40) is then multiplied
by 2.5 to scale it to a range from 0 to 100. The
rescaling is done mainly to make the result easier to
communicate. The SUS score for a product is then
simply the average over all participant scores.
2.2 Usability Metric for User
Experience (Short Form)
The short form of the Usability Metric for User
Experience (UMUX-LITE) (Finstad, 2010) contains
just two items in the form of short statements
concerning the product:
This system’s capabilities meet my requirements.
This system’s capabilities meet my require-
ments.
This system is easy to use.
Participants can express their disagreement or
agreement to these statements on a 7-point response
scale.
The concept behind UMUX-LITE is similar to the
Technology Acceptance Model (Davis, 1986) which
assumes that user acceptance of a new technology is
based on its perceived usefulness and perceived ease
of use. The UMUX-LITE is scored like the SUS.
Responses are coded as 0 to 6 from disagreement to
agreement, so 0 is the most negative and 6 the most
positive evaluation. The two item scores are added up
per participant and the result is then divided by 12 and
multiplied by 100 to transfer it to the range 0 to 100.
Again, the UMUX-LITE score for a product is then
the average over all participant scores. The UMUX-
LITE provides a high-level measurement of overall
UX. It is optimized for research situations that allow
to present only a very small number of questions to
the participants.
2.3 User Experience Questionnaire
(Short Form)
The User Experience Questionnaire (UEQ)
(Laugwitz, Schrepp & Held, 2008) is designed to
allow a quick assessment of UX using a number of
WEBIST 2022 - 18th International Conference on Web Information Systems and Technologies
398

task-related (pragmatic) and non-task-related
(hedonic) UX aspects. It contains 26 items which are
grouped into the 6 scales Attractiveness, Efficiency,
Perspicuity, Dependability, Stimulation and Novelty.
The item format is a semantic differential with a 7-
point answer scale.
The short version (Schrepp, Hinderks &
Thomaschewski, 2017), called UEQ-S, contains just
8 items (4 from the pragmatic scales Efficiency,
Perspicuity, Dependability and 4 from the hedonic
scales Stimulation and Novelty) and is available for
scenarios requiring very short completion times. This
short version contains only two scales for pragmatic
and hedonic quality.
Example items of the UEQ-S:
inefficien
t
o o o o o o o efficien
t
b
oring o o o o o o o exciting
The scale Pragmatic Quality contains the average
of the first 4 items and the scale Hedonic Quality the
average of the last four items. The items are scored
from -3 (negative term) to +3 (positive term) and
therefore this is also the range of the scales. An
overall value is determined by the mean over all 8
items, it represents to overall impression concerning
UX. The UEQ-S is translated in more than 30
languages. The UEQ-S questionnaire and an Excel
based data analysis tool are available free of charge
on https://www.ueq-online.org/.
3 STUDIES
As mentioned above, the dependency between UX
measurements and demographic factors or usage
behaviour can depend on the UX metric used and the
product being evaluated.
Therefore, we investigate
this dependency in our studies with different products
and the three different UX questionnaires described
in the last section.
Four well-known products that have been heavily
used in recent years are selected. The streaming
platform Netflix, the video conferencing tools Zoom
and BigBlueButton, and the presentation software
Microsoft PowerPoint. They support leisure activities
at home as well as remote working and thus a quite
heterogenous set of use cases and user experience
factors.
Netflix, which is mainly used for leisure, has a
stronger focus on hedonic quality such as fun and
visual aesthetics, while Microsoft PowerPoint (PPT)
has a stronger focus on pragmatic quality and the
efficient fulfillment of working tasks. The
conferencing tools Zoom and BigBlueButton (BBB)
cover both qualities, as they are used in both leisure
and work settings. Some of these software products
gained a lot of popularity and have been used much
more frequently than before, which is why they are
well suited for an examination of the external
influencing factors.
3.1 Setup of the Studies
In terms of data, the influencing factors for the four
products were collected with an online survey. The
survey starts with a short instruction. Then a few
demographic attributes of the participant and some
information about their usage behaviour are captured.
We ask for:
Age
Gender: Male (M), Female (F)
Frequency of usage (How often do you use
<product name>?): Not very frequent, Several
times a month, Several times a week, On a daily
basis
Experience (How good is your knowledge of
<product name>?): Low, Medium, Strong,
Excellent
Duration of usage (How long have you been
using <product name>?): Less than a week,
Since more than a week, Since more than 6
months, Since more than a year, Since more
than 5 years
All questions were optional, which is why there is
an additional No answer category. After this block
with demographic and behavioural questions, the two
items of the UMUX-LITE are shown, followed by the
8 items of the UEQ-S and then by the 10 items of the
SUS. At the end of the form users can provide free
textual comments concerning strength and weak-
nesses of the product.
3.2 Study Implementation
Participants for the studies were recruited via
different universities as well as over a panel and
received some monetary compensation for their
participation in the study. The questionnaires were
distributed to different target groups each, but
overlaps cannot be excluded.
The received either German or English
questionnaires in the period from September to
December 2021. After the collection, the data were
cleaned to increase their quality. In the process, data
records were removed if they had too short a
processing time or too few clicks, or if the quality
assurance question was answered incorrectly.
Impact of Usage Behaviour on the User Experience of Netflix, Microsoft Powerpoint, Bigbluebutton and Zoom
399
Therefore, a total of 97 records were removed and a
total of 338 remain. The average age of the
participants was about 28 years. More detailed
descriptions can be found in the Research Protocol
(Kollmorgen et al., 2022).
3.3 Impact of Gender
First, we investigate if gender has an impact on the
ratings of SUS, UMUX-LITE or UEQ-S for the four
products. Overall, only one person classified itself as
divers, and a small number of participants choose the
No answer option, which is why no meaningful
results could be derived for these categories.
Therefore, we concentrate on the differences between
male and female participants.
The percentage of male and female participants
for the studies is shown in Table 1 below.
Table 1: Distribution of male and female participants.
Gender
Netflix
N=97
PPT
N=89
Zoom
N=76
BBB
N=76
Male 55 % 74 % 50 % 54 %
Female 43 % 26 % 47 % 45 %
Table 2 shows the values of the three UX
questionnaires depending on gender. For the UEQ-S
we use the overall value, i.e. ignore for the moment
pragmatic and hedonic qualities.
Table 2: Impact of gender on the 3 UX scales. Range 0-100
for UMUX-LITE and SUS, from -3 to +3 for UEQ-S.
Quest. Gen Netf. PPT Zoom BBB
UMUX-
LITE
M 81.90 72.22 75.66 66.87
F 80.20 72.46 82.64 68.38
SUS M 84.40 69.62 73.36 69.82
F 81.90 73.70 82.64 70.81
UEQ-S M 1.08 0.20 0.73 0.26
F 1.00 0.41 1.07 0.58
Gender had only for Zoom a significant influence
on all three questionnaires (p < .05, t-test, two-sided).
Female participants tend to rate Zoom better than
male participants. This is true for the scores of all
three UX questionnaires and is therefore not just a
random effect. For the other products, there was no
significant influence of gender on the scores.
The difference in the ratings of Zoom and BBB is
quite interesting. Both products belong to the same
product category and support similar use cases. But
Zoom is rated much higher by females than by males
in all three UX scales, while such an effect cannot be
observed for BBB. A possible explanation is perhaps
that BBB is mainly used in an educational context,
while Zoom is a general video conferencing tool that
is used professionally and for private communication.
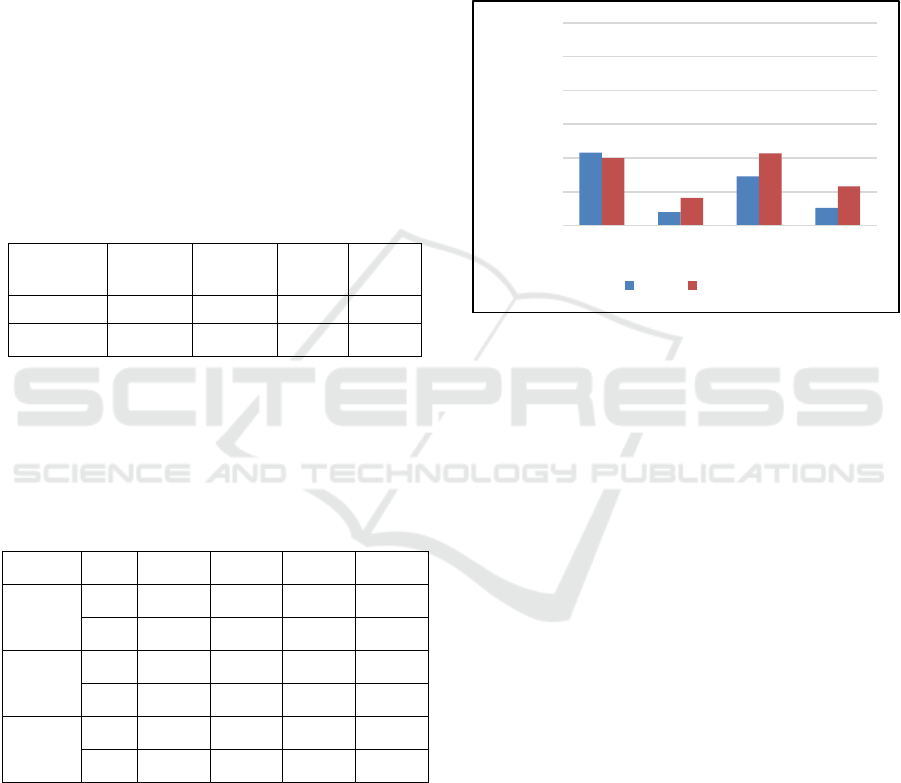
The UEQ-S scores depending on gender are
shown in Figure 1.
Figure 1: Impact of Gender on the UEQ-S scores. Range
from -3 to +3.
As can be seen, there are only small differences
between the gender ratings. This difference is only
significant for Zoom, but there is a slight tendency
that female participants give higher ratings, except for
Netflix (this is also true for the other two
questionnaires). Therefore, due to our medium
sample sizes, we cannot rule out that there is no effect
of gender on the ratings, but in each case the effect is
quite small.
3.4 Impact of Usage Frequency
The usage frequency can also have an influence on
the perception and evaluation of the UX. On the one
hand, the more frequently users actively engage with
the product of the categories considered, the more
features or advantages and disadvantages they can
identify.
On the other hand, they also adjust their behaviour
to avoid known usability problems, which may be
forgotten already when they evaluate the product. The
distribution of usage frequency on the ratings is
shown in Table 3. The percentage distribution for
Zoom, for example, is already determined by the type
of product (target group student).
0
0,5
1
1,5
2
2,5
3
Netflix PPT Zoom BBB
Scoring of the product
Male Female
WEBIST 2022 - 18th International Conference on Web Information Systems and Technologies
400
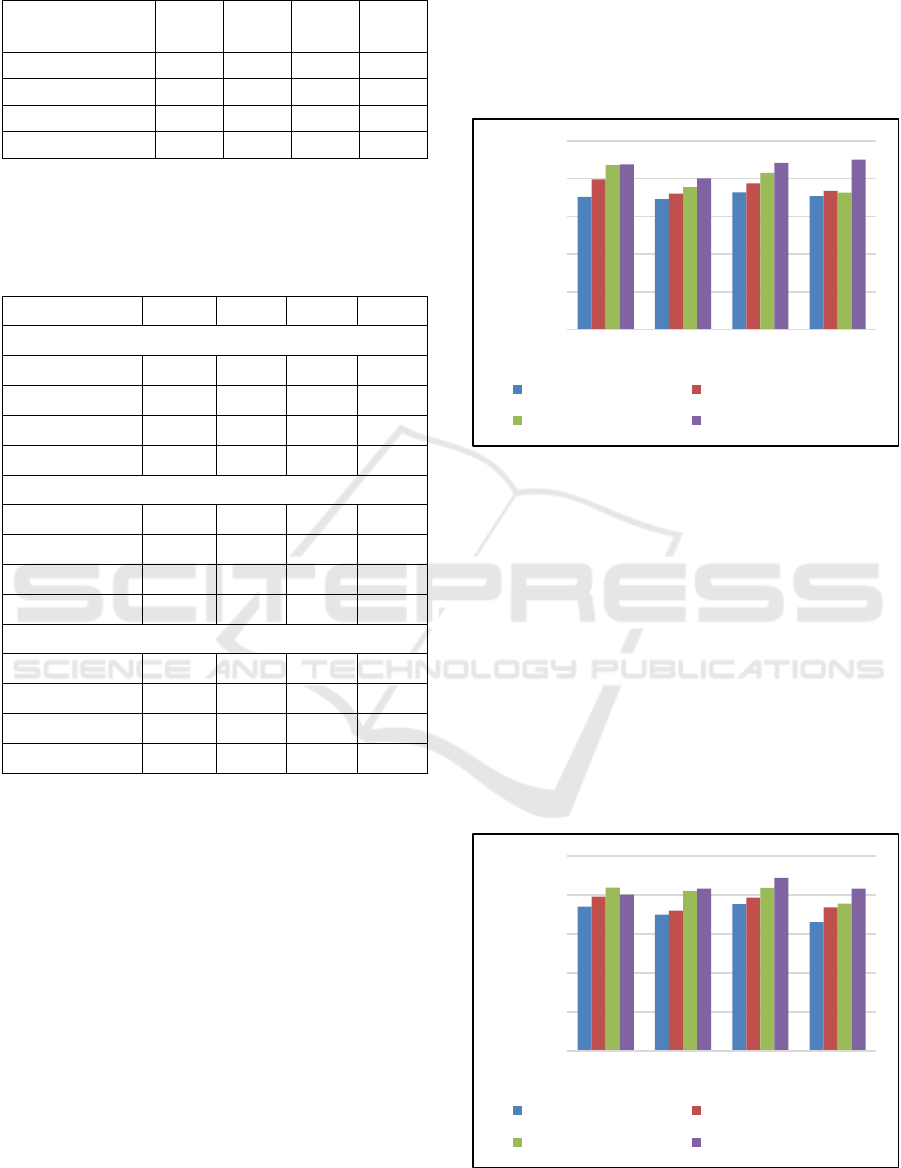
Table 3: Distribution of usage frequency.
Usage Frequency
Netflix
N=97
PPT
N=89
Zoom
N=76
BBB
N=76
Not very freq. 9% 58% 25% 41%
Sev. Times month 36% 31% 33% 29%
Sev. Times week 38% 8% 32% 28%
Daily basis 16% 2% 4% 3%
The usage frequency is also examined in Table 4,
again showing the values of the three questionnaires.
Table 4: Impact of usage frequency. Range 0-100 for
UMUX-LITE, and SUS; from -3 to +3 for UEQ-S.
Frequency Netflix PPT Zoom BBB
UMUX-LITE
Not very freq. 74.07 70.07 75.44 66.15
Sev. times month 79.29 72.02 78.67 73.75
Sev. times week 83.78 82.14 83.68 75.69
Daily basis 80.21 83.34 88.89 83.33
SUS
Not very freq. 70.28 69.02 72.63 70.70
Sev. times month 79.50 71.96 77.50 73.50
Sev. times week 87.16 75.36 82.92 72.50
Daily basis 87.50 80.00 88.33 90.00
UEQ-S
Not very freq. -1.88 0.18 0.68 0.35
Sev. times month 0.95 0.26 1.08 0.62
Sev. times week 1.20 0.54 0.82 0.69
Daily basis 1.38 0.81 1.54 1.00
As we can see, the more frequently a product of
these categories is used, the better is the UX
judgement in the questionnaires. Thus, we have a
clear effect in this case. This is not unexpected. If a
product shows good UX it will be used more
frequently. Conversely, over time the more frequent
users will be the ones with a better impression.
Figure 2 shows the SUS scores for the four
investigated products in dependency to the self-
reported usage frequency. Many of the differences are
relatively high, i.e., the impact on usage frequency on
the scale scores leads to meaningful differences. An
ANOVA shows that the frequency of usage had a
significant impact (p > .05) on the SUS scores for
Netflix and Zoom, on the UMUX-LITE scores for
Zoom and BBB, and for the UEQ-S score for Netflix
and BBB. The data of the SUS are shown in Figure 2.
Once again, it is clear that Netflix and Zoom
overall are rated better than PPT and BBB in all
categories of usage frequency. It is an interesting
observation that the ratings of all 4 products are
nearly the same by users who use the product not very
frequent. Of course, we must be a bit careful with
conclusions, since the values in some usage
categories are based on only a few data points.
Figure 2: Impact of usage frequency on SUS scores. Range
0-100.
As the data also show, the UEQ-S ratings vary
significantly depending on the usage frequency.
Users who deal with the respective product on a daily
basis rate it best by far. Those who do not use it
frequently rate it the worst. This is clear in the case of
Netflix: it is the only category which is rated below 0.
Only Microsoft PowerPoint does not show any
significant impact on UX metrics. This could be due
to the uniqueness of the product, as pupils and
students are often only recommended PPT and there
is little experience with other presentation tools.
However, it is clear that usage frequency impacts
product UX ratings, which is visible in Figure 3.
Figure 3: Impact of usage frequency on UMUX-LITE
scores. Range 0-100.
0
20
40
60
80
100
Netflix PPT Zoom BBB
Scoring of the product
Not very frequent Several times a month
Several times a week On a daily basis
0
20
40
60
80
100
Netflix PPT Zoom BBB
Scoring of the product
Not very frequent Several times a month
Several times a week On a daily basis
Impact of Usage Behaviour on the User Experience of Netflix, Microsoft Powerpoint, Bigbluebutton and Zoom
401
3.5 Impact of Knowledge
It can also be assumed that the knowledge of the range
of products could have an influence on the evaluation.
Similar to the higher frequency of use, the advantages
and disadvantages also become clearer with better
knowledge of the products. The distribution of the
self-reported knowledge is shown in Table 5.
Table 5: Distribution of self-reported product knowledge.
Know-
ledge
Netflix
N=97
PPT
N=89
Zoom
N=76
BBB
N=76
Low 7 % 9 % 20 % 25 %
Medium 22 % 51 % 41 % 45 %
High 54 % 35 % 34 % 20 %
Excellent 19 % 6 % 5 % 1 %
Table 6 shows the UX ratings of the three
questionnaires depending on the stated knowledge.
Table 6: Distribution of self-reported product knowledge.
Range 0-100 for UMUX-LITE, and SUS; from -3 to +3 for
UEQ-S.
Knowledge Netflix PPT Zoom BBB
UMUX-LITE
Low 75.00 66.63 67.78 61.84
Medium 78.97 68.15 76.61 73.04
High 79.65 77.69 83.33 76.67
Excellent 87.50 86.67 95.84 83.33
SUS
Low 77.08 63.12 68.33 66.32
Medium 77.74 68.56 74.84 73.01
High 82.36 74.03 82.98 77.67
Excellent 92.36 81.00 91.25 80.00
UEQ-S
Low 0.27 0.22 0.40 0.36
Medium 0.99 0.02 0.79 0.46
High 0.97 0.56 1.10 0.67
Excellent 1.43 0.53 1.12 0.50
As in the previous observations, it is clear that
Netflix and Zoom are rated better overall.
Furthermore, the previous assumption is confirmed
once again: the better the participants rate their
knowledge of the respective product, the better they
also rate the product itself on average. At least there
is a clear trend visible for all three questionnaires.
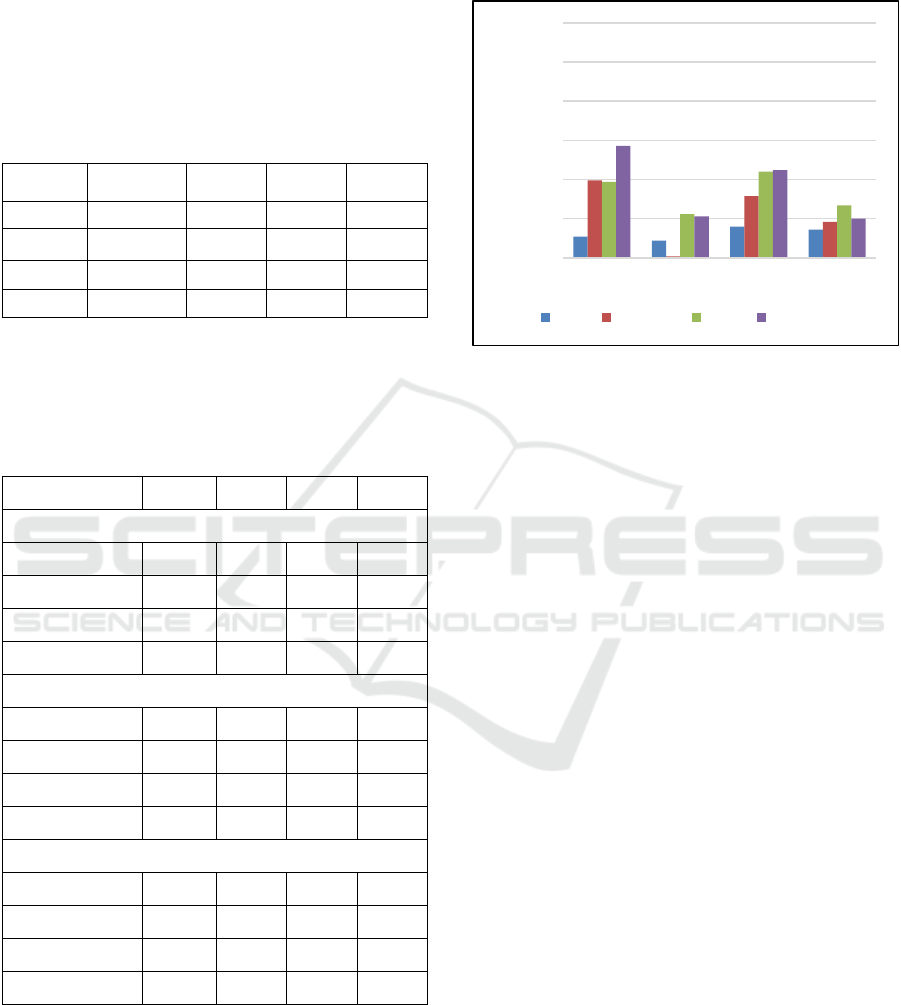
This is also shown graphically for the UEQ-S ratings
in Figure 4.
Figure 4: Impact of knowledge on the UEQ-S scores. Range
from -3 to +3.
A variance analysis (ANOVA) reveals that there
is only for BBB a significant influence of knowledge
on the ratings at the 5% level. This can be due to the
fact that the effect size is relatively small, and our
sample size therefore does not allow to detect a
significant effect. That is why we can state that there
is at least a trend visible, but no significant effect.
3.6 Impact of Duration of Use
It can be assumed that users who have been using a
product of these categories for a long time also know
it better. This does not mean that they know all
functions and can operate it perfectly, but that they
are able to find their way around the product
according to their needs. Vice versa, users who have
been using a product for a short time may not know
how to reach their goal. It is necessary to investigate
what influence the duration of Use has on the ratings.
Table 7 shows the distribution of the participants over
the categories. This distribution is different for the
products, so a comparison of the impact is hardly
possible. In addition, since only a few participants
have been using the products for less than a year,
these were combined into the "Shorter" category.
Since no person has used BBB for longer than 5 years,
no relevant statement can be made here.
0
0,5
1
1,5
2
2,5
3
Netflix PPT Zoom BBB
Scoring of the products
Low Medium High Excellent
WEBIST 2022 - 18th International Conference on Web Information Systems and Technologies
402
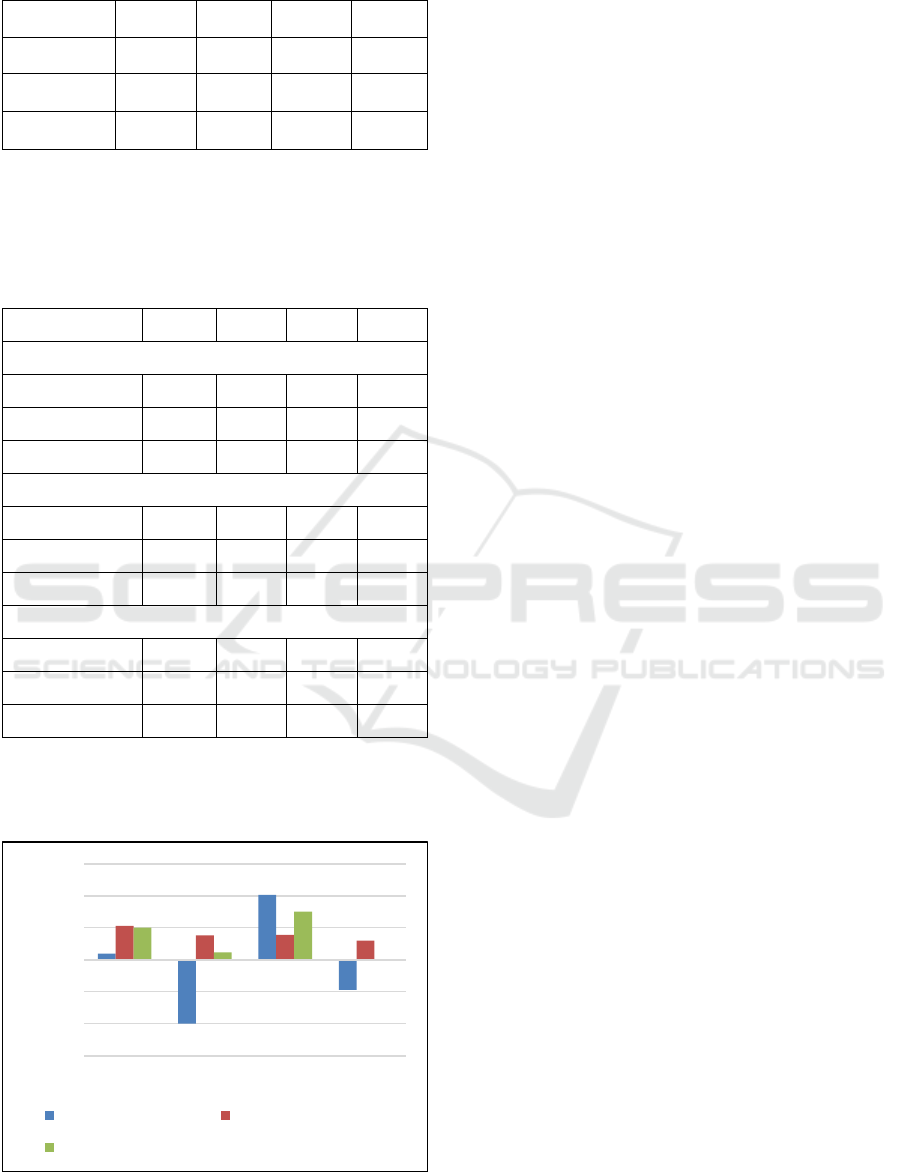
Table 7: Impact of duration of use.
Duration of
Use
Netflix
N=97
PPT
N=89
Zoom
N=76
BBB
N=76
Shorter 2 % 1 % 8 % 39 %
More than a
yea
r
64 % 10 % 88 % 55 %
More than 5
years
33 % 88 % 3 %
Table 8 shows the ratings of the three different
UX metrics.
Table 8: Influence of the duration of use on the UX ratings.
Range 0-100 for UMUX-LITE, and SUS; from -3 to +3 for
UEQ-S.
Knowledge Netflix PPT Zoom BBB
UMUX-LITE
Shorter 70.84 33.33 85.42 33.33
More than a year 81.18 81.48 78.86 78.17
More than 5 years 80.47 71.79 83.34
SUS
Shorter 82.50 27.50 84.38 53.12
More than a year 82.54 75.28 77.87 76.55
More than 5 years 84.06 70.77 67.50
UEQ-S
Shorter 0.19 -1.00 2.03 -1.06
More than a year 1.06 0.76 0.78 0.60
More than 5 years 1.00 0.23 1.50
In contrast to the frequency of use and the
knowledge of the product, we can see no clear trend
here, as shown in Figure 5.
Figure 5: Impact of duration of use on the UEQ-S scores.
Range from -3 to +3.
On the one hand, this is due to the fact that the
“Shorter” category only contains a small amount of
data, which means that this cannot be clearly
interpreted. On the other hand, the other categories
also have a different number of respondents
depending on the product, which is why the results
are unstable. For this reason, further interpretations of
the data should be refrained from. Despite the
assumption, it is not clear whether the duration of use
has an influence on the evaluation of the UX of the
products.
3.7 Evaluation of Influencing Factors
Gender has, with the exception of one product, no
significant influence on the scores of the UX scales.
As expected, however, the data from our study show
that influences by usage frequency, and knowledge
are likely. The usage frequency has been proven to be
the most relevant influencing factor. Here we found
some effects that proved to be significant even with
moderate sample sizes. Although in most cases no
significant influences could be demonstrated for the
other two factors, which can be due to the small
sample size and the unequal distribution of the
respondents over the existing categories, there was at
least a trend in the data visible.
4 IMPACT ON HEDONIC AND
PRAGMATIC QUALITY
The assumption, which has already become visible to
some extent in the previous sections, is that users
have different demands on the user experience of the
products depending on the use case.
It can be assumed that for products such as PPT,
which are used for work purposes, the focus is
particularly on the fulfilment of pragmatic goals. As
part of the user experience, these also coincide with
the demands on usability.
Furthermore, in the case of products that are
primarily intended for private use, such as Netflix,
hedonic factors like fun or beauty should not be
neglected (Hassenzahl, 2001). These products are
used voluntarily in the free time and are rarely
predefined by other people such as employers. This
can be seen, for example, when looking at the
knowledge of Netflix. About one fifth of all
respondents said they had excellent knowledge about
this product and also rated it high.
However, it is unclear, for example, how the
pragmatic and hedonic quality for Zoom is perceived,
-3
-2
-1
0
1
2
3
Netflix PPT Zoom BBB
Scoring of the products
Shorter For more than a year
For more than 5 years
Impact of Usage Behaviour on the User Experience of Netflix, Microsoft Powerpoint, Bigbluebutton and Zoom
403

since this tool is also used for private video calls in
addition to work purposes. In the following, we will
therefore examine how users perceived the pragmatic
and hedonic quality of the four products.
As already explained, usability questionnaires
such as SUS or UMUX primarily measure usability
and therefore pragmatic quality. For the four products
Netflix, PPT, Zoom and BBB, it is therefore
interesting to consider how other questionnaires
besides the UEQ classify pragmatic quality and
whether this is perceived similarly across
questionnaires.
Table 9 evaluates the scale values for the four
products in terms of usability and pragmatic quality
as well as hedonic quality. The first four items of the
UEQ-S were considered for the PQ, the last four
items for HQ.
The UEQ-S ratings were also converted into
percentages to enable better comparability with the
scale values of the SUS and UMUX-LITE, which lie
between 0 and 100. According to simple percentage
calculation, the values were first scaled to 0-6, and
then multiplied by 100 and divided by 6.
As the scale values show, Netflix was rated best
overall, followed by Zoom. Only with regard to the
UEQ-S and its evaluation of pragmatic quality in
specific, Zoom was rated best. BBB and PPT are not
rated well but are still rated in the midfield.
In the Video Conference Tool product category,
Zoom is rated significantly better (p > .05) than BBB
on average. The reason given by 8 out of 19 open
responses is that some functions (e.g. volume control
of users) are missing.
It can be assumed here that Microsoft PowerPoint
is not seen as simple enough to achieve goals due to
its complex functionality. The many different
functions
according to 21 out of a total of 37 open
Table 9: Scale values. Range 0-100. The UEQ-S scores
were converted for better comparability.
Product Netflix PPT Zoom BBB
UMUX-
LITE
80.67 72.28 77.85 67.54
SUS 82.89 70.67 76.81 70.36
UEQ-S 67.00 54.17 64.00 56.67
UEQ-S
PQ Scale
70.17 66.33 75.17 68.17
UEQ-S
HQ Scale
63.67 42.00 52.83 45.17
responses to the survey on PPT are too extensive,
complicated or not logical, such as creating your own
slide designs.
This is consistent with the observations made in
the previous sections.
All four products fundamentally meet the needs of
users in achieving their goal. Netflix and Zoom show
a better usability through simpler and more complete
functions. This is also shown when comparing the
UMUX-LITE and SUS values with the PQ Scale of
the UEQ-S (see Table 9). The values show only minor
differences. It seems that the pragmatic quality
measured with the UEQ-S is strongly related to the
values of the SUS and UMUX.
In terms of hedonic quality, it is again clear that
Netflix is rated also best of all four products. As
already explained, hedonic quality is particularly
relevant for products that are used for leisure
activities. Thus, all products are overall rated bad in
their hedonic quality. This is also a typical effect. In
terms of HQ, the UEQ-S roughly asks how much fun
the product is and how original it is. However, since
all four products studied have been on the market and
used for some time, they are classified as less original.
For this reason, revisions to the design are often used
in practice. This is one reason why the HQ scores
significantly worse in a direct comparison with the
PQ. This can also be seen in the following Figure 6.
In Section 3 we showed that usage frequency has
a clear influence on product ratings. For this reason,
this external influencing factor is once again
considered specifically in relation to pragmatic and
hedonic quality, which is the purpose of Figure 6. As
the Figure 6 shows, similar to the observation of the
overall UEQ-S ratings, a trend can be seen
specifically for pragmatic quality. This trend could
also be demonstrated for Netflix and Zoom in the
ANOVAs (p > .05).
Netflix's Hedonic Quality rating is again in line
with expectations: Users who use the product more
often rate hedonic quality higher and vice versa.
However, the situation is different for the other three
products. No clear trend is discernible for them. This
is also shown in the ANOVAs, because only for
Netflix was an impact of the usage frequency for the
hedonic quality at the 5% level proven. Overall,
nevertheless, all reviews of the products are poor in
terms of hedonic quality. For PowerPoint, the ratings
are in the negative range regardless of the frequency
of use.
In summary, it is clear that the UEQ-S can be
clearly distinguished into PQ and HQ. While all three
questionnaires found similar values for the PQ, no
clear trend is discernible for the HQ. As can also be
seen from the Research Protocol (Kollmorgen et al.,
2022), similar results are obtained for the other
external influencing factors presented.
WEBIST 2022 - 18th International Conference on Web Information Systems and Technologies
404
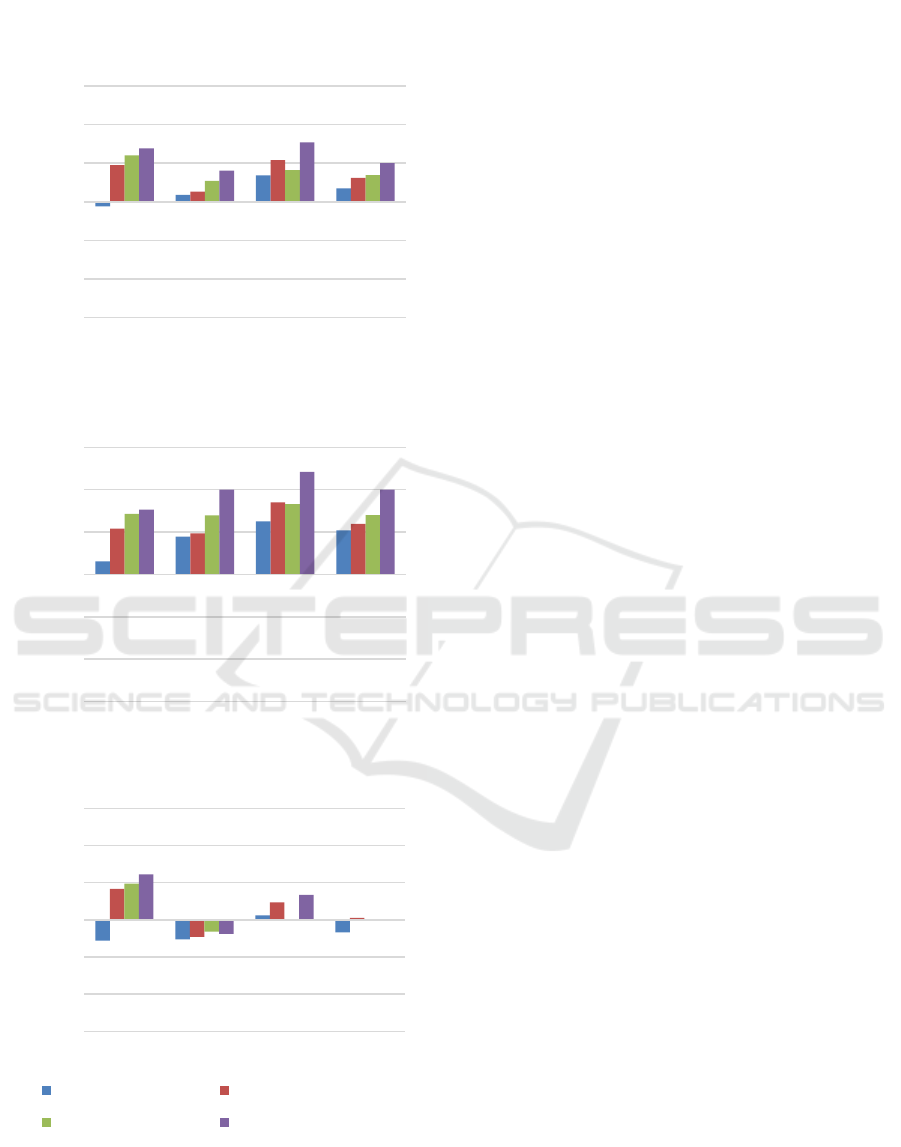
Figure 6: Impact of usage frequency on UEQ-S, PQ Scale
and HQ Scale. Range from -3 to +3.
5 CONCLUSIONS
Finally, the general results and conclusions of our
studies will be assessed.
It is clear that Netflix is rated best overall
concerning UX, regardless of the questionnaires
considered. Zoom is clearly rated lower as Netflix, but
still higher than BBB and PPT, which show relatively
similar ratings (see Table 9).
The difference of Zoom and BBB is quite
interesting. Both products support similar use cases,
but the focus of BBB is more to support education in
universities, while Zoom is also used often for private
video conferences. This was also relevant in
Pandemic, when remote video calls replaced in
person events due to lockdowns. BBB, on the other
hand, is often a mandatory software depending on the
university and employer. Nevertheless, BBB
contained only a few participants who are very
experienced in using the product, even though it has
been on the market longer than its competitor Zoom.
This is maybe an explanation why especially the
rating of the hedonic quality of Zoom is much higher
that the corresponding rating of BBB.
Microsoft PowerPoint as a tool to create efficient
presentations in business and in educational settings
has of course a focus on pragmatic quality.
Concerning the UEQ-S we see that the rating
concerning PQ is not bad, but the rating concerning
HQ is not satisfying. Of course, PPT is a much more
complex product than the three other investigated
products. This is also reflected in the observation that
most users (87.64%) have been using PPT for more
than 5 years, but still only a few rated their knowledge
as excellent (5.62%). So, the high complexity of this
product is maybe the force behind the relatively low
HQ and medium PQ rating.
In terms of influencing factors, gender was
initially found to have no significant effect on the UX
ratings. The usage frequency showed a significant
influence on the respondents' perceived usability but
not so much on the hedonic quality for all products.
Self-reported product knowledge also showed an
impact on the usability related scores (UMUX-LITE,
SUS, PQ), but not on hedonic quality. The duration
of use seems to have not a big impact on the ratings,
but here the products differ with respect of the
average duration of use and thus some categories
contained not much data. Overall, the article can be
seen as a methodological example of how influencing
factors can be considered in usability research and
future work on this would be worth looking at.
In summary, all products used in the study exhibit
acceptable ratings concerning pragmatic quality.
-3
-2
-1
0
1
2
3
Netflix PPT Zoom BBB
Scoring of the product
Impact of Usage Frequency
on UEQ-S (Overall score)
-3
-2
-1
0
1
2
3
Netflix PPT Zoom BBB
Scoring of the product
on Pragmatic Quality
-3
-2
-1
0
1
2
3
Netflix PPT Zoom BBB
Scoring of the product
on Hedonic Quality
Not very frequent Several times a month
Several times a week On a daily basis
Impact of Usage Behaviour on the User Experience of Netflix, Microsoft Powerpoint, Bigbluebutton and Zoom
405

However, the situation is different with the hedonic
quality. Netflix also showed reasonable ratings
concerning hedonic quality, which is of course
important for a product mainly used for fun and
leisure activities. The other three products scored
clearly worse concerning hedonic quality. These
products are of course more task-related, i.e. their
design goals are of course more related to the
pragmatic quality or usability.
The studies also showed that the used
measurement instrument is important to draw the
right conclusions from results. If hedonic quality is an
important success factor for a product it is important
to measure this with a dedicated scale. If you use a
purely usability centric method like SUS or UMUX-
LITE, differences in hedonic quality are invisible in
your results.
Finally, some limitations of our studies must be
mentioned. First, the available number of respondents
was relatively low in our studies. This is especially
problematic, since these respondents did not
distribute equally over all categories of the
investigated influencing factors, so some results are
based on only a small number of responses. Of
course, the results should be confirmed with a wider
range of products as well.
REFERENCES
Brooke, J. (1996). SUS-A quick and dirty usability scale. In
Jordan, P., Thomas, B. (Ed.). Usability Evaluation in
Industry, 189(194). London: Taylor & Francis. pp. 4-7.
Davis, F. (1986). A technology acceptance model for
empirically testing new end-user information systems -
Theory and results. PhD Thesis, Massachusetts Inst. of
Technology.
Finstad, K. (2010). The Usability Metric for User
Experience. In Interacting with Computers 22(5). pp.
323-327. DOI 10.1016/j.intcom.2010.04.004
Hassenzahl, M. (2001). The Effect of Perceived Hedonic
Quality on Product Appealingness. In International
Journal of Human-Computer Interaction 13(4). pp.
481-499. DOI 10.1207/S15327590IJHC1304_07
Hassenzahl, M. (2008): Towards an experiential
perspective on product quality. In Proceedings of the
20th International Conference of the Association
Francophone d'Interaction Homme-Machine on - IHM
'08, Metz, France: Association for Computing
Machinery. pp. 11-15. DOI 10.1145/1512714.1512717
Hassenzahl, M., Diefenbach, S., Göritz, A. (2010): Needs,
affect, and interactive products - Facets of user
experience. Interacting with Computers 22(5). pp. 353-
362. DOI 10.1016/j.intcom.2010.04.002
Karapanos, E., Hassenzahl, M., Martens, J.-B. (2008). User
experience over time. In CHI EA ’08 26
th
Annual ACM
Conference on Human Factors in Computing Systems.
Florency, Italy: Association for Computing Machinery,
Inc. pp. 3561-3566. DOI 10.1145/1358628.1358891
Kollmorgen, J., Meiners, A.-L., Schrepp, M. &
Thomaschewski, J. (2021). Ermittlung relevanter UX-
Faktoren je Produktkategorie für den UEQ+. In
Wienrich, C., Wintersberger, P. and Weyers, B. (Ed.).
Mensch und Computer 2021 - Workshopband. Bonn:
Gesellschaft für Informatik e.V. DOI
10.18420/muc2021-mci-ws01-362
Kollmorgen, J., Schrepp, M., Thomaschewski, J. (2022).
Protocol for A Comparison of three short User
Experience Questionnaires. DOI
10.13140/RG.2.2.32773.01760
Laugwitz, B., Schrepp, M., Held, T. (2008). Construction
and evaluation of a user experience questionnaire. In
Holzinger, A. (Ed.). USAB 2008, LNCS 5298. pp. 63-
76. DOI 10.1007/978-3-540-89350-9_6
Lewis, J. R. (2018). The System Usability Scale: Past,
Present, and Future. In International Journal of
Human–Computer Interaction 34(7). pp. 577-590. DOI
https://doi.org/10.1080/10447318.2018.1455307
Meiners, A.-L., Kollmorgen, J., Schrepp, M.,
Thomaschewski, J. (2021). Which UX Aspects Are
Important for a Software Product? In Schneegass, S.,
Pfleging, B. and Kern, D. (Ed.). Mensch und Computer
2021. MuC '21: Mensch und Computer 2021. Ingolstadt
Germany, 05 09 2021 08 09 2021. New York, NY, USA:
ACM. pp. 136–139. DOI 10.1145/3473856.3473997
Schrepp, M., Hinderks, A., & Thomaschewski, J. (2017).
Design and evaluation of a short version of the user
experience questionnaire (UEQ-S). In International
Journal of Interactive Multimedia and Artificial
Intelligence 4 (6). pp. 103-108. DOI
10.9781/ijimai.2017.09.001
Schrepp, M., Thomaschewski, J. (2019). Design and
Validation of a Framework for the Creation of User
Experience Questionnaires. In International Journal of
Interactive Multimedia and Artificial Intelligence, Vol.
5, No. 7. pp. 88-95. DOI 10.9781/ijimai.2019.06.006
Schrepp, M. (2021). User Experience Questionnaires: How
to use questionnaires to measure the user experience of
your products? KDP, ISBN-13: 979-8736459766.
von Wilamowitz-Moellendorff, M., Hassenzahl, M., Platz,
A. (2007). Veränderung in der Wahrnehmung und
Bewertung interaktiver Produkte. In Gross, T. (Ed.).
Mensch & Computer 2007: Interaktion im Plural.
München: Oldenbourg Verlag. pp. 49-58. Retrieved
from https://dl.gi.de/handle/20.500.12116/7273;jsessi
onid=C644DF5B586213C455E74EC0A4D4B835
Winter, D., Hinderks, A., Schrepp, M., Thomaschewski, J.
(2017). Welche UX-Faktoren sind für mein Produkt
wichtig? In Hess, S. and Fischer, H. (Ed.). Mensch und
Computer 2017 – Usability Professionals, Regensburg:
Gesellschaft für Informatik e.V. pp. 191-200. DOI
10.18420/muc2017-up-0002
WEBIST 2022 - 18th International Conference on Web Information Systems and Technologies
406
