
On-demand Electric Thrust Assistance for Muscle-powered Watercraft:
PADDELEC
Ren
´
e Budich
a
, Stephan Zipser, Jakob Doblaski and Jonas Seidel
Institute for Electric Mobility, University of Applied Sciences Dresden, Friedrich-List-Platz 1, Dresden, Germany
Keywords:
Paddelec, Demand-oriented Support, Electric Mobility, BEV, Canoe, SUP, Watercraft, Boat Simulation.
Abstract:
In the project PADDELEC, the implementation of an intelligent paddle (iPaddle) for controlling an electric
assisted canoe was realized. This paddle is able to record the paddle force F
B
of the blade with the help of
measurement technology integrated in the paddle shaft. The recording of the paddle stroke is used as a control
variable for operating an electric auxiliary drive in the boat. This is intended to provide on-demand thrust
assistance to the athlete, analogous to an electrified bicycle (pedelec). Existing drive solutions on motorized
boats offer the athlete the option of firmly specifying the desired thrust via a thrust lever or tiller. The paddelec
has the aim to provide intelligent and dynamic thrust assistance to the athlete as needed. This is intended to
preserve a natural driving feel, despite the auxiliary drive. A simulation model of the longitudinal dynamics
of canoes, was developed to investigate various assistance strategies. The models were validated by extensive
real driving tests. For this purpose, special hardware and software tools had to be created, which will be further
developed in the future. With the simulation and the evaluation of the practical testing, it could be shown that
thrust support for canoes can be very useful. The correct support strategy and support performance can vary
greatly depending on which water conditions the boat will use and the sporting activity, so there is still a need
for more research in this area.
1 INTRODUCTION
Water sports become more and more popular around
the world. For example, there has been a steady and
substantial increase in water touring by canoe (e.g. in
countries like Canada, Sweden and Germany). The
use of SUPs (Stand-Up-Boards) is also increasing for
some years now (BMWi, 2013).
In many cases water sports are performed at calm,
near-natural coastal, inland waters or low-current
rivers. However, it remains an outdoor sport where
wind and water current (and/or tide) often require a
powerful athlete.
To make this water sport available to a larger user
group, a battery-electric propulsion support is an ob-
vious suggestion. In case of bicycles, the idea of
battery-electric support is known as pedelec (pedal
electric cycle) and has been extraordinarily commer-
cially successful in Europe.
As known, real live disturbances like wind and
water current may affect the results of practical field
tests substantially. For this reason, physically oriented
models were developed to describe the response of a
a
https://orcid.org/0000-0002-9227-6834
boat to human and motor propulsion forces analyti-
cally. Model simulations in comparison to field tests
are also presented later.
The project was largely driven by engineering stu-
dents, who developed and implemented technical so-
lutions for measuring and controlling the boat-drives
and tested them in driving trials.
2 THE IDEA OF PADDELEC
The objective of the paddelec project is to develop a
system which provides on-demand electric thrust as-
sistance analogous to the established electric pedal as-
sistance for bicycles: the propulsion input of the user
is measured and supported electrically.
The basic principle of both technologies is identi-
cal.
1
In both cases, the mechanical input of the user
(or less technical the desire for assistance) is mea-
sured with a torque or force sensor. In the case of ca-
noeing, this is done with a paddle equipped with sen-
sors. The measurements are processed by a control
1
This is why the name analogy to the pedelec was de-
liberately chosen.
Budich, R., Zipser, S., Doblaski, J. and Seidel, J.
On-demand Electric Thrust Assistance for Muscle-powered Watercraft: PADDELEC.
DOI: 10.5220/0011380600003321
In Proceedings of the 10th International Conference on Sport Sciences Research and Technology Support (icSPORTS 2022), pages 17-28
ISBN: 978-989-758-610-1; ISSN: 2184-3201
Copyright
c
2022 by SCITEPRESS – Science and Technology Publications, Lda. All rights reserved
17
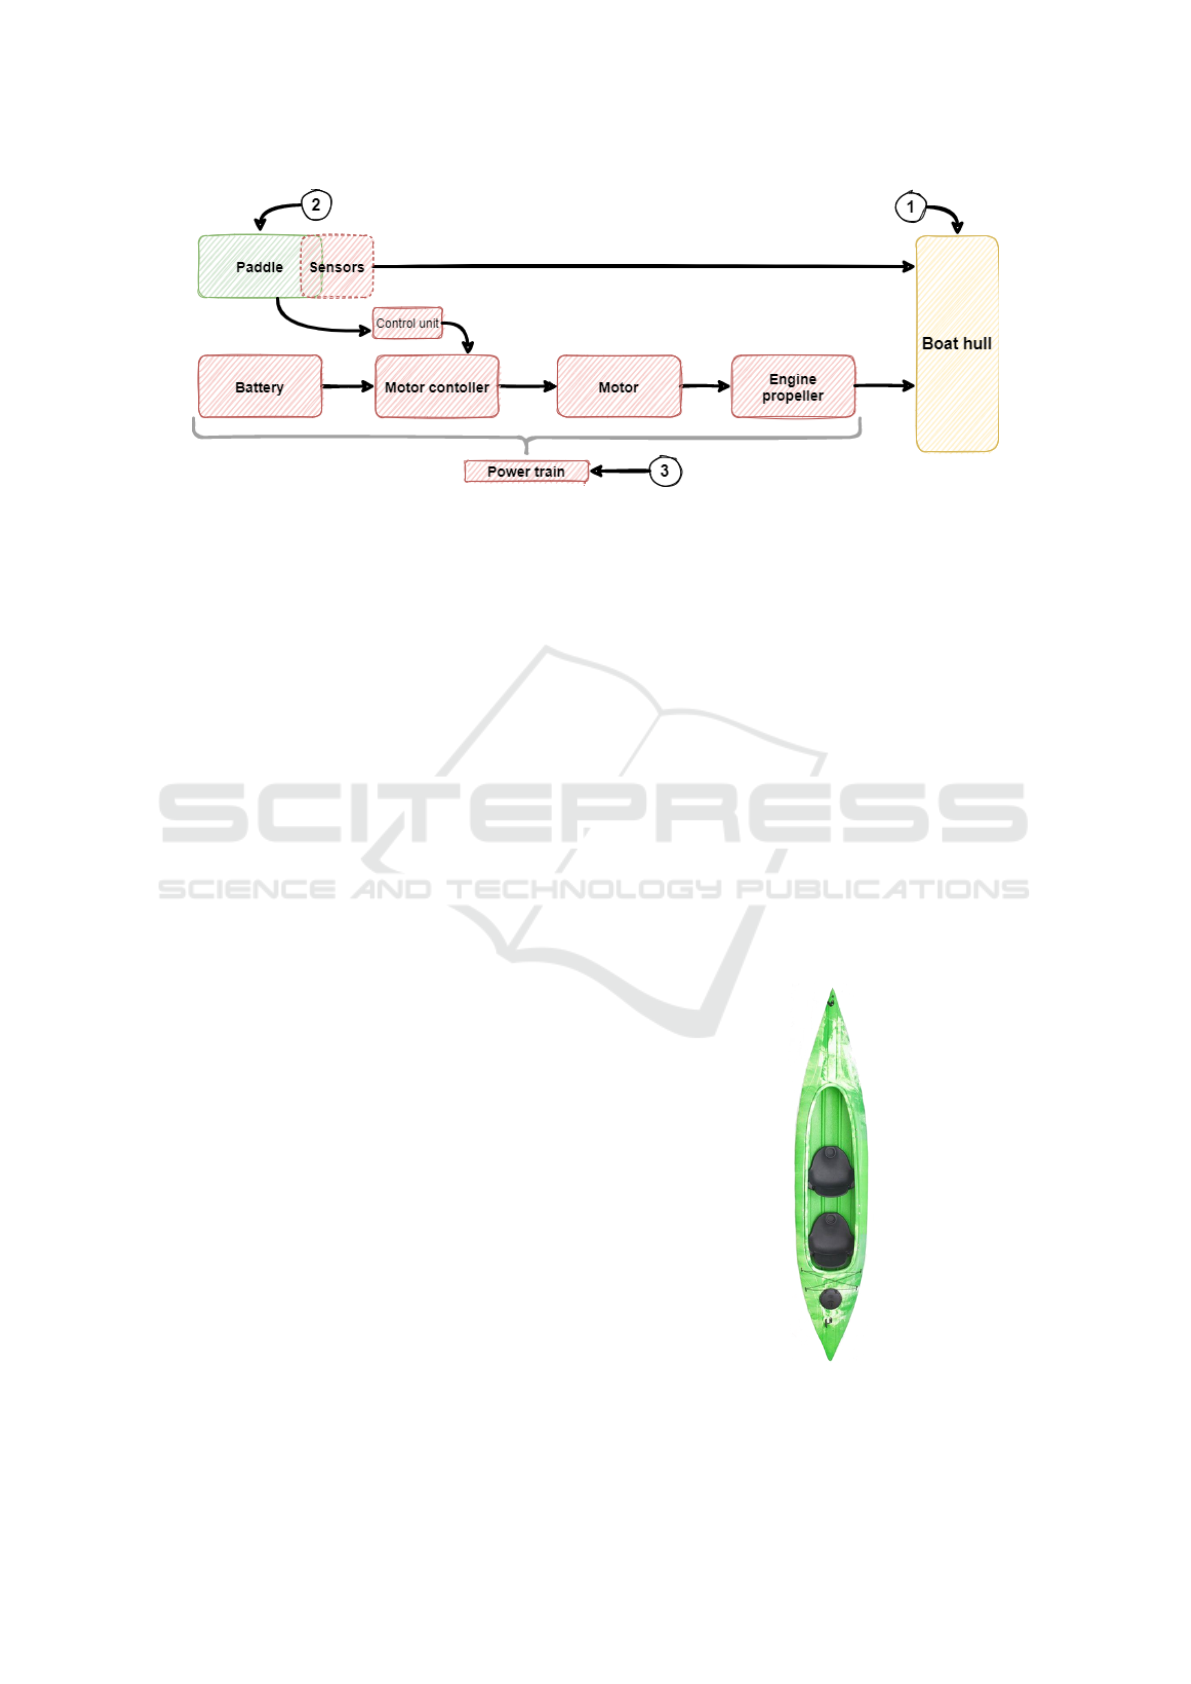
Figure 1: Block diagram of a paddelec.
unit, which drives the propulsion motor controller.
Depending on the amount of power applied, the ve-
hicle can thus be controlled by the driver.
The main focus is to provide a driving experience
that is as natural as possible without the use of addi-
tional peripherals such as a throttle.
In a canoe, the propulsion force or power is trans-
mitted with the help of a paddle. When paddling, the
paddle is pushed against the water to move the canoe
forward. To do this, the paddle blade is inserted into
the water and the paddle shaft is pushed against it.
Fig. 1 shows the basic structure with the aid of
a block diagram. The blocks shown in red are rep-
resenting additional components which are necessary
for implementing demand-oriented thrust support.
The paddle (Fig. 1 - ➁) exerts a force F on the hull
of the boat (Fig. 1 - ➀) so that it moves longitudinally
in the water. It should be noted here that the mea-
sured paddle force F
B
can never be used to 100 % for
propulsion (paddle force F
B
̸= propulsive force F
T
)
(see also section 5.2.2).
In order to realize demand-oriented support, the
force component in the direction of travel must be
recorded. This is done with a special measuring pad-
dle (iPaddle) which, among other things, has inte-
grated sensors and strain gauges for position and force
diagnostics. The recorded sensor values can be used
to control an electric motor dynamically. The battery,
motor controller, motor and propeller respectively jet
are parts of the power train unit, which can be de-
signed in different ways (Fig. 1 - ➂).
3 STRUCTURE OF THE TEST
VEHICLE
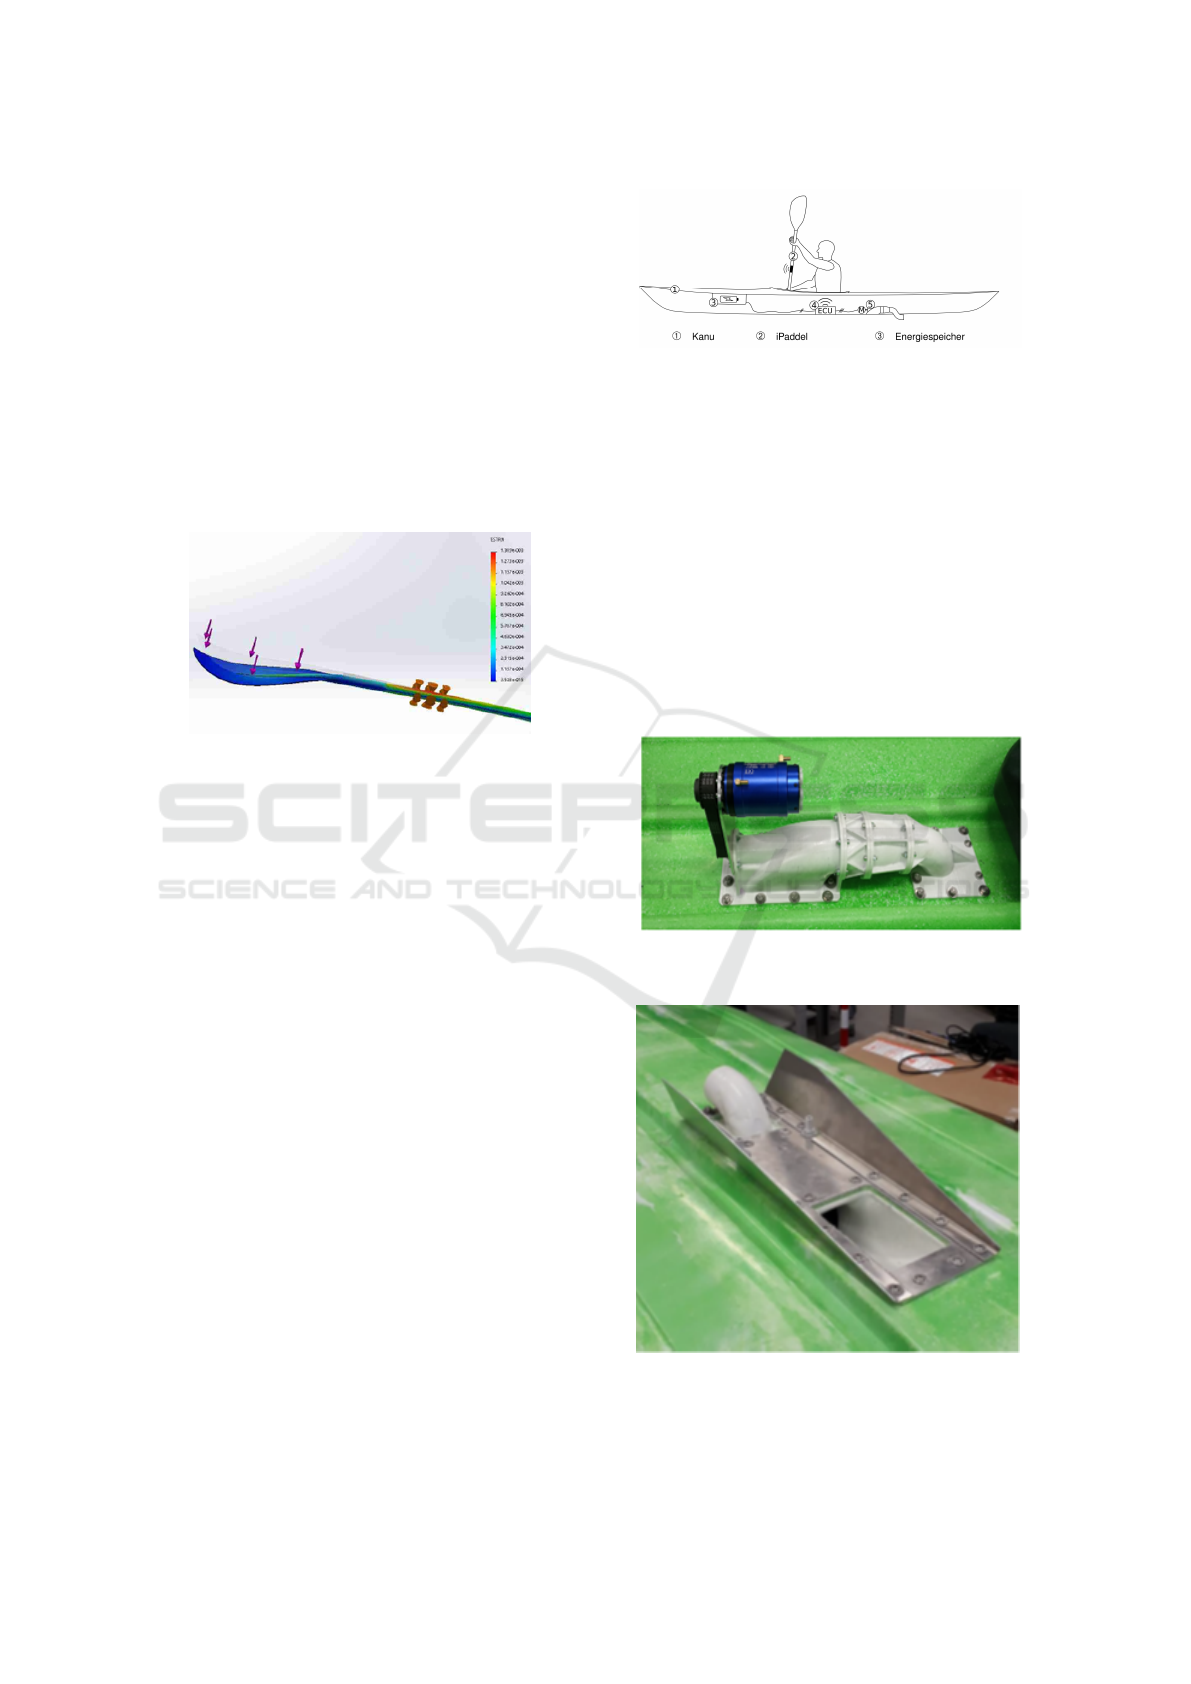
3.1 Boat Hull Grampus I
The Grampus I (a two-man kayak) from the Kaitts
company shown in Fig. 2 was used for the test setup.
The hull is made entirely of plastic, which makes
the boat very robust. This also makes it easy to imple-
ment modifications. The kayak has a wide hull cross-
section, which provides high stability against tipping
on the water and increased safety during test runs. In-
side there is enough space for a traction battery, con-
trol unit and measurement equipment. The rear part
of the kayak is sealed off watertight, allowing water-
sensitive components and measurement technology to
be accommodated via a hatch.
Figure 2: Boat hull - Grampus I (Kaitts Ltd., 2022).
icSPORTS 2022 - 10th International Conference on Sport Sciences Research and Technology Support
18
3.2 iPaddle - Measuring Paddle
Fig. 3 shows a part of a classic double paddle typi-
cally used in popular sports. The developed iPaddle is
equipped with force and position sensors and a wire-
less data transmission to the control unit.
The tensile force applied by the paddler causes
a deformation of the paddle shaft. This bending is
detected by a strain gauge and transmitted to the
ADC (analog digital converter) as an electrical volt-
age change. The ADC amplifies the signal and con-
verts it into a digital signal, which is transmitted to
the control unit in the boat (Dr. Budich and Dabrazzi,
2020).
Figure 3: FEM analysis of the measuring paddle (H
¨
ase,
2020).
For the application of the strain gauges on the
paddle, the area of highest stress should be selected.
Therefore, the double paddle was statically loaded
and then examined. The resulting stress curve over
the paddle shaft was calculated before using a FE cal-
culation (Finite elements method). It can be seen that
the maximum bending moments and thus the maxi-
mum tensile and compressive stresses lie in the area
of the grip point closest to the paddle blade (Fig. 3).
In order to determine all forces correctly, an exact
position measurement is required, which is currently
still under development.
For an initial estimate, it is sufficient to use a pad-
dle factor to determine the propulsive force F
T hrust
(F
T
) from the measured force F
Blade
(F
B
).
In further development we can use the measured
paddle angle α to do the correction more accurately
(see equation 1).
F
T
(α) = F
B
· K(α) (1)
3.3 Power Train
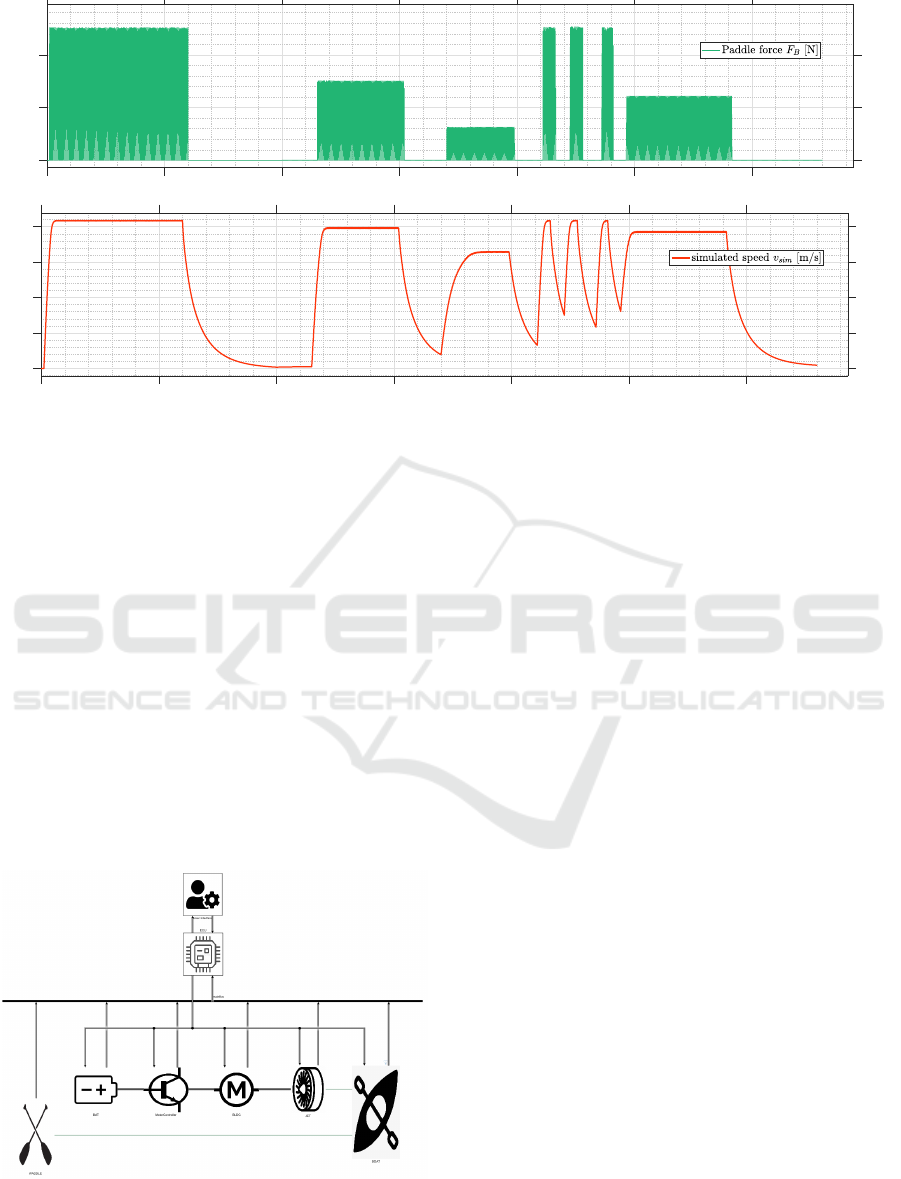
The basic structure of the paddelec is shown in Fig. 4.
The structure consists of the components: Boat body
(canoe) ➀, iPaddle ➁, battery ➂, control unit ➃ and
the drive unit ➄ (e.g. water jet drive).
Figure 4: Basic structure paddelec (P
¨
oschmann, 2020).
The electric auxiliary drive generates the desired
additional thrust assistance through appropriate con-
trol. A waterjet propulsion system is favored as the
drive unit because, unlike a propeller, it can be easily
and safety integrated into the hull of the boat. It is also
assumed to have a lower impact on the environment.
The waterjet drive for the test vehicle is made up
of several individual components. All components
were designed for additive manufacturing and 3D
printed from polylactide plastic. The waterjet propul-
sion system is screwed to the fuselage and sealed us-
ing sealing compound. Fig. 5 shows the designed jet
drive in installation position, Fig. 6 the underside of
the hull with outlet opening and protective fins.
Figure 5: Constructed jet drive in installation position with
motor and belt drive (Hauptmann, 2020).
Figure 6: Bottom of the fuselage with protective fins and
deflection of the outlet (Hauptmann, 2020).
In addition, investigations were carried out with
On-demand Electric Thrust Assistance for Muscle-powered Watercraft: PADDELEC
19
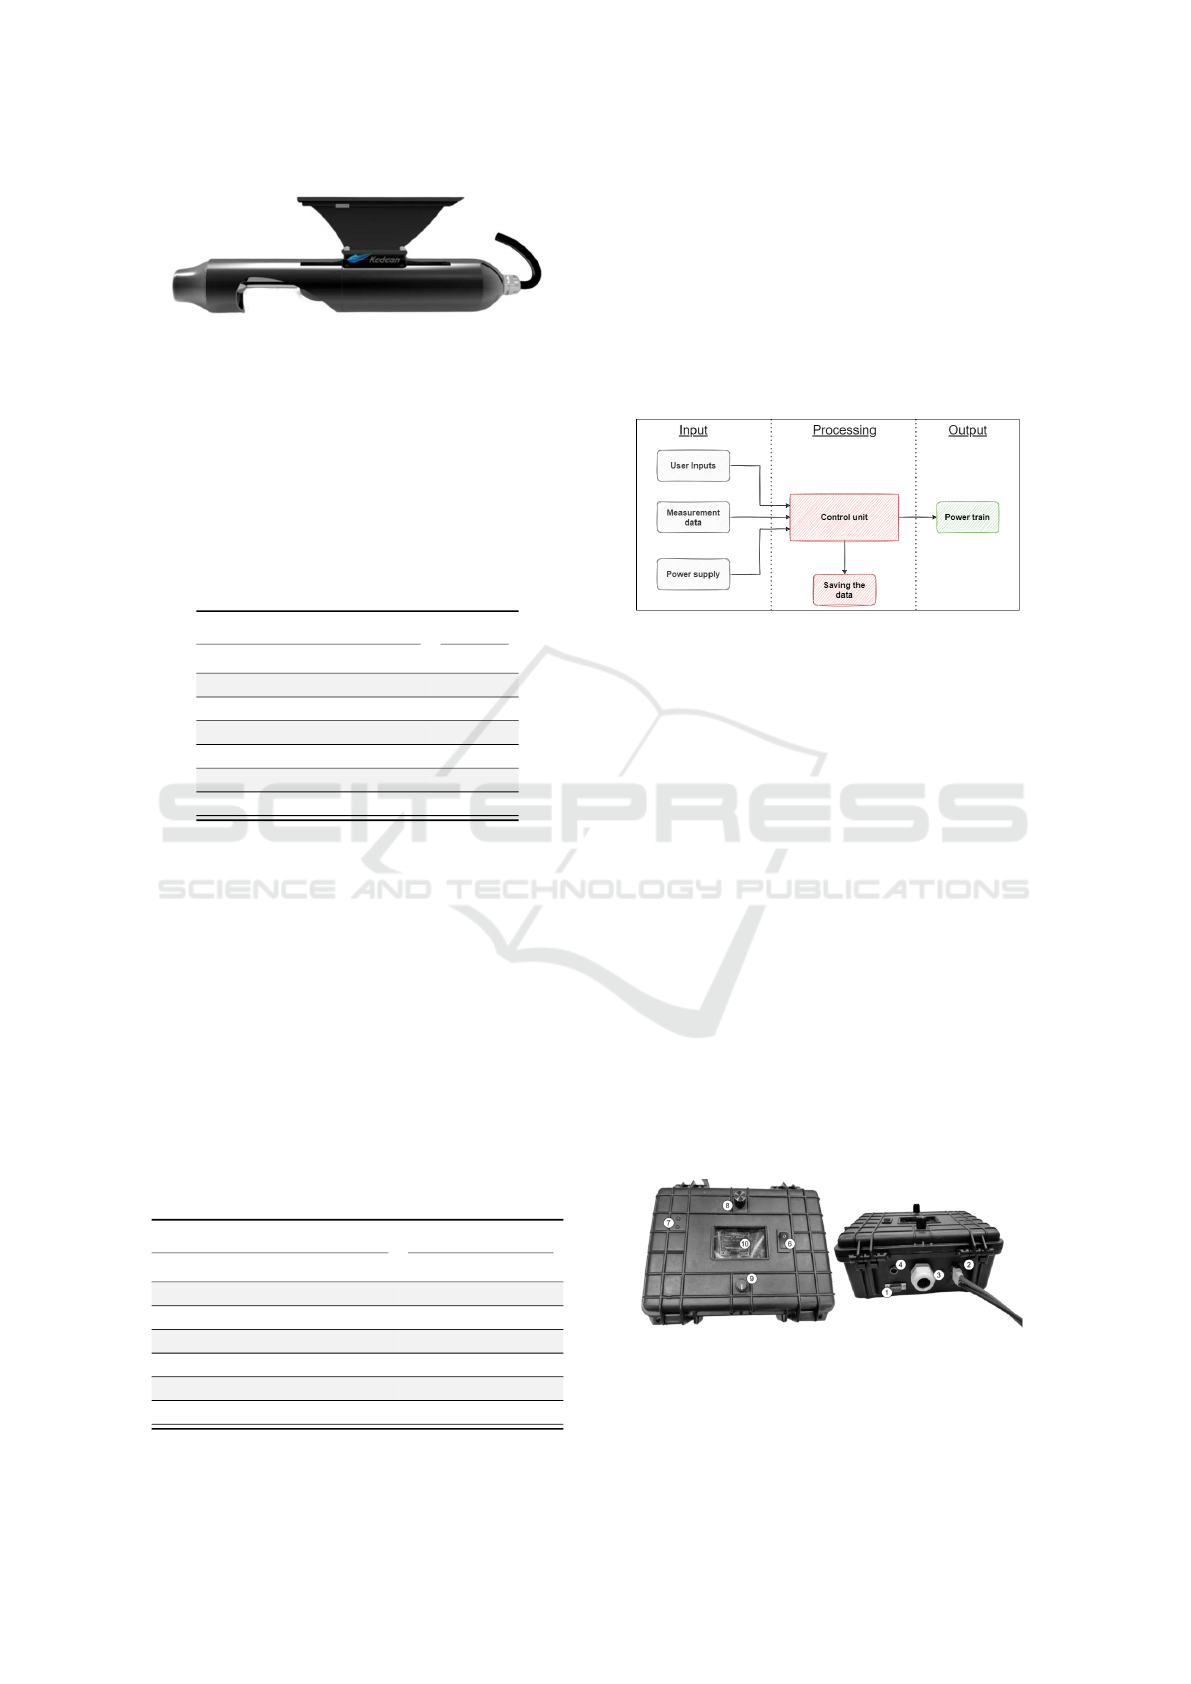
Figure 7: KDN-W703000 (Kedean, 2022).
a commercial drive solution (KDN-W703000) from
Kedan (Fig. 7). A brushless DC motor is used here
as the electric machine, while an impeller is used as
the drive. These two components are installed in an
aluminum housing as a combination. By using an im-
peller, the risk of injury is minimized in contrast to a
propeller. Table 1 lists the available technical data for
the drive.
Table 1: Technical data Kedean motor (Kedean, 2022).
technical characteristics values
max. operating voltage 50 V
max. continuous current 75 A
max. power 4000 W
max. thrust 240 N
length 401 mm
weight 2.5 kg
impeller diameter 60 mm
3.4 Traction Battery
A battery solution from Aentron Energy Solutions
was chosen to supply the system with energy. The
company specializes in energy storage systems for the
maritime sector. Important characteristics are shown
in table 2.
The battery has an integrated battery management
system (BMS), which provides overcharge and deep
discharge protection, as well as temperature moni-
toring. Its robust aluminum housing and protection
against dust and water make it a good solution for car-
rying out the measurement runs.
Table 2: Technical data battery (Aentron, 2022).
technical characteristics values
capacity 20.3 Ah
energy 1023 Wh
continuous discharge power 3000 W (@ 60 A)
nominal voltage 50.4 V
operating voltage 42 V- 56 V
weight 9 kg
protection class IP66
3.5 Electronic Control Unit - ECU
The developed control unit is based on an Arduino
environment. The ECU acquires measurement data,
processes it and sends corresponding signals to a mo-
tor controller. The necessary software algorithms
were implemented with Matlab Simulink. Its also
possible to log sensor data. The mode of operation
is shown schematically in Fig. 8.
Figure 8: Basic scheme of ECU (Doblaski, 2021).
3.6 Housing and Peripherals
The control unit and the necessary peripherals must
be securely housed on the boat. For this purpose, a
housing was developed which protects the technology
used from penetrating dirt and water (Fig. 9).
The D-Sub 9 connector ➀ serves as input for the
paddle’s measurement data. The XT60 connector ➁ is
used to connect the battery. The plastic cable gland ➂
is used to guide the motor cable to the motor con-
troller. The four-pole connector ➃ is used to record
the measured data from the battery. A switch ➅ for
switching the operating voltage of the Arduino on and
off was mounted on the top. Two LEDs ➆ serve as
status and error indicators. Furthermore, a rotary in-
cremental encoder ➇ and a potentiometer ➈ were at-
tached to the top. With these, it is possible to change
parameters while driving. In this way, different sce-
narios can be tested quickly during the measurement
runs. To make the parameter changes visible, a dis-
play ➉ was also mounted in the housing.
Figure 9: Housing for the electronic components (Doblaski,
2021).
icSPORTS 2022 - 10th International Conference on Sport Sciences Research and Technology Support
20
4 SUPPORT STRATEGIES FOR
THE PADDELEC
4.1 Conceptual Approaches
There are various strategies for demand-oriented sup-
port. Depending on the driver’s wishes and objec-
tives, the drive system implements a thrust depend-
ing on the support strategy selected. In the follow-
ing, three selected basic strategies will be examined
in more detail.
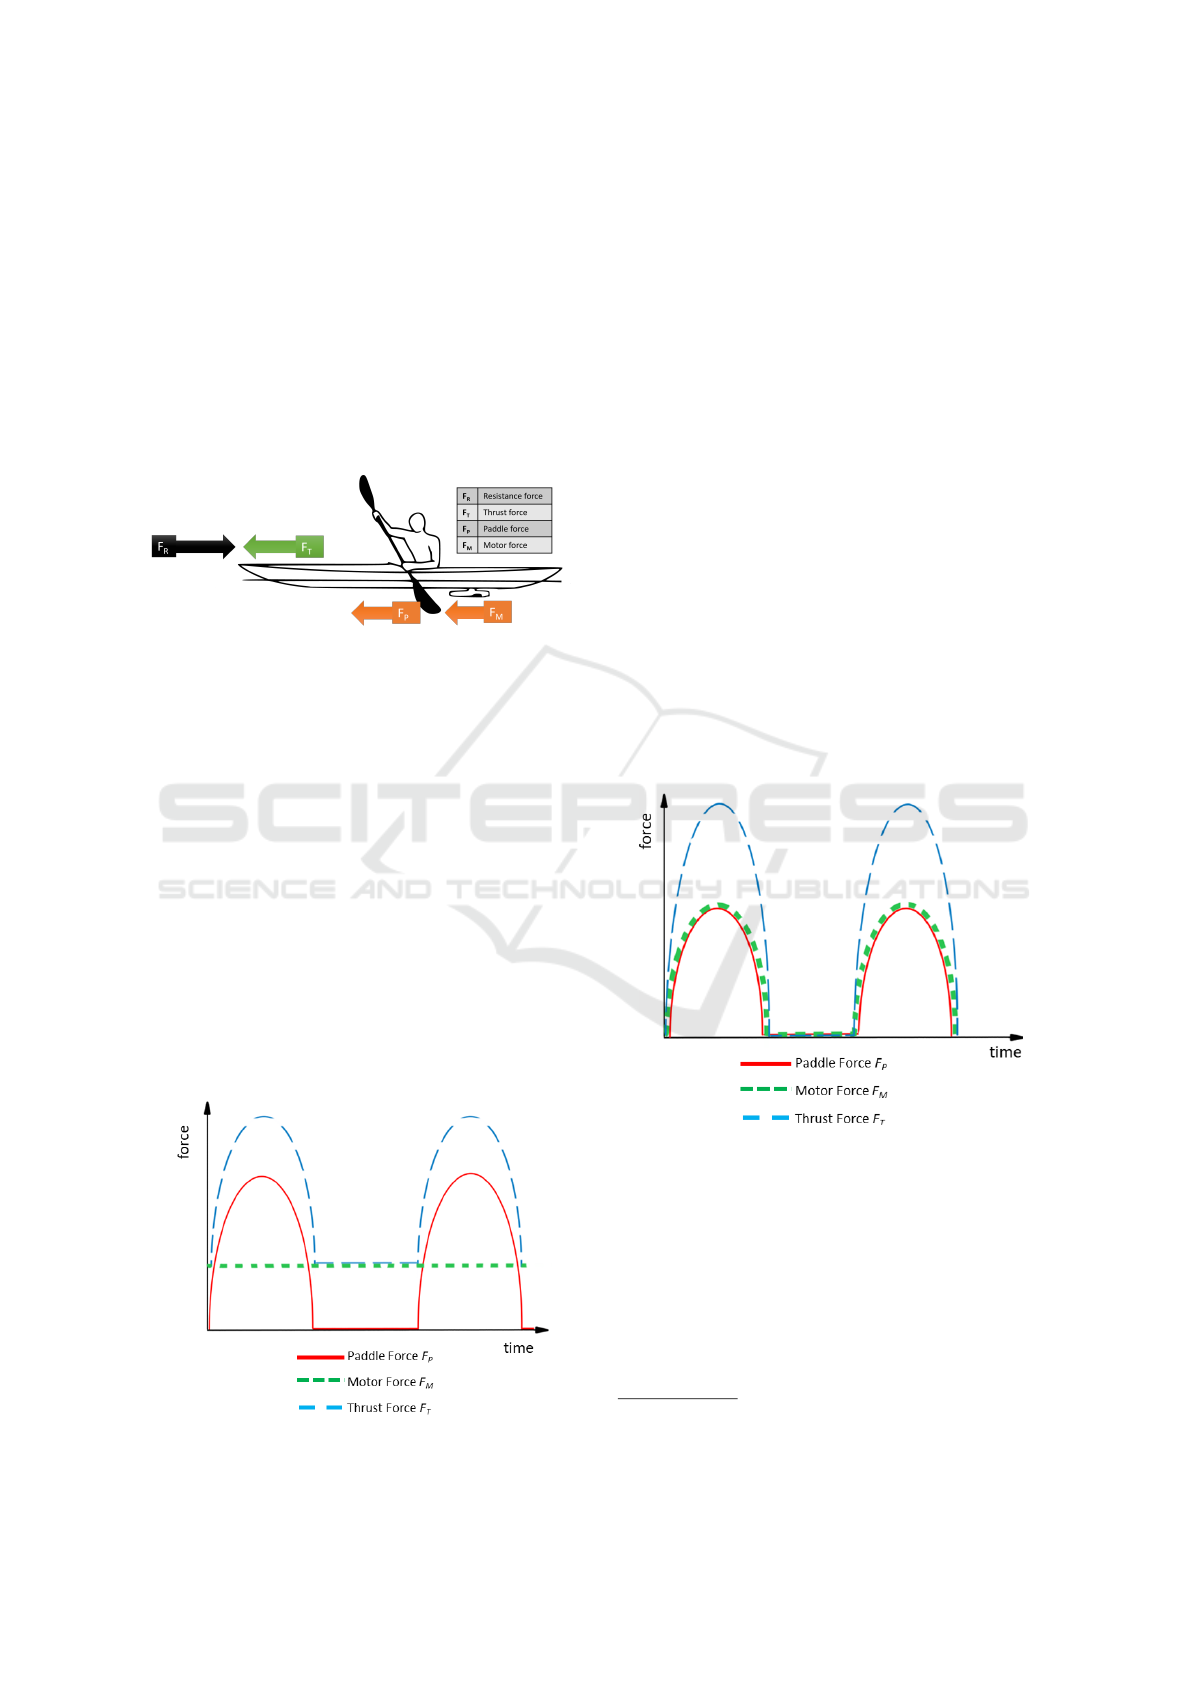
Figure 10: Basic forces for analysis support strategies.
The propulsive forces acting on the boat are shown
in Fig. 10. They are divided into paddle forces F
P
and motor forces F
M
(orange arrows). The sum of the
two forces is the total thrust force F
T
(green arrow).
This force acts against the resistance force F
R
(black
arrow).
4.2 Strategy 1 - Constant Support
In this strategy, the user is assisted by the drive with
constant force. For this purpose, the force applied by
the user to the paddle is averaged over several pad-
dle strokes. The calculated force is then applied con-
stantly by the drive for support (mode: tailwind).
Fig. 11 shows the individual force curves over
time. The red line shows the progression of the force
applied to the paddle.
Figure 11: Strategy 1 - Constant support scheme.
The green line is the additional force F
M
applied by
the motor
2
. The resulting force F
T
from the paddle
and motor is indicated by the blue line.
The aim of this strategy is to be as universal as
possible for all requirements. It offers a compromise
between dynamics and efficiency.
4.3 Strategy 2 - Direct Support
This strategy is based on the paddling rhythm of the
user. Through the direct use of assistance, each pad-
dle stroke is perceived as more powerful and the reac-
tion of the boat as particularly dynamic
3
.
The strength of the assistance is aligned to the
force measured at the paddle (F
B
). The propulsion
system replicates the force curve over a paddle stroke.
As a result, the pushing force F
M
should act syn-
chronously with the paddle force F
P
. The Fig. 12
shows the corresponding curve progression. It is spe-
cial that the motor force has the same qualitative pro-
file of the paddle force.
This strategy corresponds to the approach of a
pedelec (elec. bicycle). Due to the simultaneous
thrust of the drive, the paddle stroke should be po-
tentiated and thus be perceived as more powerful.
Figure 12: Strategy 2 - Direct support scheme.
4.4 Strategy 3 - Valley Support
In this strategy, the goal is to achieve high efficiency
by moving the boat as smoothly as possible. The
thrust of the motor F
M
is used to supplement the pad-
dling force F
P
so that there is always a constant force
on the boat. The maximum force to be supplemented
is determined by the driver. Fig. 14 shows the pro-
gressions of the forces during paddling.
2
Calculated from the averaged force of the paddle.
3
The athlete has the impression of being much stronger.
On-demand Electric Thrust Assistance for Muscle-powered Watercraft: PADDELEC
21
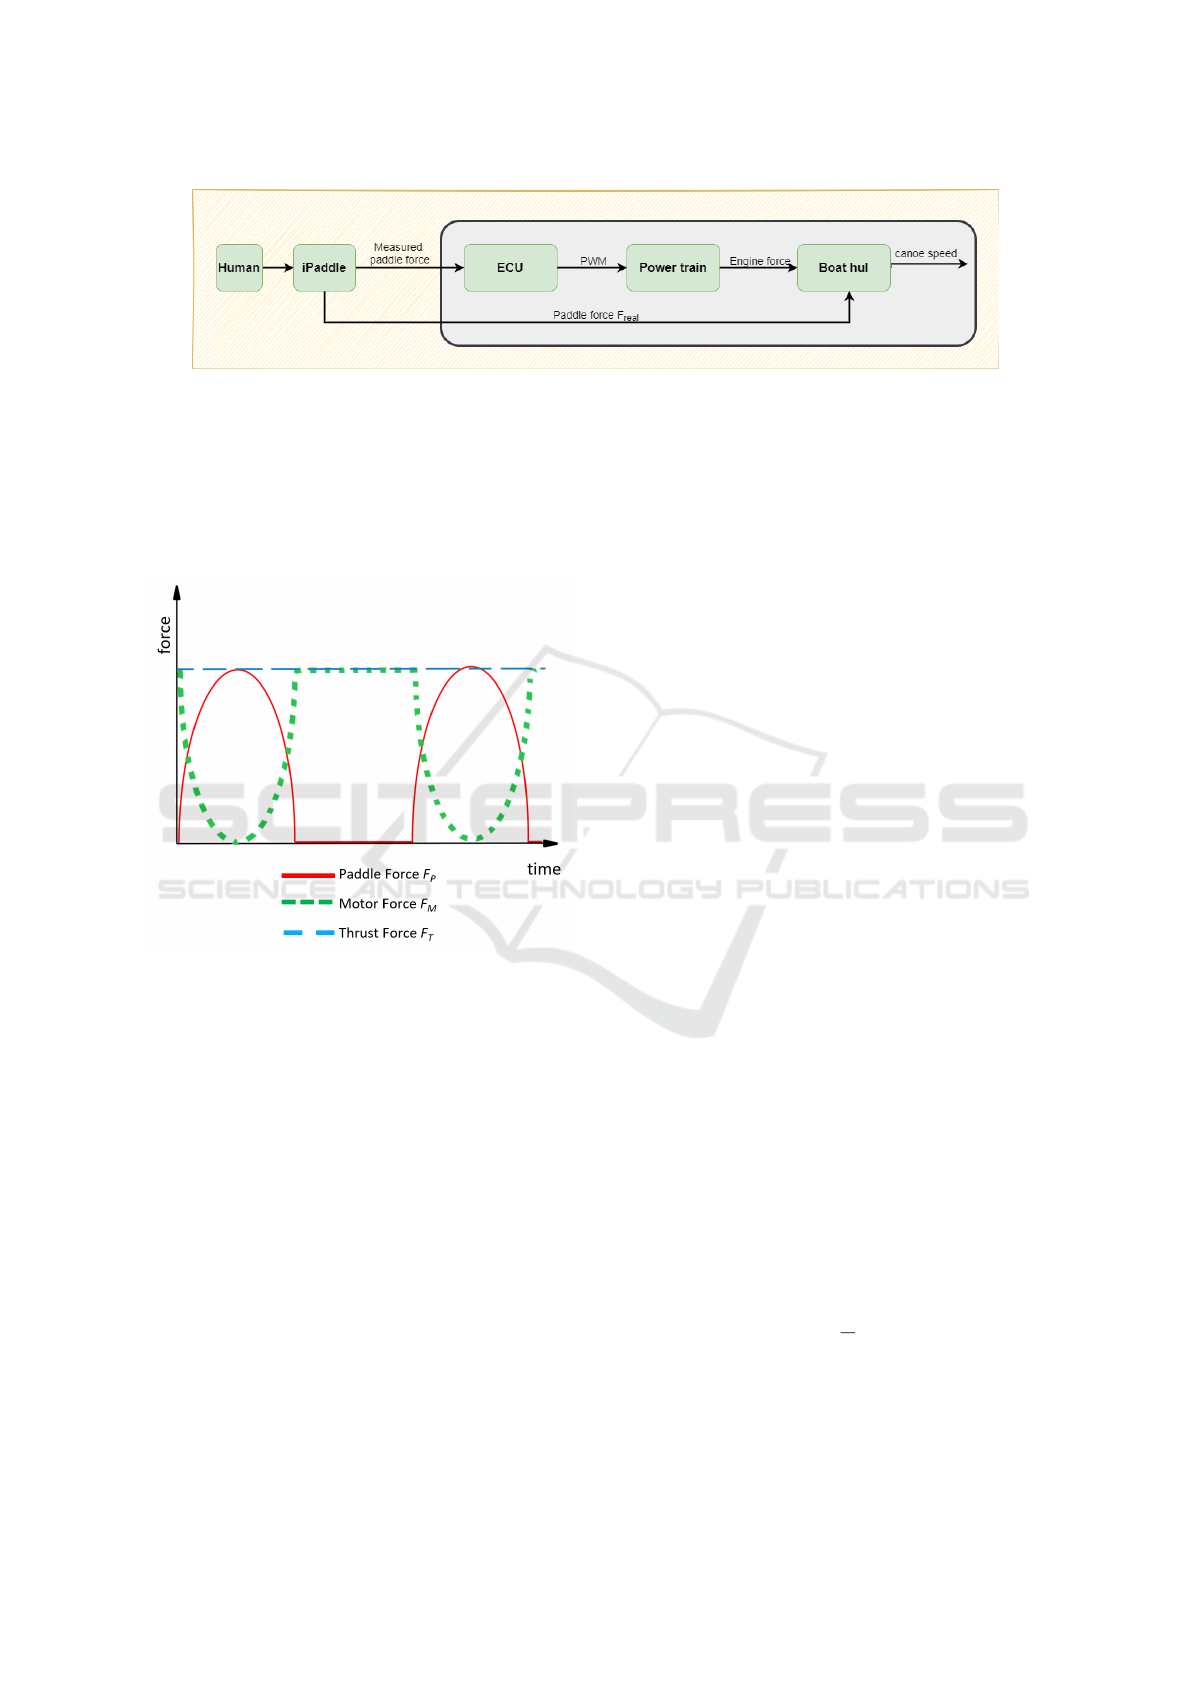
Figure 13: Basic structure of the simulation.
The advantage of this strategy is that the boat
causes less dynamic motion and can therefore be
driven more efficiently. The motor takes over the
power requirements to propel the boat smoothly. The
goal of this strategy is to eliminate speed fluctuations
(∆v) as much as possible.
Figure 14: Strategy 3 - Valley Support scheme.
5 INVESTIGATING SUPPORT
STRATEGIES USING A
SIMULATION APPROACH
5.1 Aims and Principle Approach of the
Simulation
One way to test the strategies mentioned above is to
conduct real-life tests with the canoe. However, this
requires a lot of technical and logistical effort. An-
other approach is to investigate the various support
strategies using a holistic simulation approach. This
makes it possible, for example, to identify errors in
the actuation strategies in advance. This approach is
significantly more efficient and saves resources.
Accordingly, the goal is to develop a physically
correct simulation model, for the investigation of the
support strategies, in order to verify the presented ap-
proaches. Furthermore, the developed strategies can
be transferred by a rapid prototyping approach, into
C-code, which can be used directly in the microcon-
troller.
The simulation models are first developed with the
assumption of ideal conditions. This means that there
are no disturbing influences in the model. In reality,
however, these always exist and include, for exam-
ple, the influence of wind, currents and waves. Some
of these influences can be approximated by constants,
but deviations from the real system inevitably remain.
These have to be estimated and evaluated.
The simulation and modeling of the entire sys-
tem is realized with the program Matlab/Simulink
from Math Works. The simulation consists of differ-
ent blocks, each representing a sub-component of the
overall system. The basic structure of the simulation
model shown in Fig. 13 consists of several subsystems
and is based on real conditions.
For example, the ”Human” simulation block
serves as input for the iPaddel model. The output vari-
able paddle force is passed on as inputs to the ”ECU”
and ”Boat hull” blocks. The ECU has the task of
generating a PWM signal based of the revived sen-
sor data, which is used to control the motor in Block
”Power train”.
The simulation results, especially the speed of the
boat, can be validated with real measured values (e.g.
with a GPS-sensor).
5.2 Realization of the Simulation
5.2.1 Model of the Boat Hull
The boat is a rigid body. To set it in motion a force
must be applied:
a =
F
m
(2)
where a is the acceleration, F is the total force acting
on the body, and m is the mass of the body including
the mass of the persons.
icSPORTS 2022 - 10th International Conference on Sport Sciences Research and Technology Support
22

Figure 15: Signal flow diagram in Simulink (Seidel, 2022).
The speed of the boat is then obtained by integrat-
ing the acceleration to give:
v =
Z
adt + v
0
(3)
The force F
Forward
(F
F
) results from all the partial
forces (paddle force F
P
, motor force F
M
, resistance
force F
R
and thrust force F
T
) acting on the boat to be:
F
F
= F
P
+ F
M
− F
R
= F
T
− F
R
= m · a (4)
In a canoe, the force F
P
results from the movement
of the paddle in the water. An additional force F
M
is
generated by a motor used. These two forces combine
to form the thrust force F
T
. This is countered by a
resistance force F
R
, which dependents, among other
things, on the shape of the boat. Fig. 10 shows this
situation on a canoe.
In order to create a simulation, it is therefore nec-
essary to find out which input forces act on the boat
through the paddle and motor and how the boat be-
haves in terms of the resistances that occur.
Modeling the physical behavior of a watercraft
is very complex. In order to model the drag force
as realistically as possible, a large number of phys-
ical equations and parameters must be considered.
The total resistance of the boat is made up of several
partial resistances, some of which are very complex
to determine (e.g. skin friction resistance and pres-
sure resistance, which can be further divided in wake-
making resistance, naked hull skin friction resistance
appendage skin friction resistance and so on).
The model can quickly become inaccurate and un-
realistic because there are a large number of submod-
els for which assumptions have to be made. There-
fore, the modeling is additionally supported by metro-
logical investigations, e.g. by measuring the deceler-
ation behavior. The model was created in Simulink
according to equations 2, 3 and 4 with the signal flow
diagram shown in Fig. 15.
For the determination of the boat resistance, the
equation for the drag coefficient was used:
cw =
2 · F
R
ρ · A · v
2
(5)
The cw value, also called the drag coefficient, is
composed of the density of the medium ρ, the face
area A, the velocity v of the incident flow of the
medium and the drag force F
R
.
In this context, the frontal area is the area that the
respective medium, in this case water or air, impinges
on in the direction of travel. The density of water is
assumed to be constant at 1000 kg/m
3
and the density
of air is assumed to be constant at 1.2 kg/m
3
.
Two fluids act on the paddler and the boat, on the
one hand the air and on the other the water. Thus, after
rearranging equation 5 and considering both fluids at
once, the total drag force F
R,total
(F
R,t
) results in:
F
R,t
= F
R,w
+ F
R,a
(6)
Where the subscripts a and w stand for air and water
and t for total, respectively. This gives the equation:
F
R,t
=
1
2
· ρ
w
· cw
w
· A
w
· v
2
w
+
1
2
· ρ
a
· cw
a
· A
a
· v
2
a
(7)
It is assumed for modeling purposes that there are
no perturbations such as current or wind acting on the
boat. The velocities of the inflow from air and from
water are therefore equal to the velocity of the boat.
Equation 7 can thus be simplified:
F
R,t
=
1
2
· v
2
· (ρ
w
· cw
w
· A
w
+ ρ
a
· cw
a
· A
a
) (8)
It is difficult to capture the frontal area of the boat
including the athlete and paddle
4
. For this reason, the
factors K
w
and K
a
were used, which combine the un-
known drag coefficient and the unknown frontal area
of the respective medium. This results in the equation
of the total resistance to be:
F
R,t
=
1
2
· v
2
· (ρ
w
· K
w
+ ρ
a
· K
a
) (9)
After factoring out ρ
w
, we get:
F
R,t
=
1
2
· v
2
· ρ
w
· K (10)
transformed, where:
K = K
w
+
ρ
a
· K
a
ρ
w
(11)
The parameterization of the model was deter-
mined using the deceleration behavior of the boat,
similar to the usual procedure in automotive engineer-
ing. The magnitudes of the driving resistances are di-
rectly dependent on the velocity. In order to deter-
mine this relationship over the entire speed curve, a
deceleration test was carried out.
4
The area changes continuously during the ride, e.g.,
due to the continuous movement of the paddle, the sitting
posture of the paddler, or the slight lifting out of the boat at
higher speeds.
On-demand Electric Thrust Assistance for Muscle-powered Watercraft: PADDELEC
23
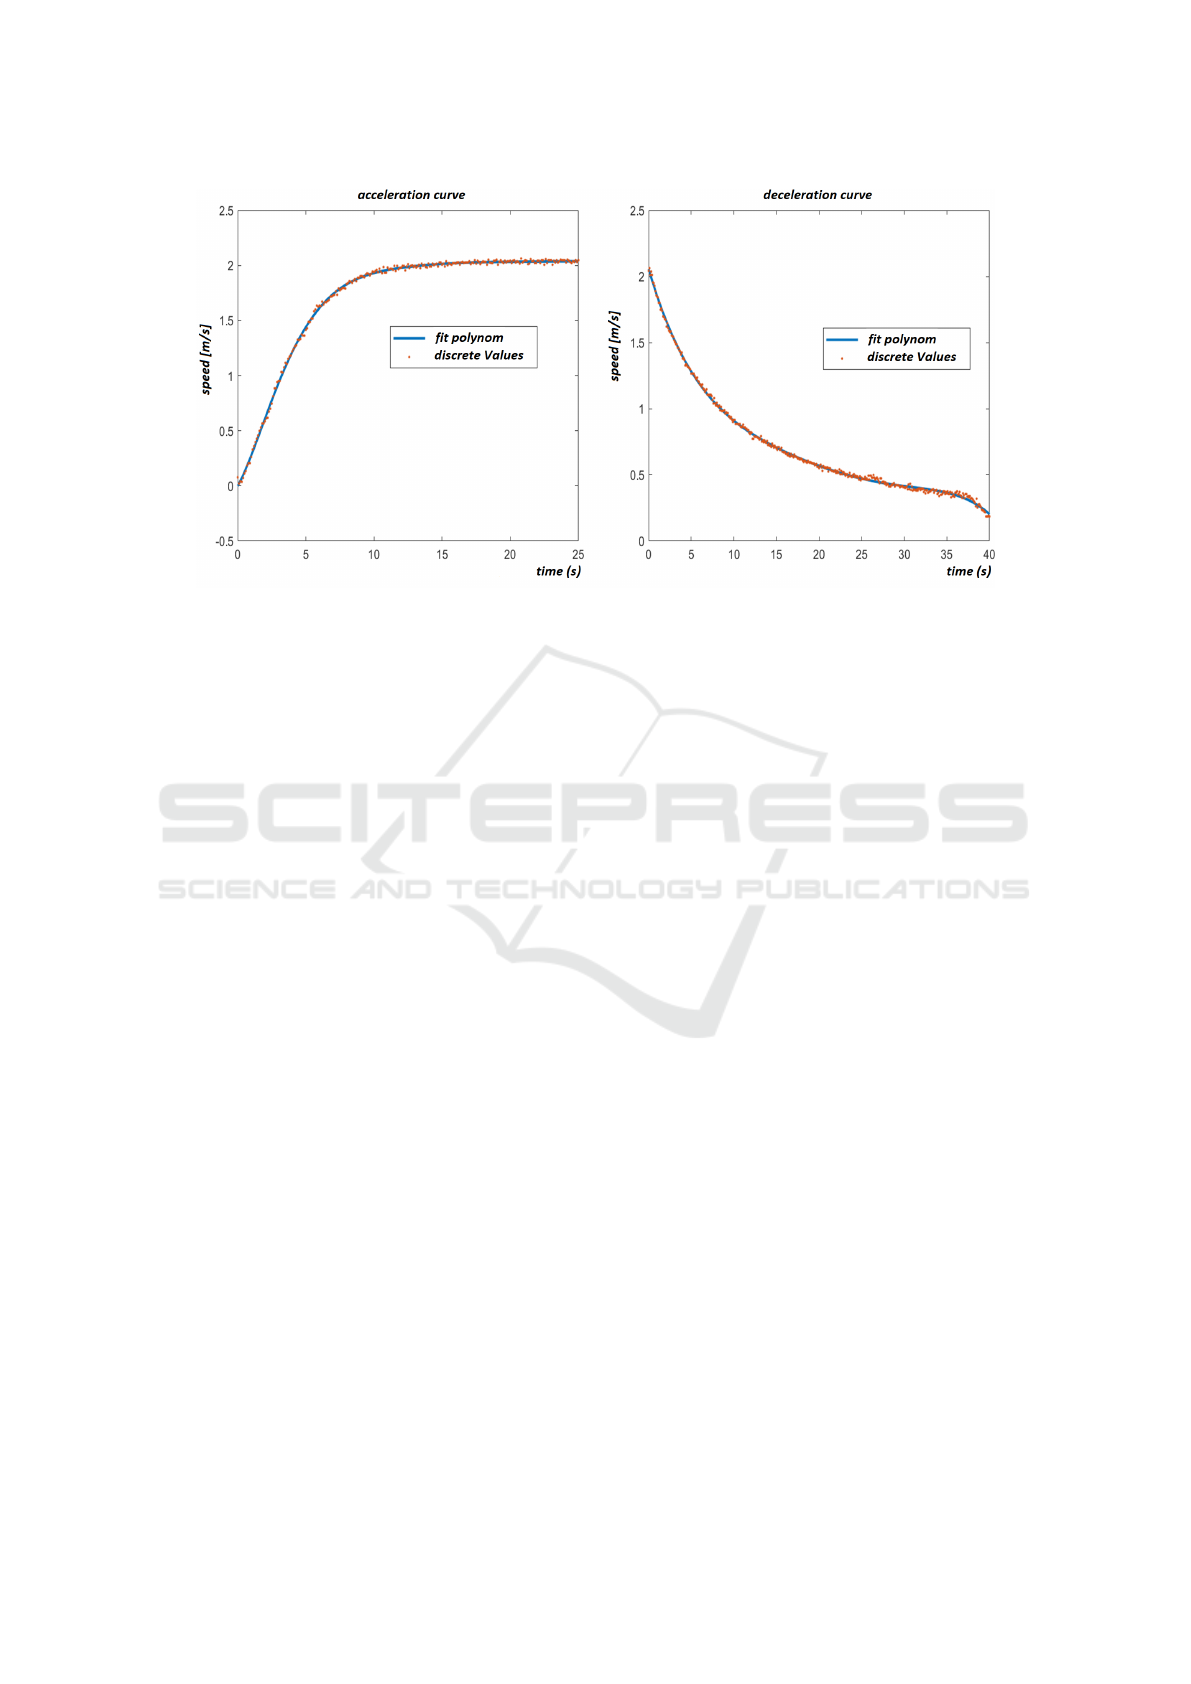
Figure 16: Acceleration and deceleration curve (Seidel, 2022).
The boat was accelerated to a given speed (e.g.
8 km/h) and then switched off. The drag forces acting
on the boat result in a reduction of the boat speed until
it comes to a standstill. Provided that no disturbance
variables such as wind and current influence the be-
havior of the boat, the force acting on the boat can be
calculated from the determined acceleration (respec-
tive negative acceleration).
The mass of the test vehicle was determined be-
forehand. Thus, the acting force F can be calculated
at any time. The force and velocity can then be re-
lated via the time stamps. This experiment is carried
out under the assumption that the resistance behaves
identically at the same instantaneous speed - regard-
less of whether the boat is accelerating or moving at
a constant speed. To obtain reliable values, the exper-
iment is repeated several times and the mean value is
calculated. With this procedure, the resistance from
the speed could be determined.
Following the driving resistance determination of
motor vehicles, the velocity curves of several deceler-
ation curves of the boat were recorded for the deter-
mination of the force F
R,t
. The acceleration was then
calculated from the recorded velocities by derivation.
The acceleration and roll-out curves can be fitted
2nd or 3rd order polynomials. Therefore, an approxi-
mation of the real data is possible. An example com-
parison of the fitted and acquired data can be seen in
Fig. 16. By the conversion into a continuous function
a derivation is now possible. (Doblaski, 2021; Seidel,
2022; Vikulin, 2021)
5.2.2 Model of the Paddle
Once the boat model has been validated, a ”standard
paddle stroke” for amateur athletes must be defined
and converted into a functional block for comparative
studies. To do this, the maximum force must first be
determined and specified.
Fig. 18 shows forces on kayak paddles during use
by competitive athletes. The forces are plotted in
newtons for women’s (F) and men’s (M) rides at dif-
ferent paddle cadences in strokes per minute (spm).
The force of a female athlete at 60 spm, corresponds
to forces of up to 126 N. This defines the maximum
values.
The acquired force on the paddle is not fully used
for propulsion. The captured force must be corrected
with a paddle function. For initial assumptions, a pad-
dle factor should suffice for now.
The paddle factor depends, among other things,
on the blade shape. Symmetrical paddles have an ef-
ficiency factor of up to 74 %, asymmetrical paddles
up to 89 %. The paddle used for the tests is highly
asymmetrical. Both the paddle angle and the paddle
distance from the boat have also a large influence on
the effective propulsive force (Jackson, 1995; Vikulin,
2021). To reduce the number of unknown variables, a
very accurate paddle guidance is assumed.
To capture the correct paddle factor, real measure-
ments of the paddle are given to the validated boat
model and fitted until the curves match sufficiently
accurately. Fig. 17 shows the measured data of the
left and right paddle as well as the resulting force
acting on the boat through the paddle as propulsive
force. The measurements were made on a lake near
by Dresden under good weather conditions (only light
icSPORTS 2022 - 10th International Conference on Sport Sciences Research and Technology Support
24
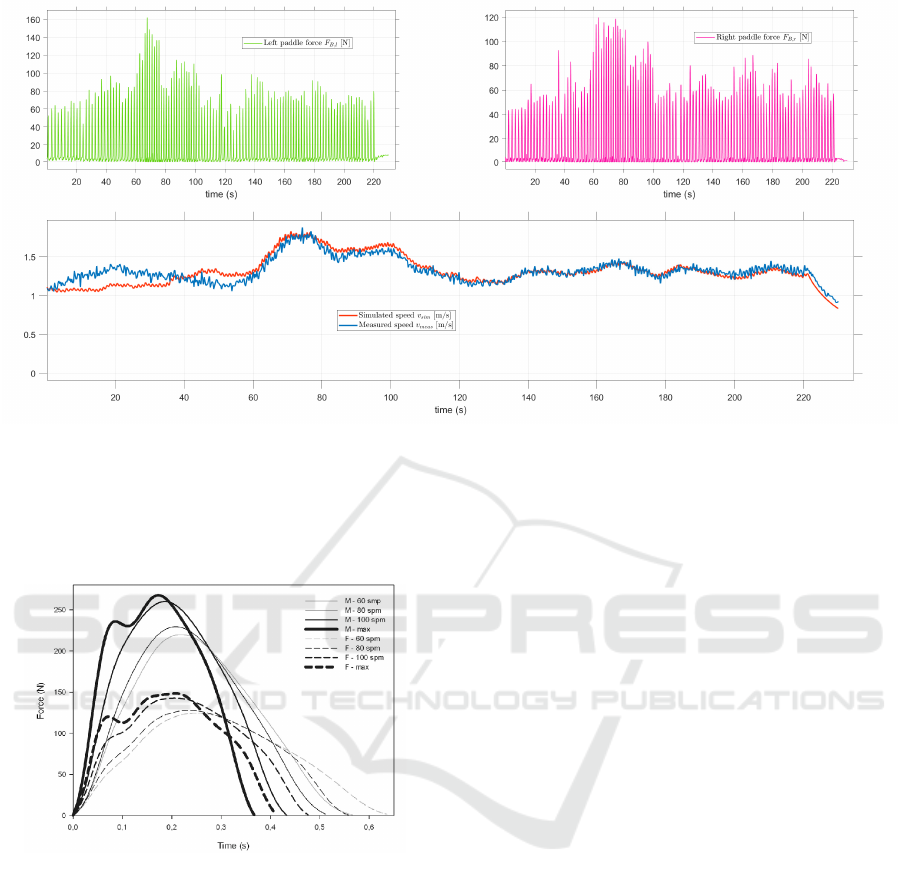
Figure 17: Boat hull validation.
wind). Special measurement equipment from Lord
ZSE Electronic was used for the tests. The speed
recording is based on a satellite-based measurement
like GPS.
Figure 18: Force applied to kayak paddles by competi-
tive athletes by paddle frequency and gender (Gomes et al.,
2015).
5.2.3 Model of the Power Train
The control of the motor is realized by pulse width
modulation (PWM). The calculated duty cycle of the
desired PWM signal is transferred to the motor con-
troller via a microcontroller. This is housed with
the battery and the drive in the drive train subsys-
tem (Fig. 1). The motor controller controls the motor,
which generates a force in the longitudinal direction
via the impeller on the drive shaft. As a further input,
the boat subsystem also has the force of the paddle,
which also drives the boat.
From the calculation for the jet model, it is known
that the thrust depends on the rotational speed as well
as the difference between the ejection and inflow ve-
locities. In order to determine this relationship in a
way that could be used for the model, several test runs
were carried out and the results were then stored in the
form of a characteristic diagram. This means that the
drive model can be treated as a black box.
5.3 Validation of the Simulation
The vehicle model consists of subsystems of dif-
ferent types and behavior, which requires a sepa-
rate approach (simulation approach) depending on
the part model (sub-model). To meet the require-
ments of a complete vehicle simulation (integration
of ECUs, consideration of physical behavior, use of
analog controllers), a hybrid simulation approach or
co-simulation must be used.
Fig. 20 shows the complete simulation model,
based on the block diagram in Fig. 1. In addition, the
”ECU” and ”User Input” block has been added. The
control algorithms are implemented in the ”ECU” and
possible user inputs are processed in the ”User Input”
block.
To validate the simulation, the force of the paddle
acting for propulsion is applied to the boat model and
then the resulting simulated speed is compared with
the real recorded speed. Since the recorded force of
the paddle (see also section 5.2.2) does not act directly
as a propulsive force, an adjustment was made using
a paddle factor.
The aim is to simulate the real speed as accurate
as possible using the Simulink model. If the course
of the real speed matches the simulated speed suffi-
On-demand Electric Thrust Assistance for Muscle-powered Watercraft: PADDELEC
25
0 100 200 300 400 500 600
time (s)
0
50
100
0 100 200 300 400 500 600
time (s)
0
0.5
1
1.5
2
Figure 19: Htw Dresden paddle cycle for analyzing paddelec support strategies.
ciently accurate, the simulation model has been pa-
rameterized correctly and can be used for further in-
vestigations.
Fig. 17 shows an example of a measurement run
that was used to validate the simulation model. The
respective left and right paddle forces are shown at
the top left and right. These are the measured force
F
B
on the paddle. In the lower picture, the measured
velocity is shown in green (V
meas
) and the result of the
simulated velocity in blue (V
sim
).
In the initial range of the measurement (1-60 sec-
onds) clear deviations can be seen, which can be ex-
plained by wind influence. The remaining course of
the simulated speed agrees very well with the mea-
sured one. Thus, the model can be accepted as vali-
dated for this individual case.
Figure 20: Structure of the overall simulation.
5.4 Simulation Results
5.4.1 Paddle Cycle for Testing Support
Strategies
A paddle cycle of about 10 minutes is used to in-
vestigate the different strategies. To vary the pad-
dle strokes, the maximum value is scaled. The pad-
dle frequency is not changing over time. Fig. 19
shows the progression. First, the athlete paddles with
the synthetically generated simulated ”norm paddle
stroke for amateur athletes” for about 120 seconds
with 100 % of the specified maximum force of 126 N
(F
B
). Afterwards there is a ca. 2-minute break. Then
the athlete paddles for 70 seconds with 60 %, makes a
break of 40 seconds and returns to paddle with 25 %
of the specified maximum force. After another short
break, there are 3 fast paddle cycles of ca. 10 seconds
followed by a constant phase of 50 % (90 seconds).
The cycle runs until the canoe stops.
The lower section of the figure shows the simu-
lated behavior of the boat without the influence of
disturbance variables or support forces. A maximum
speed of approx 2.1 m/s is achieved.
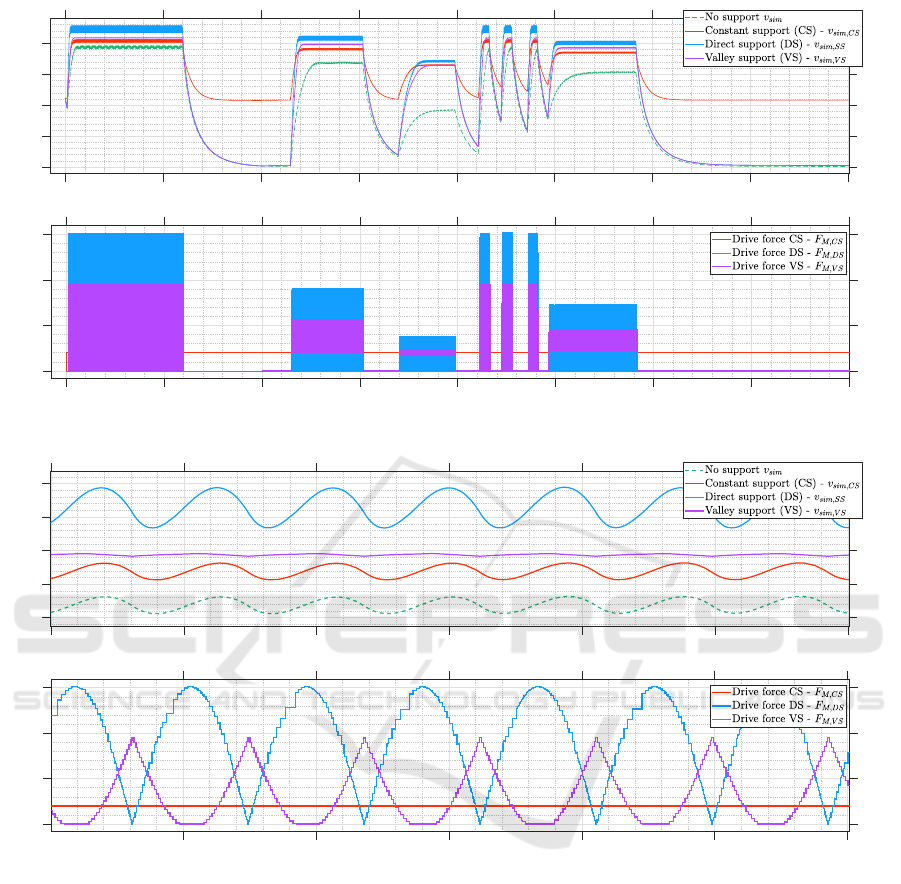
5.4.2 Comparison of the Strategies
Fig. 21 (upper plot) shows the velocity profiles with
the application of all three strategies explained before.
The paddle profile from Fig. 19 was used for the sim-
ulation. The lower plot shows the additional forces
added by the motor. The green curve (dotted line)
shows the velocity profile without additional support.
It is noticeable that the thrust assistance has a
icSPORTS 2022 - 10th International Conference on Sport Sciences Research and Technology Support
26
0 100 200 300 400 500 600 700 800
time (s)
0
0.5
1
1.5
2
0 100 200 300 400 500 600 700 800
time (s)
0
50
100
150
Figure 21: Simulated speed curves of different support strategies.
50 51 52 53 54 55 56
time (s)
1.9
2
2.1
2.2
2.3
51 52 53 54 55 56
time (s)
0
50
100
150
Figure 22: Zoomed curves from figure 21.
greater effect at lower speeds. A significant speed
difference at maximum paddle force is hardly notice-
able. In order to see a large change here, a more
powerful power train is needed, since the speed en-
ters quadratically into the resistance calculation (see
also equation 10). However, this does not make sense
for the envisaged canoeing, since it also means that a
larger battery is needed and correspondingly heavier
drive components. An acceptable compromise must
be found here.
In Fig. 22, the time course from graph 21 is
zoomed in. So that the different behavior of the strate-
gies can be seen better. The purple curve v
sim,V S
shows a very smooth speed curve, which is achieved
by a correspondingly dynamic control of the drive
in the valleys (F
M,V S
). The red curve v
sim,CS
corre-
sponds to the original curve without support but with a
given offset. The blue curve v
sim,DS
shows the largest
changes in velocity and is therefore also the worst in
terms of energy. However, it can be assumed that this
mode is perceived as very dynamic and met with great
approval.
6 CONCLUSIONS
The fundamentals of an intelligent paddle (iPaddle)
and its suitability as a control device for electric aux-
On-demand Electric Thrust Assistance for Muscle-powered Watercraft: PADDELEC
27

iliary drives were investigated.
The behavior expected in advance in terms of
thrust could be confirmed in principle. In the future,
the use of an optimized waterjet drive is planned. The
main aim is to reduce propulsion losses and to inte-
grate the propulsion system into the hull of the boat
in a form-fit manner.
Extensive hardware and software tools were cre-
ated for the metrological investigation of an electri-
cally assisted canoe.
A new simulation model of the longitudinal dy-
namics was developed. The drive train and driving
resistance subcomponents were modeled in the form
of a black box using the measurement data from driv-
ing tests. This can be used among others to test the
support strategies in the laboratory.
The realistic behavior of the overall simulation
was examined and evaluated using an extensive test
scenario. The basic strategies can now be further sup-
plemented and examined with the aid of the simu-
lation. The theoretically elaborated strategies could
partly be tested practically on the water.
By means of recorded data of the measurement
runs, further investigations can be carried out on the
boat, e.g. the influence of disturbance variables.
With the evaluation of the practical testing, it
could be shown that some support strategies behave
significantly different in reality than was assumed the-
oretically.
The use of a position sensor for the iPaddle is cur-
rently being investigated to measure the position in
space more accurately. This will make it possible to
develop more precise strategies and implement new
safety features, such as preventing the motor from be-
ing supported in certain situations like special course
corrections.
REFERENCES
Aentron (2022). Energy solutions.
BMWi (2013). Water tourism in germany.
Doblaski, J. (11/2021). Investigation of model-based ac-
tuation strategies for an electrically powered kayak.
Diploma thesis, HTW Dresden, Dresden.
Dr. Budich, R. and Dabrazzi, E. (2020). Drive system for
a watercraft that can be moved by muscle power, and
method for controlling a drive system.
Gomes, B. B., Ramos, N. V., Conceic¸
˜
ao F, A. V., Sanders,
R. H., Vaz, M. A., and Vilas-Boas, J. P. (2015). Pad-
dling force profiles at different stroke rates in elite
sprint kayaking. Journal of applied biomechanics,
31(4):258–263.
H
¨
ase, M. (04/2020). Investigation of sensors for force mea-
surement in electrically assisted canoeing. Diploma
thesis, HTW Dresden, Dresden.
Hauptmann, F. (05/2020). Simulation, analysis and control
of the electric drive train of a watercraft. Diploma
thesis, HTW Dresden, Dresden.
Jackson, P. S. (1995). Performance prediction for olympic
kayaks. Journal of sports sciences, 13(3):239–245.
Kaitts Ltd. (2022). Online shop.
Kedean (2022). Online shop.
P
¨
oschmann, M. (05/2020). Development of a modular en-
ergy storage and management system for LEVs (light
electric vehicles). Diploma thesis, HTW Dresden,
Dresden.
Seidel, J. (02/2022). Analysis of paddle and motion data of
an electrified kayak and optimization of the measure-
ment system. Diploma thesis, HTW Dresden, Dres-
den.
Vikulin, A. (11/2021). Contribution to the modeling and
control of a hybrid driven stand-up paddle. Master
thesis, HTW Dresden, Dresden.
icSPORTS 2022 - 10th International Conference on Sport Sciences Research and Technology Support
28
