
Cluster-based Diversity Over-sampling: A Density and Diversity
Oriented Synthetic Over-sampling for Imbalanced Data
Yuxuan Yang
a
, Hadi Akbarzadeh Khorshidi
b
and Uwe Aickelin
c
School of Computing and Information Systems, The University of Melbourne, Grattan Street, Parkville, Victoria, Australia
Keywords: Over-sampling, Diversity Optimisation, Genetic Algorithm, Imbalanced Data, Clustering.
Abstract: In many real-life classification tasks, the issue of imbalanced data is commonly observed. The workings of
mainstream machine learning algorithms typically assume the classes amongst underlying datasets are
relatively well-balanced. The failure of this assumption can lead to a biased representation of the models’
performance. This has encouraged the incorporation of re-sampling techniques to generate more balanced
datasets. However, mainstream re-sampling methods fail to account for the distribution of minority data and
the diversity within generated instances. Therefore, in this paper, we propose a data-generation algorithm,
Cluster-based Diversity Over-sampling (CDO), to consider minority instance distribution during the process
of data generation. Diversity optimisation is utilised to promote diversity within the generated data. We have
conducted extensive experiments on synthetic and real-world datasets to evaluate the performance of CDO
in comparison with SMOTE-based and diversity-based methods (DADO, DIWO, BL-SMOTE, DB-SMOTE,
and MAHAKIL). The experiments show the superiority of CDO.
1 INTRODUCTION
Imbalanced data refers to a scenario whereby there is
a large proportion of instances which are labelled as
“Negative” (majority class) to the number of
instances labelled as “Positive” (minority class).
Performance of subsequent learning classifiers may
be negatively impacted without further treatment of
imbalanced labels. Specifically, the processing of
minority instances would most likely be regarded as
an outlier or anomaly within the dataset (Ali et al.,
2013). The objective for most of the mainstream
classification algorithms is either to minimise
misclassification error or to maximise predictive
accuracy. However, it is often overlooked that these
classification algorithms are constructed on the basis
that the distribution of instances within each class is
relatively balanced. As such, when classifiers are
built on imbalanced datasets, the accuracy of these
algorithms is often biased or have an overwhelming
tendency to predict the majority class, resulting in
high False Negative Rates (FNR) (Sasaki, 2007;
Thabtah et al., 2020).
a
https://orcid.org/0000-0001-5983-6038
b
https://orcid.org/0000-0002-2653-4102
c
https://orcid.org/0000-0002-2679-2275
In the current literature, there are 3 main concepts
used to treat and address imbalanced data, which are
cost-sensitive learning, ensemble-based method, and
re-sampling techniques. The purpose of “re-sampling
techniques” is to create, either randomly or
synthetically, a more balanced representation of the
underlying dataset used for learning. One form of re-
sampling techniques is Over-sampling, where in its
most basic form, involves random sampling. There
are also synthetic ways used to over-sample data
based on many years of research. Synthetic instances
generated are not exact replicas of the original
instances. They broaden the decision region
compared to random over-sampling. As a result,
synthetic methods minimise the likelihood of
overfitting, and reduce False Negative Rate and
stabilise the performance of classifiers (Japkowicz &
Stephen, 2002). However, for most of the synthetic
methods, the generated instances lies along a linear
path between minority data points, and the creation of
synthetic minority data points takes place in the
“feature level” and not on the “data level” (Chawla et
al., 2002). It implies the decision region of minority
Yang, Y., Khorshidi, H. and Aickelin, U.
Cluster-based Diversity Over-sampling: A Density and Diversity Oriented Synthetic Over-sampling for Imbalanced Data.
DOI: 10.5220/0011381000003332
In Proceedings of the 14th International Joint Conference on Computational Intelligence (IJCCI 2022), pages 17-28
ISBN: 978-989-758-611-8; ISSN: 2184-3236
Copyright © 2023 by SCITEPRESS – Science and Technology Publications, Lda. Under CC license (CC BY-NC-ND 4.0)
17

class does not consider a holistic view of the entire
minority data space (Bennin et al., 2017).
In this paper, we designed an algorithm to address
the above issue. The proposed algorithm generates
diversified synthetic instances within the minority
class while considering the distribution of the
minority data space. It is done via optimising both
similarity to minority instances and diversity in
synthetic instances. The optimisation process is
conducted based on genetic algorithm. Our proposed
method guarantees proximity of the generated
synthetic instances to the actual instances in the
minority class. In addition to preserving the
advantage of over-sampling, the proposed algorithm
enables the optimal spread of generated instances in
the data space and help to broaden the decision region
as a result of diversity optimisation.
2 RELATED WORK
SMOTE is a well-known synthetic over-sampling
technique in the literature (Chawla et al., 2002). The
process of generating synthetic minority class
instances is via a random selection of specified k-
nearest neighbours of a minority sample, and
applying a multiplier derived from a uniform random
distribution (0,1). This creates an “synthetic” instance
which will be located between the 2 minority points.
SMOTE has improved the performance of classifiers
trained on imbalance dataset through the process of
expanding decision regions housing nearby minority
instances as compared to basic random over-sampling
which enhanced and narrowed decision regions with
contrasting effects (Chawla et al., 2002)
Recent studies have flagged a limitation of
traditional over-sampling methods (i.e. SMOTE) to
its casual tendency to generate synthetic instances
which extends into the input region of the majority
class instances, thereby negatively impacting the
performance of the subsequent learning classifier
built (Bennin et al., 2017; Sharma et al., 2018). These
studies have identified the dual importance of
maintaining the integrity of the minority sample
region, in addition to enhancing the diversity of
minority class data. Subsequent studies has aimed to
address the above challenge.
ECO-ensemble is an Cluster-based synthetic
oversampling ensemble method (Lim et al., 2016). Its
idea originates on identifying suitable oversampling
cluster regions with Evolutionary Algorithm (EA) to
derive at the optimised ensemble. The SMOTE-
Simple Genetic Algorithm (SMOTE-SGA) method is
proposed to enhance the diversity within the
generated dataset (Tallo & Musdholifah, 2018). The
algorithm determines instances to be generated and
the number of synthetic instances created from the
selected instance (sampling rate) to overcome the
overgeneralization problem in SMOTE.
MAHAKIL is created with the purpose of
generating more diverse synthetic instances (Bennin
et al., 2017). It works by pairing minority instances
with previously generated synthetic instances to
generate instances inspired by the Chromosomal
Theory of Inheritance. It utilised the core concept of
Mahalanobis Distance as the measure for diversity, in
conjunction with inheritance and genetic algorithm.
The fundamental idea is to create synthetic minority
instances which are unique using 2 relatively distant
parent instances which are different to their parents
(i.e. existing minority class). In 2018, SWIM
(Sampling WIth the Majority) was proposed (Sharma
et al., 2018). Synthetic minority instances are
generated based on the distribution of majority class
instances which are effective against extremely
imbalanced data. In 2021, a diversity-based sampling
method with a drop-in functionality was proposed to
evaluate diversity. It is achieved via a greedy
algorithm that is used to identify and discard subsets
that share the most similarity (Yang et al., 2021).
Most recently, Diversity-based Average Distance
Over-sampling (DADO) and Diversity-based
Instance-Wise Over-sampling (DIWO) are proposed
to promote diversity (Khorshidi & Aickelin, 2021).
The objective of the 2 techniques is to generate well-
diverse synthetic instances close to minority class
instances. DADO aims to ensure diversity in the
region among minority class instances. Whereas in
the case of DIWO, the contrasting approach is taken
to ensure synthetic instances are clustered as closely
to the actual minority class instances. DADO
performs better when minority instances are compact,
and immediate surrounding area is located within
minority space. DIWO performs better when minority
instances are widely distributed, and the surrounding
area does not sit within the minority space.
In this paper, we propose a new synthetic
sampling method, namely Cluster-based diversity
oversampling (CDO). Our proposed method
combines the advantage of both DADO and DIWO
by analysing the density distribution of the minority
instances via diversity optimisation.
ECTA 2022 - 14th International Conference on Evolutionary Computation Theory and Applications
18

3 METHODOLOGY
3.1 Cluster based Diversified
Over-sampling (CDO)
In this section, we aim to describe our new proposed,
Cluster-based Diversity Over-sampling (CDO). The
new proposed method aims to provide a more robust
algorithm compared to DADO and DIWO by
combining the strengths of both approaches. A
clustering algorithm is used to analyse and learn the
density distribution of minority instances. For
instances that are compact and similar to each other
using density clustering method, DADO is applied.
For instances that are widely distributed, DIWO is
applied.
Our preferred choice of clustering method is
DBSCAN as it is more efficient in comparison to
partition-based or hierarchical-based clustering
methods when the problem requires us to determine
the arbitrary shaped clusters (Ester et al., 1996).
DBSCAN was first introduced in 1996 (Ester et al.,
1996). It is a non-parametric density-based clustering
algorithm and it works by enhancing the grouping of
instances which are closely located to each other and
simultaneously identifying points which are placed in
low-density areas (points whose nearest neighbours
are relatively far away). Additionally, we choose
DBSCAN over all other clustering methods due to the
reason that unlike our typical clustering problem, our
objective is to identify instances which are close
together and not clustering all the data points. We also
note the advantage of DBSCAN which allows the
user to select the desired level of similarity required.
The algorithm of CDO is shown in Algorithm 1.
It requires the following Epsilon (
𝑒𝑝𝑠), and Border
Point (𝑝) parameters for clustering. As 𝑝 is a binary
pair of parameter values, if it is true, border points are
assigned to clusters.
3.2 Diversity Optimisation
The choice of the proposed CDO algorithm for
diversity optimisation is the extended form of
NOAH’s algorithm (Ulrich & Thiele, 2011), as
shown in Algorithm 2.
Algorithm 2 contains 3 stages and requires the
following input parameters: population size (n),
number of generations to optimise objective function
(g), number of instances remaining in the population
after bound adaptation (r), percentage improvement
of bound (v) and finally, the stopping criterion
diversity maximisation (c). The above implies that if
the population diversity does not improve for c
generations, convergence of the diversity
maximisation is achieved. The whole algorithm
terminates if the bound does not improve for c
generation, To further optimise the objective
function, Algorithm 2 has also incorporated the usage
of Genetic Algorithm (GA), as it is the most popular
evolutionary algorithm. Mutation and crossover
concepts are utilised to create new instances.
Instances which objective functions are better than
bound value (b) are kept (Algorithm 2, lines 5 and
14). For DADO, the objective function (f) is the
average of distance from all instances in the minority
class. For DIWO, the objective function (f) is the
distance to each instance.
3.3 Diversity-based Selection
The preferred measure of diversity is Solow-Polasky
measure. There are 3 main properties which are
required of a diversity measure, which are namely 1)
monotonicity in variety, 2) monotonicity in distance
and 3) twinning. The first property implies that the
diversity measure will increase or at least be non-
decreasing when an individual element currently not
present in the dataset is added. The second property
requires that the diversity between a particular set S
(i.e. instances) should not be smaller to another set S’,
if all pairings within S are of the distance of all the
pairings within S’. The third property ensures the
diversity measure remains the same when additional
element, already in the set, is added. Solow-Polasky
measure can be expressed in the following equation
(1), where M represents the distance matrix. The
Euclidean distance between elements of set S are
denoted as 𝑑(𝑠
, 𝑠
) . Thereafter, our diversity
measure is derived and computed by the summation
of all inverse matrix of (
𝑀
= 𝑚
).
𝐷
(
𝑆
)
= 𝑀
= 𝑒
(
,
)
(1
)
To obtain the best diversity amongst all the
instances, the ideal scenario would be to generate all
possible permutation of subsets. However, this cannot
be achieved as it would be computationally infeasible
and expensive. As an alternative methodology, we
propose the use of a greedy approach which would
filter out instances which have the least contribution
to the diversity of our dataset. Our definition of
contribution is defined as the difference in diversity
for our dataset with and without the instance. As
proven in this study (Ulrich & Thiele, 2011), the
difference can be expressed in the following formula:
𝑀
−
𝐴
=
1
𝑐
̅
(𝑏
+ 𝑐
̅
)
(2
)
Cluster-based Diversity Over-sampling: A Density and Diversity Oriented Synthetic Over-sampling for Imbalanced Data
19

Algorithm 1: Cluster-based diversity over-sampling algorithm (CDO).
/* Step 1: Clustering minority instances */
1
𝐶 =0
2
for each point 𝑀 in minority class do:
3
if 𝑀 is labelled then next
4
if 𝑀 is not labelled then
5
NeighborPts ← return all points within 𝑒𝑝𝑠 neighbourhood of 𝑀 (incl. 𝑀)
6
if size of NeighborPts = 1 then label(𝑀)= NOISE next
7
𝐶 = 𝐶 +1
8
label(𝑀)= 𝐶
9
for each 𝑀’ in NeighborPts do:
10
if label(𝑀′)= NOISE and 𝑝 = 𝑇𝑟𝑢𝑒 then label(𝑀’) = 𝐶 next
11
if 𝑀’ is labelled: next
12
label(𝑀’) = 𝐶
13
NeighborPts’ ← return all points within eps neighbourhood of 𝑀’ (incl. 𝑀’)
14
if size(NeighborPts’) > 1 then NeighborPts ← NeighborPts U NeighborPts’
15
end for
16
end for
/* Step 2: Perform diversity algorithm for each cluster and NOISE points */
17
for each 𝐶 do:
18
𝑃
← NOAH(n, g, r, c, v, f)
19
end for
20
for each minority instances 𝑀 marked as NOISE do:
21
𝑃
← NOAH(n, g, r, c, v, f)
22
end for
/* Step 3: Combine generated datasets */
23
𝑃 = 𝑃
𝑈 𝑃
Algorithm 2: Diversity optimisation algorithm (NOAH).
Input: 𝑛, 𝑔, 𝑟, 𝑐, 𝑣
Output: a diverse set of instances 𝑆
1 S = Null; b = ∞; i = 0
2 while 𝑖 < 𝑐 do
/* Step 1: Optimising the objective function */
3 𝑃 ← Generate a population with n instances
4 for g generations do
5 𝑃
← Generate new n instances via mutation and crossover from P with objective values better than b
6 𝑃 ← Select n best instances from 𝑃 ∪ 𝑃
7 end for
/* Step 2: Bound adaptation */
8 𝑃← Select r best instances from 𝑃 ∪ 𝑆
9 𝑏
← Put the objective value of rth best instance in 𝑃 ∪ 𝑆
10 if DIWO and 𝑏−𝑏
< 𝑣× 𝑏 then 𝑖 ←𝑖+1 else 𝑖 ← 0
11 𝑏 ←𝑏
/* Step 3: Diversity maximisation */
12 j = 0
13 while 𝑗 < 𝑐 do
14 𝑃
"
← Generate new r instances via mutation and crossover from P with objective values better than b
15 𝑃
∴
← Select r best diverse instances from 𝑃
"
∪ 𝑆
16 end while
17 if diversity of 𝑃
∴
is more than S then 𝑆 ←𝑃
∴
else 𝑗 ←𝑗+1
18 end while
ECTA 2022 - 14th International Conference on Evolutionary Computation Theory and Applications
20

where A is the distance matrix of the set without that
particular instance,
𝑀 =
𝐴𝑏
𝑏
𝑐
,
𝑀
=
𝐴
̅
𝑏
𝑏
𝑐̅
, c
and 𝑐̅ are single elements, b and 𝑏
are vectors and 𝑏
and 𝑏
are their transpose.
4 VALIDATION OF SYNTHETIC
DATASET
4.1 Evaluation Method
The learning classifiers used to evaluate the generated
data are Naïve Bays (NB), Decision Tree (DT), k-
Nearest Neighbour (KNN), and Support Vector
Machine (SVM), and Random Forest (RF). We
choose KNN and RF as they are sensitive to
imbalanced data based on their model assumptions
(Muñoz et al., 2018). DT works based on developing
decision regions which are influenced by re-sampling
methods (Chawla, 2010). SVM with radial kernel is
effective to classify classes which are not separable
linearly.
We measure the performance of the classifiers on
test data using F1-score, G-means, and PR-AUC as
classification accuracy is not an appropriate measure
for imbalanced data.
To calculate F1-score (5), we need to measure
recall and precision shown as (3) and (4). Recall is the
proportion of correctly predicted positive instances to
all instances in the positive class. Precision is the
proportion of correctly predicted positive instances to
all predicted positive instances
.
R𝑒𝑐𝑎𝑙𝑙 =
(3
)
P𝑟𝑒𝑐𝑖𝑠𝑖𝑜𝑛 =
(4
)
F1=
××
(5
)
PR-AUC denotes the area under the Precision
Recall curve, is a suitable measure for classifiers’
performance especially in the situation of imbalanced
data and is independent of the decision boundary.
The G-means (7) is the geometric mean of true
positive rate (TPR), as (6) and true negative rate
(TNR), which is 1 −𝐹𝑃𝑅.
𝑇𝑃𝑅 =
𝑇𝑃
𝐹𝑁+ 𝑇𝑃
(6)
𝐺−𝑚𝑒𝑎𝑛𝑠=
√
𝑇𝑃𝑅 × 𝑇𝑁𝑅
(7)
4.2 Synthetic Dataset
To examine our proposed methods under different
scenario, 4 2-dimensional datasets are created. There
is an equal split (2) of datasets with an imbalanced
ratio (IR) of 10% and IR of 5%. These datasets are
used in our initial experiments to assist in hyper-
parameter selections. Table 1 provides a summary of
these datasets (DS1-4). There is a varying amount of
cluster within each DS, ranging from 0 (randomly
distributed data points) in DS3 to 5 in DS1. For each
of the 4 synthetic datasets, instances are randomly
divided into training and test datasets with a 75:25
split. DADO, DIWO and our proposed method CDO
are utilised to balance our training datasets. Learning
classifiers are applied onto the balanced training
datasets. Performance of these constructed learning
classifiers is then assessed using the test datasets.
Performance measures (F1, G-Means, and PR-AUC)
are computed for the best performing classifier. The
above process is repeated 30 times.
Table 1: Synthetic datasets characteristics.
Dataset Number of
Clusters
Data
Points
Imbalance
Ratio
DS1 5 200 10%
DS2 2 300 10%
DS3 0 300 5%
DS4 1 300 5%
4.3 Parameter Selection
The distance measures chosen for both objective
function and diversity measure are the optimal
distance measure based on experimental results
(Khorshidi & Aickelin, 2021). Euclidean distance
measure (𝐷
) is chosen for DADO, and Canberra
(𝐷
) is chosen for DIWO.
𝐷
(
𝑥, 𝑦
)
=
∑ (
𝑥
−𝑦
)
(8
)
𝐷
(
𝑥, 𝑦
)
=
∑
|
|
|
|
|
|
(9
)
Next, we aim to determine the optimal values for 2
hyper-parameters for DBSCAN, Epsilon (eps) and
Border Point (p). We examine the eps using 10
different parameter values, ranging from 0.05 to 50.
A binary pair (“T”, “F”) of p is also examined. Based
on parameter testing result on datasets (DS1, DS2,
DS3, DS4), eps = 0.05 and p = “T” are selected.
4.4 Synthetic Experiment Results
CDO is compared alongside DADO and DIWO on
synthetic datasets. In total, there are 4 synthetic
datasets available and the performance of each of the
3 algorithms are evaluated. 12 different results are
summarised in Table 2. CDO performs better than
Cluster-based Diversity Over-sampling: A Density and Diversity Oriented Synthetic Over-sampling for Imbalanced Data
21
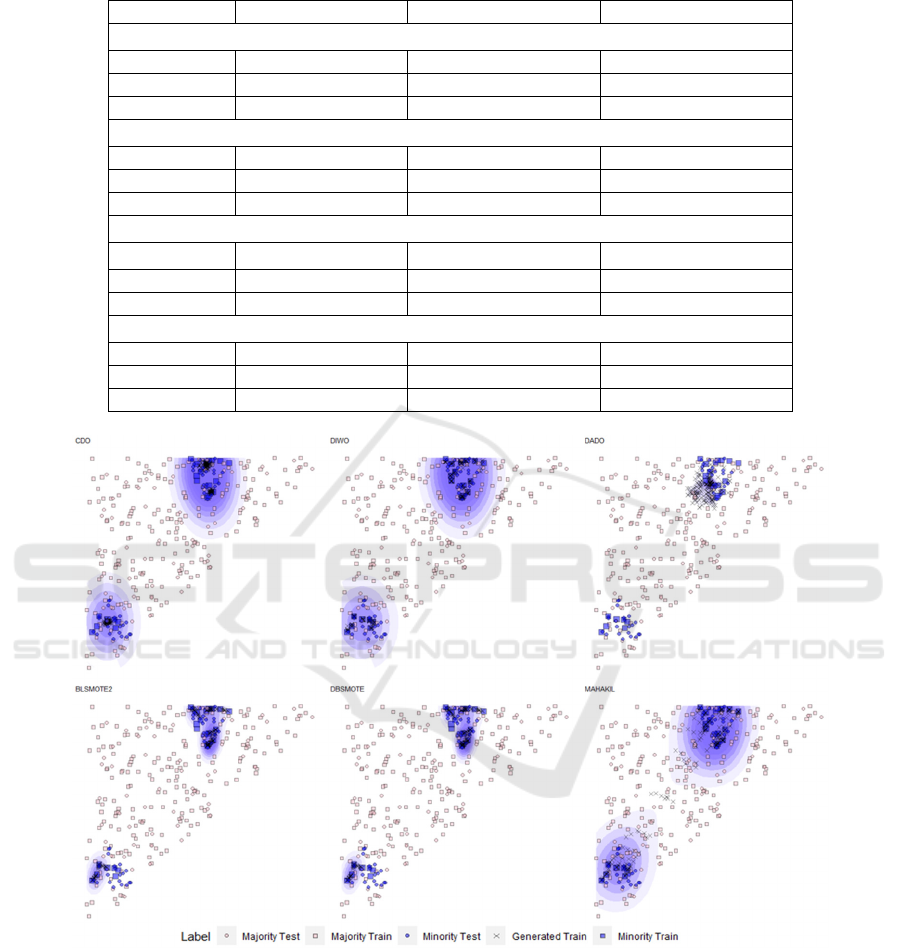
Table 2: Performance results of mean and standard error for each measure across synthetic datasets. Bold numbers indicate
the mean of method performance is the best among all comparable methods.
DADO DIWO CDO
DS 1
F1 0.3516 (± 0.131) 0.4586 (± 0.176) 0.4601 (± 0.179)
G-means 0.6341 (± 0.194) 0.8498 (± 0.080) 0.8456 (± 0.084)
PR-AUC 0.9439 (± 0.030) 0.9594 (± 0.026) 0.9603 (± 0.026)
DS 2
F1 0.1805 (± 0.067) 0.4219 (± 0.116) 0.4244 (± 0.105)
G-means 0.4012 (± 0.182) 0.8342 (± 0.048) 0.8158 (± 0.042)
PR-AUC 0.9516 (± 0.019) 0.9786 (± 0.024) 0.9792 (± 0.023)
DS 3
F1 0.1333 (± 0.047) 0.1092 (± 0.063) 0.1092 (± 0.063)
G-means 0.0693 (± 0.176) 0.4733 (± 0.216) 0.4638 (± 0.250)
PR-AUC 0.9706 (± 0.020) 0.9684 (± 0.022) 0.9687 (± 0.021)
DS 4
F1 0.8623 (± 0.107) 0.8632 (± 0.113) 0.8679 (± 0.099)
G-means 0.9861 (± 0.014) 0.9926 (± 0.007) 0.9907 (± 0.009)
PR-AUC 0.9973 (± 0.011) 0.9974 (± 0.011) 0.9974 (± 0.011)
Figure 1: Plots for synthetic datasets, blue area indicates minority generation density.
DADO in all evaluation metrics over 3 of 4 datasets.
CDO performs better in 2 of 3 evaluation metrics to
DIWO, when 2 or more clusters are detected (DS1
and DS2). CDO outperforms in 1 of 3 evaluation
metrics for DS 3, and 2 of 3 evaluation metrics for
DS4, where datasets have less than 2 clusters
4.5 Graphical Representation
To provide a graphical representation of the synthetic
datasets generated by CDO and its 5 comparable
methods (BL-SMOTE, DB-SMOTE, DIWO, DADO
and MAHAKIL), we created a seperate synthetic
dataset with two clusters, 5% imbalanced ratio in
testing data with a balanced ratio in training data. The
ECTA 2022 - 14th International Conference on Evolutionary Computation Theory and Applications
22

generated minority data for each algorithm is
displayed in Figure 1. We observe that the region of
synthetic generated instances for CDO, DIWO and
MAHAKIL is relatively similar. However, CDO
stands out for its ability to cover all the data points of
the minority test data with the narrowest region.
MAHAKIL created synthetic data points between the
2 clusters, which occupies a larger region and could
result in over-generalisation and higher false positive
rate. For DADO, BL-SMOTE and DB-Smote, the
region of generated data does not cover all of minority
test data points, which could result in higher false
negative rate.
5 VALIDATION
We validate the proposed CDO algorithm against an
assortment of 10 imbalanced datasets, with varying
dimensions. The datasets and their characteristics are
described in Table 3, and “Ratio” is used to indicate
the original proportion of majority to minority
instances. To replicate the scenarios with low and
extremely low imbalanced ratio, we reduce the
imbalanced ratio to 5% and 10 absolute count of
minority instances.
The data within each of the real-world datasets are
randomly divided into train and test datasets using a
75:25 split respectively. This process is repeated for
30 iterations, resulting in 30 unique variations of
training datasets and accompanying test datasets for
each of the 10 real-world datasets. After the
initialisation step, we apply our proposed method,
CDO, alongside with existing methods in the
literature, namely BL-SMOTE, DB-SMOTE and
MAHAKIL to evaluate algorithm performance. Six
learning classifiers (GLM, NB. DT, KNN, SVM, NN)
are then constructed on each of the training datasets
(n=30). Subsequently, the trained classifiers are
applied onto test datasets.
For each real-world datasets, the best performing
classifier is selected, and we compute the mean and
standard error of the performance measures as F1,
AUC and G-mean. Additionally, we examine the
statistical significance of differences for the
performance measures obtained from CDO, BL-
SMOTE, DB-SMOTE and MAHAKIL using a non-
parametric test, Mann-Whitney test.
5.1 Experimental Results
The mean and standard error (stated in parenthesis) of
our proposed method (CDO) and its comparable
methods (BL-SMOTE, DB-SMOTE and
MAHAKIL) are presented in Table 4 and 5, with 5%
imbalanced ratio and 10 minority instances.
By looking at the performance metrics for 5%
imbalanced ratio (Table 4), it can be concluded that
CDO shows encouraging result as it outperformed its
comparable algorithms in terms of F1 score and G-
Means in 5 out of the 10 datasets. Additionally, CDO
outperformed other comparable methods in 6 out of
the 10 datasets based on PR-AUC.
By looking at the performance metrics for 10
minority instances (Table 5), CDO shows promising
result as it outperformed its comparable algorithms in
terms of F1 score in 4 out of the 10 datasets. It
outperformed other comparable methods in 5 out of
the 10 datasets based on PR-AUC. CDO performed
equivalently well to MAHAKIL in G-Means.
Table 3: Real-word Data Description.
Dataset Name Dim Size Ratio Dataset Name Dim Size Ratio
D1 Wisconsin 9 683 65-35 D6 Glass (0,1,2,3 vs 4,5,6) 9 214 76-24
D2 Diabetes 8 768 65-35 D7 Haberman 3 306 74-26
D3 Ecoli (0,1 vs 5) 6 240 90-10 D8 New Thyroid 5 215 84-16
D4 Ecoli 2 7 336 85-15 D9 Pima 8 768 65-35
D5 Ecoli 3 7 336 90-10 D10 Wine Red Low vs High 11 280 75-25
Cluster-based Diversity Over-sampling: A Density and Diversity Oriented Synthetic Over-sampling for Imbalanced Data
23

Table 4: Performance results of mean and standard error across datasets with 5% imbalance levels. Bold numbers indicate
the mean of method performance is the best among all comparable methods.
F1
Dataset CDO BL-SMOTE DB-SMOTE MAHAKIL
D1 0.9528 (± 0.022) 0.9443 (± 0.023) 0.9487 (± 0.022) 0.9494 (± 0.023)
D2 0.4834 (± 0.067) 0.4639 (± 0.125) 0.4987 (± 0.096) 0.5964 (± 0.054)
D3 0.9091 (± 0.089) 0.8860 (± 0.095) 0.9113 (± 0.101) 0.9158 (± 0.086)
D4 0.8529 (± 0.091) 0.8467 (± 0.070) 0.8635 (± 0.074) 0.8221 (± 0.111)
D5 0.6441 (± 0.103) 0.6788 (± 0.083) 0.6600 (± 0.081) 0.6365 (± 0.109)
D6 0.8515 (± 0.065) 0.8004 (± 0.084) 0.8181 (± 0.081) 0.8378 (± 0.070)
D7 0.4327 (± 0.127) 0.2555 (± 0.151) 0.3747 (± 0.133) 0.4084 (± 0.139)
D8 0.9628 (± 0.046) 0.9458 (± 0.056) 0.9551 (± 0.043) 0.9571 (± 0.041)
D9 0.4845 (± 0.065) 0.4582 (± 0.120) 0.4888 (± 0.097) 0.5964 (± 0.054)
D10 0.6600 (± 0.105) 0.4915 (± 0.165) 0.5763 (± 0.127) 0.6317 (± 0.117)
G-Means
Dataset CDO BL-SMOTE DB-SMOTE MAHAKIL
D1 0.9681 (± 0.014) 0.9616 (± 0.017) 0.9646 (± 0.016) 0.9668 (± 0.015)
D2 0.5890 (± 0.050) 0.5690 (± 0.102) 0.6025 (± 0.073) 0.6861 (± 0.034)
D3 0.9521 (± 0.066) 0.9109 (± 0.087) 0.9415 (± 0.086) 0.9552 (± 0.065)
D4 0.9260 (± 0.041) 0.9130 (± 0.049) 0.9285 (± 0.043) 0.9108 (± 0.048)
D5 0.8890 (± 0.045) 0.9068 (± 0.053) 0.8841 (± 0.064) 0.8907 (± 0.042)
D6 0.8916 (± 0.059) 0.8378 (± 0.077) 0.8578 (± 0.075) 0.8854 (± 0.060)
D7 0.5883 (± 0.085) 0.3963 (± 0.132) 0.5541 (± 0.090) 0.5767 (± 0.082)
D8 0.9847 (± 0.023) 0.9581 (± 0.047) 0.9762 (± 0.028) 0.9789 (± 0.026)
D9 0.5885 (± 0.050) 0.5671 (± 0.098) 0.5966 (± 0.073) 0.6861 (± 0.034)
D10 0.7450 (± 0.089) 0.5874 (± 0.144) 0.6760 (± 0.115) 0.7442 (± 0.099)
PR AUC
Dataset CDO BL-SMOTE DB-SMOTE MAHAKIL
D1 0.9821 (± 0.062) 0.9778 (± 0.067) 0.9801 (± 0.065) 0.9815 (± 0.061)
D2 0.8279 (± 0.062) 0.8437 (± 0.062) 0.8268 (± 0.067) 0.8175 (± 0.065)
D3 0.9981 (± 0.003) 0.9978 (± 0.003) 0.9985 (± 0.002) 0.9981 (± 0.003)
D4 0.9803 (± 0.039) 0.9769 (± 0.039) 0.9796 (± 0.036) 0.9798 (± 0.038)
D5 0.9934 (± 0.004) 0.9927 (± 0.005) 0.9924 (± 0.005) 0.9925 (± 0.006)
D6 0.9559 (± 0.094) 0.9662 (± 0.068) 0.9614 (± 0.082) 0.9560 (± 0.094)
D7 0.8391 (± 0.056) 0.8222 (± 0.060) 0.8182 (± 0.060) 0.8238 (± 0.064)
D8 0.9990 (± 0.001) 0.9988 (± 0.002) 0.9989 (± 0.001) 0.9989 (± 0.001)
D9 0.8291 (± 0.062) 0.8433 (± 0.062) 0.8259 (± 0.067) 0.8175 (± 0.065)
D10 0.9578 (± 0.057) 0.9488 (± 0.066) 0.9517 (± 0.059) 0.9571 (± 0.056)
ECTA 2022 - 14th International Conference on Evolutionary Computation Theory and Applications
24

Table 5: performance results of mean and standard error across datasets with 10 minority instances. Bold numbers indicate
the mean of method performance is the best among all comparable methods.
F1
Dataset CDO BL-SMOTE DB-SMOTE MAHAKIL
D1 0.9465 (± 0.021) 0.9358 (± 0.029) 0.9453 (± 0.024) 0.9417 (± 0.025)
D2 0.3799 (± 0.085) 0.2176 (± 0.111) 0.3818 (± 0.081) 0.4434 (± 0.148)
D3 0.8490 (± 0.115) 0.8571 (± 0.105) 0.8725 (± 0.119) 0.8548 (± 0.130)
D4 0.8586 (± 0.082) 0.8438 (± 0.075) 0.8617 (± 0.077) 0.8330 (± 0.089)
D5 0.6509 (± 0.086) 0.6828 (± 0.093) 0.6763 (± 0.076) 0.6456 (± 0.101)
D6 0.8549 (± 0.070) 0.8187 (± 0.089) 0.8240 (± 0.081) 0.8672 (± 0.062)
D7 0.4398 (± 0.108) 0.2822 (± 0.121) 0.3788 (± 0.116) 0.4114 (± 0.118)
D8 0.9753 (± 0.029) 0.9510 (± 0.063) 0.9672 (± 0.037) 0.9716 (± 0.035)
D9 0.3980 (± 0.078) 0.2125 (± 0.114) 0.3846 (± 0.078) 0.4389 (± 0.141)
D10 0.6769 (± 0.074) 0.5128 (± 0.137) 0.6413 (± 0.091) 0.6525 (± 0.099)
G-Means
Dataset CDO BL-SMOTE DB-SMOTE MAHAKIL
D1 0.9625 (± 0.014) 0.9514 (± 0.027) 0.9588 (± 0.019) 0.9580 (± 0.020)
D2 0.5267 (± 0.062) 0.3454 (± 0.159) 0.5372 (± 0.055) 0.6261 (± 0.062)
D3 0.9128 (± 0.101) 0.8908 (± 0.094) 0.9073 (± 0.106) 0.9194 (± 0.096)
D4 0.9301 (± 0.044) 0.9122 (± 0.057) 0.9332 (± 0.042) 0.9188 (± 0.045)
D5 0.8918 (± 0.044) 0.8955 (± 0.060) 0.8975 (± 0.053) 0.8905 (± 0.051)
D6 0.8882 (± 0.066) 0.8516 (± 0.080) 0.8597 (± 0.074) 0.9029 (± 0.049)
D7 0.5905 (± 0.079) 0.4327 (± 0.107) 0.5432 (± 0.078) 0.5765 (± 0.080)
D8 0.9927 (± 0.011) 0.9675 (± 0.055) 0.9787 (± 0.030) 0.9889 (± 0.018)
D9 0.5310 (± 0.064) 0.3476 (± 0.156) 0.5364 (± 0.054) 0.6258 (± 0.061)
D10 0.7691 (± 0.068) 0.6105 (± 0.119) 0.7135 (± 0.071) 0.7467 (± 0.088)
PR AUC
Dataset CDO BL-SMOTE DB-SMOTE MAHAKIL
D1 0.9937 (± 0.004) 0.9855 (± 0.015) 0.9911 (± 0.008) 0.9919 (± 0.007)
D2 0.8099 (± 0.063) 0.7950 (± 0.071) 0.8131 (± 0.055) 0.8064 (± 0.059)
D3 0.9903 (± 0.023) 0.9888 (± 0.024) 0.9894 (± 0.023) 0.9882 (± 0.027)
D4 0.9838 (± 0.029) 0.9817 (± 0.028) 0.9825 (± 0.027) 0.9826 (± 0.028)
D5 0.9902 (± 0.020) 0.9901 (± 0.017) 0.9908 (± 0.016) 0.9893 (± 0.021)
D6 0.9609 (± 0.092) 0.9655 (± 0.075) 0.9625 (± 0.084) 0.9625 (± 0.086)
D7 0.8233 (± 0.065) 0.8139 (± 0.063) 0.8094 (± 0.069) 0.8127 (± 0.067)
D8 0.9923 (± 0.032) 0.9925 (± 0.030) 0.9923 (± 0.031) 0.9923 (± 0.032)
D9 0.8134 (± 0.062) 0.7963 (± 0.070) 0.8139 (± 0.054) 0.8085 (± 0.059)
D10 0.9586 (± 0.054) 0.9449 (± 0.064) 0.9535 (± 0.057) 0.9563 (± 0.053)
Cluster-based Diversity Over-sampling: A Density and Diversity Oriented Synthetic Over-sampling for Imbalanced Data
25

Table 6: performance results of Mann-Whitney test across datasets with 5% imbalance levels. Each figure reports the
frequency that the selected method is significantly better than its comparable methods within the same dataset (p < 0.05).
F1
Dataset CDO BL-SMOTE DB-SMOTE MAHAKIL Dataset CDO
B
L-SMOTE
D
B-SMOTE MAHAKIL
D1 3 0 0 1 D6 2 0 0 2
D2 0 0 1 3 D7 3 0 1 1
D3 0 0 0 0 D8 0 0 0 0
D4 1 1 1 0 D9 0 0 0 3
D5 0 3 0 0 D10 2 0 1 1
G-Means
CDO BL-SMOTE DB-SMOTE MAHAKIL Dataset CDO
B
L-SMOTE
D
B-SMOTE MAHAKIL
D1 2 0 0 1 D6 2 0 1 2
D2 0 0 1 3 D7 2 0 1 1
D3 0 0 1 1 D8 3 0 1 1
D4 1 0 1 0 D9 0 0 1 3
D5 0 3 0 0 D10 2 0 1 1
PR-AUC
Dataset CDO BL-SMOTE DB-SMOTE MAHAKIL Dataset CDO
B
L-SMOTE
D
B-SMOTE MAHAKIL
D1 1 0 1 1 D6 0 0 0 0
D2 1 3 1 0 D7 3 0 0 0
D3 0 0 0 0 D8 0 0 0 0
D4 0 0 0 0 D9 1 3 1 0
D5 0 0 0 0 D10 0 0 0 1
Table 7: performance results of Mann-Whitney test across datasets with 10 minority instances. Each figure reports the
frequency that the selected method is significantly better than its comparable methods within the same dataset (p < 0.05).
F1
Dataset CDO BL-SMOTE DB-SMOTE MAHAKIL Dataset CDO BL-SMOTE
D
B-SMOTE MAHAKIL
D1 1 0 1 0 D6 2 0 0 2
D2 1 0 1 3 D7 3 0 1 2
D3 0 0 2 0 D8 2 0 1 1
D4 2 0 2 0 D9 1 0 1 3
D5 0 2 2 0 D10 1 0 1 1
G-Means
CDO BL-SMOTE DB-SMOTE MAHAKIL Dataset CDO BL-SMOTE
D
B-SMOTE MAHAKIL
D1 2 0 1 0 D6 2 0 0 2
D2 1 0 1 3 D7 2 0 1 2
D3 0 0 1 1 D8 2 0 0 2
D4 2 0 2 0 D9 1 0 1 3
D5 0 0 0 0 D10 2 0 1 1
PR-AUC
Dataset CDO BL-SMOTE DB-SMOTE MAHAKIL Dataset CDO BL-SMOTE
D
B-SMOTE MAHAKIL
D1 1 0 1 1 D6 0 0 0 0
D2 1 0 0 0 D7 3 0 0 0
D3 0 0 0 0 D8 0 0 0 1
D4 1 0 0 0 D9 1 0 0 0
D5 0 1 1 0 D10 0 0 0 0
The Mann-Whitney test is performed for each
pairing of all 4 comparable methods. This implies that
there are 6 total combinations of pairings available.
Table 6 and 7 displays the results from the test, where
each figure represents the frequency that the specified
method is statistically better than its comparable
method.
From Table 6, CDO performs the best across 10
datasets where there is a 5% imbalanced ratio. It
statistically outperforms its comparable algorithms
on 11 occasions based on F1, 12 occasions based on
ECTA 2022 - 14th International Conference on Evolutionary Computation Theory and Applications
26

G-Means and 6 occasions based on PR-AUC.
MAHAKIL comes next in line in terms of
performance, where it statistically outperforms its
comparable methods on 11 occasions based on F1, 13
occasions based on G-Means and only 2 occasions
based on PR-AUC. Both BL-SMOTE and DB-
SMOTE only statistically outperform their
comparable methods on 4 occasions using F1. DB-
SMOTE performs significantly better when evaluated
using G-Means, where it outperformed its
comparable methods on 8 occasions. BL-SMOTE
comes last as it only statistically outperformed its
comparable methods on 3 occasions based on G-
Means and on 6 occasions based on PR-AUC.
From Table 7, CDO is the best performing
algorithm for 10 minority instances. It statistically
outperformed its comparable algorithms on 13
occasions based on F1, 14 occasions based on G-
Means and 7 occasions based on PR-AUC. For the
remaining algorithms, MAKAHIL is the 2nd best
performing algorithm as it statistically outperformed
its comparable methods on 12 occasions using F1, 14
occasions using G-Means and 2 occasions using PR-
AUC. DB-SMOTE comes 3rd, as it statistically
outperformed its comparable methods on 12
occasions using F1, 8 occasions using G-Means and
2 occasions using PR-AUC. BL-SMOTE comes last
as it barely outperformed other methods (2 occasions
using F1, 0 occasion on G-Means and 1 occasion on
PR-AUC).
6 DISCUSSIONS
As shown in the statistical test results, although CDO
outperforms MAHAKIL in most cases, CDO and
MAHAKIL have superior performance results when
compared to BL-SMOTE and DB-SMOTE. This can
be explained by their better ability to capture more
information when constructing minority generation
region. Both CDO and MAHAKIL consider the entire
minority class distribution and generating instances
within the boundaries of the identified data generation
region diversely. In contrast, SMOTE-based methods
typically create synthetic instances using linear
interpolation.
If we evaluate the statistical significance of
CDO’s performance, it has better performance
compared to MAHAKIL when minority instances
become more sparse. This is due to the nature of
MAHAKIL algorithm that it only performs well when
minority data distribution is convex and when there
are sufficient number of minority instances
(Khorshidi & Aickelin, 2021). In addition,
MAHAKIL algorithm does not consider clusters
within datasets, which results in a broader generation
region for minority instances and leads to a higher
false positive rate. The main reason for superiority of
CDO in comparison with MAHAKIL in terms of PR-
AUC is that MAHAKIL generates synthetic
instances, even though few, in the majority space (see
Figure 1). This leads to lower precision that can be
picked up by PR-AUC.
7 CONCLUSIONS
In this study, our key objective is to design an
algorithm which generates diversified synthetic
instances within the minority class while considering
the distribution of the minority data space. We
incorporate diversity optimization which optimises
both similarity to minority instances and diversity of
synthetic instances. The proposed algorithm first
utilises clustering technique to identify the
boundaries for the generation of minority instances
and preserve similarity between minority instances.
Subsequently, diversity optimization is incorporated
to promote diversity within clusters. The proposed
method CDO is evaluated on 10 real-world datasets,
and it has statistically superior performance to its
comparable methods. Its superior performance can be
attributed to its ability to identify the minority space
for synthetic data generation and its ability to obtain
optimal spread of generated instances due to genetic
algorithm. The proposed algorithm is evaluated on 2
class imbalance datasets. For future research, we
extend CDO to address multi-class imbalance
problems.
REFERENCES
Ali, A., Shamsuddin, S. M., & Ralescu, A. L. (2013).
Classification with class imbalance problem. Int. J.
Advance Soft Compu. Appl, 5(3).
Bennin, K. E., Keung, J., Phannachitta, P., Monden, A., &
Mensah, S. (2017). Mahakil: Diversity based
oversampling approach to alleviate the class imbalance
issue in software defect prediction. IEEE Transactions
on Software Engineering, 44(6), 534-550.
Chawla, N. V. (2009). Data mining for imbalanced datasets:
An overview. Data mining and knowledge discovery
handbook, 875-886.
Chawla, Bowyer, K. W., Hall, L. O., & Kegelmeyer, W. P.
(2002). SMOTE: synthetic minority over-sampling
technique. Journal of artificial intelligence research,
16, 321-357.
Cluster-based Diversity Over-sampling: A Density and Diversity Oriented Synthetic Over-sampling for Imbalanced Data
27

Ester, M., Kriegel, H. P., Sander, J., & Xu, X. (1996,
August). A density-based algorithm for discovering
clusters in large spatial databases with noise. In kdd
(Vol. 96, No. 34, pp. 226-231).
Japkowicz, N., & Stephen, S. (2002). The class imbalance
problem: A systematic study. Intelligent data analysis,
6(5), 429-449.
Khorshidi, H. A., & Aickelin, U. (2021). Constructing
classifiers for imbalanced data using diversity
optimisation. Information Sciences, 565, 1-16.
Lim, P., Goh, C. K., & Tan, K. C. (2016). Evolutionary
cluster-based synthetic oversampling ensemble (eco-
ensemble) for imbalance learning. IEEE transactions
on cybernetics, 47(9), 2850-2861.
Muñoz, M. A., Villanova, L., Baatar, D., & Smith-Miles,
K. (2018). Instance spaces for machine learning
classification. Machine Learning, 107(1), 109-147.
Protopapa, K. L., Simpson, J. C., Smith, N. C. E., &
Moonesinghe, S. R. (2014). Development and
validation of the surgical outcome risk tool (SORT).
Journal of British Surgery, 101(13), 1774-1783.
Sasaki, Y. (2007). The truth of the F-measure. Teach tutor
mater, 1(5), 1-5.
Sharma, S., Bellinger, C., Krawczyk, B., Zaiane, O., &
Japkowicz, N. (2018, November). Synthetic
oversampling with the majority class: A new
perspective on handling extreme imbalance. In 2018
IEEE international conference on data mining (ICDM)
(pp. 447-456). IEEE.
Tallo, T. E., & Musdholifah, A. (2018, August). The
implementation of genetic algorithm in smote
(synthetic minority oversampling technique) for
handling imbalanced dataset problem. In 2018 4th
international conference on science and technology
(ICST) (pp. 1-4). IEEE.
Thabtah, F., Hammoud, S., Kamalov, F., & Gonsalves, A.
(2020). Data imbalance in classification: Experimental
evaluation. Information Sciences, 513, 429-441.
Ulrich, T., & Thiele, L. (2011, July). Maximizing
population diversity in single-objective optimization. In
Proceedings of the 13th annual conference on Genetic
and evolutionary computation (pp. 641-648).
Yang, Y. Y., Akbarzadeh HA Khorshidi, H., Aickelin, U.
U., Nevgi, A. A., & Ekinci, E. E. (2021, February). On
the Importance of Diversity in Re-Sampling for
Imbalanced Data and Rare Events in Mortality Risk
Models. In 2021 Australasian Computer Science Week
Multiconference (pp. 1-8).
ECTA 2022 - 14th International Conference on Evolutionary Computation Theory and Applications
28
