
Scale Perception in VR for Urban Scale Environments: 360° Photos
versus Full 3D Virtual Reality
Claus B. Madsen
1 a
, Nicolai Steinø
2 b
, Andrei Iuliu Lucaci
1
, Emil O. Sandkvist
1
and Alexander Jonstrup
1
1
Computer Graphics Group, Aalborg University, Aalborg, Denmark
2
Urban Design Group, Aalborg University, Aalborg, Denmark
Keywords:
Virtual Reality, Perception, Distance Estimation, Architectural Visualization, Depth Cues.
Abstract:
The paper investigates the accuracy of scale perception in Virtual Reality (VR) for visualization of urban scale
environments. Specifically, we evaluate users’ scale estimation accuracy by subjecting them to an urban scale
environment using two different viewing modes: 360° monoscopic panoramas viewed in a VR headset, versus
a full stereoscopic 3D VR representation, also in a VR headset, allowing participants to move around. The
paper explores various aspects of this, including both ego- and exo-centric distance estimation, perception
of own height, and photographic realism of 360° modes. The main experimental result is that, somewhat
surprisingly, user distance estimation accuracy is higher in the monoscopic 360° viewing modes than in 3D
VR; in 3D VR participants on average underestimate distances by around 20%. Nevertheless, participants on
average feel significantly taller than normal in the 360° modes, whereas they feel normal height in 3D VR
mode. We conclude that more work is needed in order to properly understand the perceptual and cognitive
mechanisms behind scale perception in VR.
1 INTRODUCTION
Proposals for architectural projects in urban space
are often subject to public debate. Therefore, archi-
tects, and their clients through them, put effort into
visualizing such projects in the most favourable way.
Hence, architectural visualizations become important
artifacts of such debates. The evaluation of archi-
tectural visualisations may ultimately determine the
destiny of proposals, as they may impact decision-
making. Thus, it may be argued that they not only
influence the destiny of architectural projects, but also
the democratic processes leading to their approval or
dismissal.
With the advancements in VR in recent years, ar-
chitectural VR is rapidly becoming a feasible supple-
ment to traditional architectural visualization in the
form of still images and animations. Due to the im-
mersive nature of VR, it is potentially more persua-
sive than traditional forms of architectural visualiza-
tion. Therefore, faithful scale representation is of the
essence. To faithfully represent scale in VR, nonethe-
a
https://orcid.org/0000-0003-0762-3713
b
https://orcid.org/0000-0001-5272-1879
less, is not an innocent endeavour. The evaluation of
scale depends on multiple factors which relate to the
design of the immersive environment – i.e. the 3D
model – which is displayed, to the display technology
itself, and, as addressed in the context of this paper,
the mode of VR representation.
In this paper, we investigate a specific aspect of
scale perception in VR. In particular, we compare
360° panoramic representations to a full 3D modelled
VR experience of the same urban scale scene. The
rationale behind the study can be formulated as this:
• VR visualization of architectural projects is be-
coming increasingly popular, and, as argued
above, it has the potential to be a powerful tool
in such contexts
• Scale perception evaluated via distance estimation
has been proved to be compromised in full 3D
VR. Test participants typically underestimate dis-
tances in VR by around 20%, according to the lit-
erature on the subject
• 360° panoramas are a relevant alternative to full
3D VR, as they are potentially more easy to gener-
ate and more flexible to use, i.e. with stand-alone
VR headsets and smartphone based systems such
32
Madsen, C., Steinø, N., Lucaci, A., Sandkvist, E. and Jonstrup, A.
Scale Perception in VR for Urban Scale Environments: 360 Photos versus Full 3D Virtual Reality.
DOI: 10.5220/0011384900003323
In Proceedings of the 6th International Conference on Computer-Human Interaction Research and Applications (CHIRA 2022), pages 32-40
ISBN: 978-989-758-609-5; ISSN: 2184-3244
Copyright
c
2022 by SCITEPRESS – Science and Technology Publications, Lda. All rights reserved
as Google Cardboard
• To our knowledge no studies exist that compare
scale perception across those two viewing modes
(360° panorama vs. 3D VR)
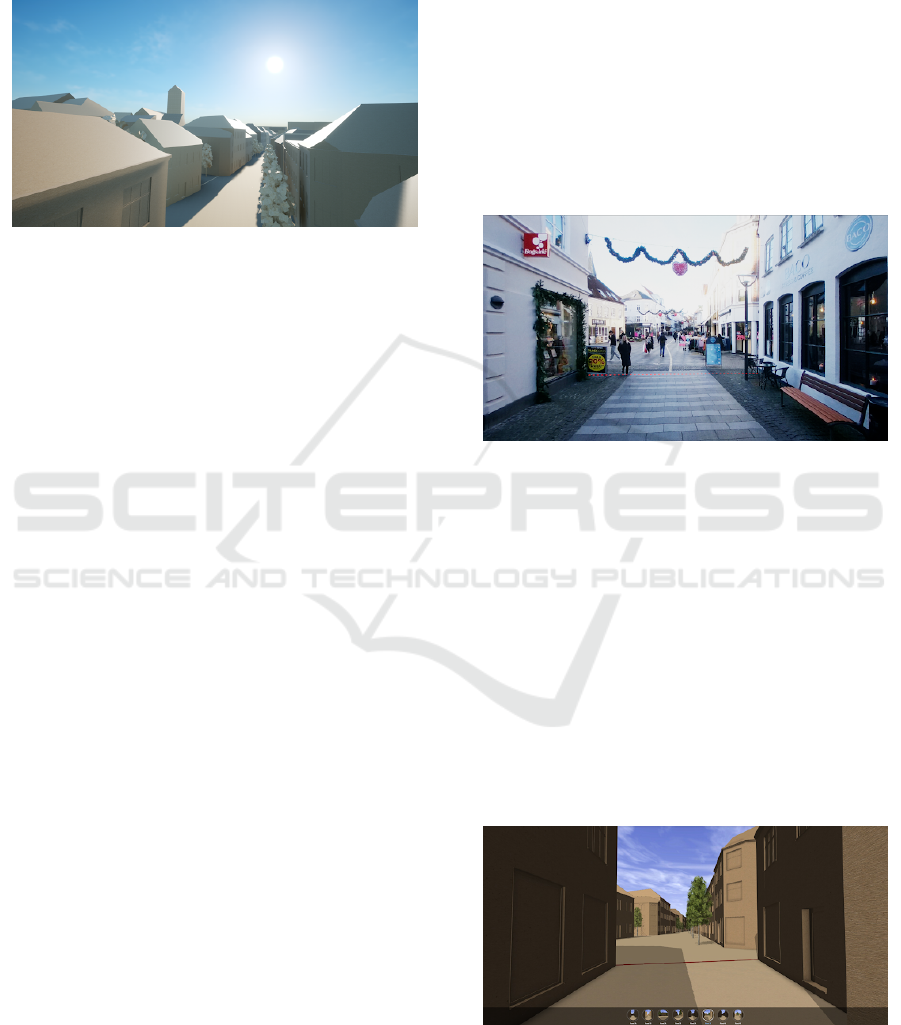
Figure 1: 3D model of section of pedestrian street used for
the experiment on scale perception.
Over the past decade or so, the topic of scale per-
ception or distance perception in VR has been ex-
tensively researched, and yet there are still many as-
pects that are poorly understood. Most research in-
dicates that distance perception in VR is compro-
mised. Specifically, the consensus is that distance
perception in VR is biased towards underestimation,
(Renner et al., 2013), (Interrante et al., 2006), (Loy-
ola, 2017), (Ng et al., 2016) (Peer and Ponto, 2017),
(Hornsey and Hibbard, 2021), (Jensen et al., 2020).
The literature even speaks of “distance mispercep-
tion” and “distance compression”, (Peer and Ponto,
2017). Most literature on the subject covers room
scale experiments, i.e., personal space (0m to 2m),
and the lower part of action space (2m to 30m), (Lu-
caci et al., 2022), (Renner et al., 2013). Vista space
(+30m) is still quite unexplored, but highly relevant
for urban scale architectural visualization. In this pa-
per we address the mid to upper part of action space,
by exploring scenes that extend to around 20m to 30m
from the test participant. The use of 360° visual rep-
resentation has also been compared to 3D VR solu-
tions, but primarily from an exploration and immer-
sion point of view, not from the point of view of evalu-
ation of scale perception, (Boukhris et al., 2017), (Rit-
ter and Chambers, 2021).
The main contribution of this paper is that we ex-
perimentally demonstrate that there is a significant
difference in how accurately test participants estimate
distances in the two modes. Our experiment sur-
prisingly shows that when exploring 360° panoramas,
participants can estimate distances quite accurately,
whereas, given a full 3D VR experience, participants
underestimate distances by about 20%.
2 VIEWING MODES
As mentioned, the aim of this paper is to investigate
how viewing modes influence scale perception in vir-
tual representations of small urban sub-environments,
where the key components of the environment are
well within the participant’s action space. By viewing
modes, we mean different “formats” in which the user
gets to visually experience the environment. We study
two fundamentally different viewing modes, each of
which have two “sub-modes”.
2.1 360° Photo
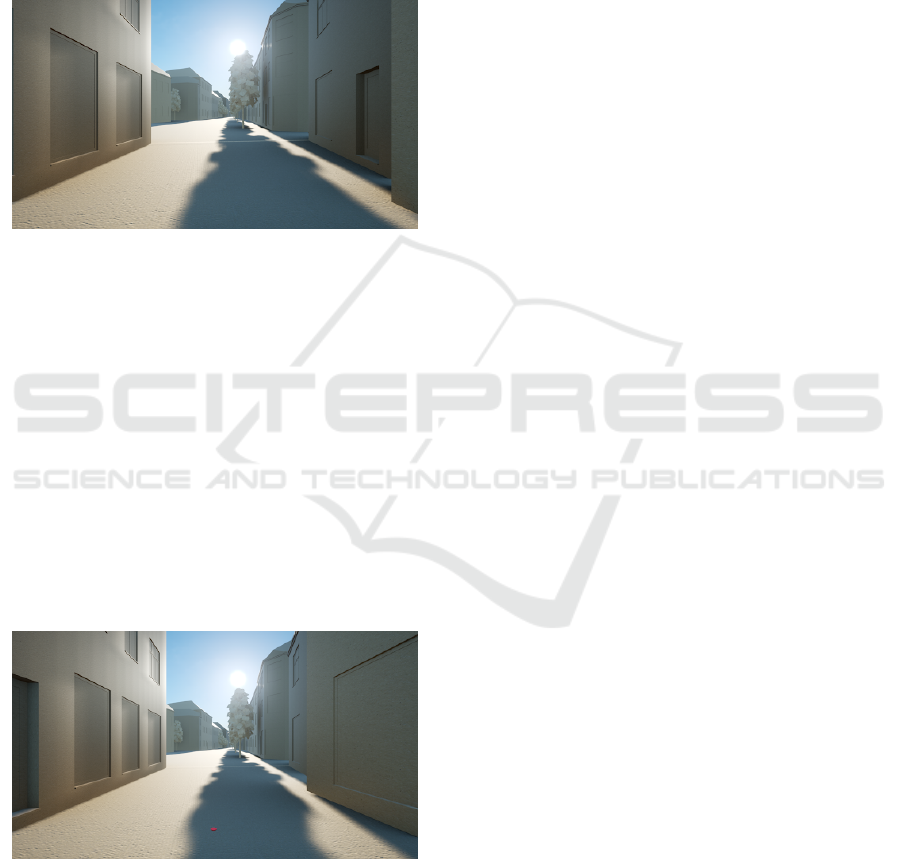
Figure 2: 360° photo of pedestrian street environment.
This viewing mode is included to investigate if pho-
tographic visual fidelity influences scale perception,
Figure 2. The 360° photos are shown to test partici-
pants in a Head Mounted Display (HMD). In this pa-
per all experiments are performed using Oculus Quest
2 HMDs. Both eyes are shown the same image, and
hence the experience does not provide stereoscopic
information. A Ricoh Theta Z1 360° camera was used
to capture all the 360° photos used in the tests. Each
of the 360° photos has a resolution of 6720x3360 pix-
els. Photos were taken from a height of 1.8 meters.
2.2 360° CityEngine
Figure 3: 360° visualization of pedestrian street environ-
ment rendered in CityEngine.
This viewing mode, rendered using the procedural
modeler CityEngine 2021.1, compares directly to the
Scale Perception in VR for Urban Scale Environments: 360 Photos versus Full 3D Virtual Reality
33
360° photo mode, although the visual aesthetics are
very close to those of the VR viewing modes (see be-
low). The 360° panoramas are presented to partici-
pants in an HMD and do not provide stereoscopic in-
formation. The 360° CityEngine panoramas are ren-
dered from a height of 1.8 meters, Figure 3.
2.3 3 DoF Unreal Engine
Figure 4: VR visualization of pedestrian street environ-
ment rendered in UnrealEngine; user is not allowed to move
around.
The 3 Degrees of Freedom (DoF) Unreal viewing
mode, Figure 4, is rendered in real-time using the
Unreal game engine. It is denoted 3 DoF, since the
test participant is experiencing the mode wearing an
HMD, but any translation done by the user does not
influence viewing position in the VR experience, i.e.
the participant only has 3 rotational degrees of free-
dom. Hence, from a mobility perspective, this mode
corresponds to the 360° modes, but offers stereo-
scopic information.
2.4 6 DoF Unreal Engine
Figure 5: VR visualization of pedestrian street environment
rendered in UnrealEngine; user is allowed to move around.
The 6 DoF Unreal viewing mode, Figure 5, is ren-
dered in real-time using the Unreal game engine. The
participant has 6 DoF, i.e. can move around freely
(within an approx. 3x3m exploration area). The mode
is experienced wearing an HMD, providing stereo-
scopic information. Teleportation is not enabled; the
participant can only move within the exploration area.
2.5 Summary of the Viewing Modes
Intuitively, we would expect test participants to strug-
gle with scale perception in the 360° modes, since
there is no binocular stereo, nor any motion parallax
from moving around. The 360° photo mode might
offer an advantage over the 360° CityEngine mode
given the photographic realism and higher density of
pictorial cues. Conversely, we would expect test par-
ticipants to perform better in the 3 DoF Unreal mode
than in the 3 DoF CityEngine; they have similar aes-
thetics and amount of pictorial cues, but the former
offers binocular stereoscopic information. Finally, the
6 DoF Unreal mode offers binocular information and
motion parallax arising from test participants’ trans-
lation motion, and thus participants should have good
conditions for scale perception.
3 SCALE PERCEPTION IN VR
Virtual Reality is most commonly experienced using
a HMD, for example the Oculus Quest 2 used for
this research. The performance of such ordinary con-
sumer HMDs is now truly amazing compared to just
a few years ago, and consumer VR is definitely be-
coming mainstream. Good as they may be, commer-
cially available HMDs suffer a wide range of chal-
lenges from a perceptual point of view, which consti-
tute a challenge in terms of allowing users to faith-
fully/realistically experience the dimensions, or sense
of scale, as it were, of virtual representations of archi-
tectural spaces, be it indoor or outdoor.
The most obvious challenges are related to sen-
sory aspects: limited field-of-view, limited image res-
olution (although very high end HMDs, such as the
Varjo VR and XR series, are now coming close to
retinal image resolution), limited dynamic range (in-
ability to realistically represent the dynamic range of
luminance levels known from the physical world), the
so called vergence/accommodation conflict (HMDs’
inability to provide a natural relationship between
where your eyes converge and where they accommo-
date), etc.
Slightly less obvious are challenges that relate
more to a perceptual level: lacking visual representa-
tion of the user’s body inside the VR experience (you
do not see yourself when looking down), lacking abil-
ity to move around across larger distances (VR track-
ing typically only supports a few meters of positional
CHIRA 2022 - 6th International Conference on Computer-Human Interaction Research and Applications
34

movement, which is insufficient for naturally moving
around in a large indoor VR scene, let alone an out-
door scene), lacking or inconsistent audio (humans’
perception of space is not only visual but also relies
heavily on audio perception of reverberation effects;
this is often overlooked in VR representations of ar-
chitectural use cases).
In essence, the challenges regarding faithful per-
ception of space, distance, scale, etc. in VR repre-
sentations are substantial. Quite specifically, current
research indicates that distance perception in VR is
compressed, i.e., users’ estimation of distances in VR
are approximately 20% lower than the same users’ es-
timation of distances in real life, (Jensen et al., 2020).
Being able to accurately estimate distances is not the
only important factor in perceiving scale, but it is ob-
viously related.
4 METHODS
In this section we describe the approaches we have
taken, and the choices we have made, towards de-
signing a way to experimentally evaluate how view-
ing mode influences accuracy of distance estimation.
First we discuss our approach to letting test partici-
pants evaluate distances in the various modes. Sub-
sequently we describe central aspects of the technical
implementation behind the experiments.
4.1 Estimating Distances in Viewing
Modes
The literature on distance estimation in VR separates
distances into ego-centric distances (distances from
one self to some location in the environment) and exo-
centric distances (distances between two environment
locations), (Renner et al., 2013). We believe both to
be equally important for the purpose of evaluating ur-
ban scale architecture in VR, and hence include both
types in our experiment (Fig. 3). The literature is also
extensive in terms of which method to apply when
getting test participants to estimate experienced dis-
tances, e.g. (Peer and Ponto, 2017). Examples of
applied methods are verbal reporting, blind walking,
throwing, etc. We opt for verbal reporting for two
main reasons: 1) it is the method that best suits having
360° viewing modes in the experiment, and 2) blind
walking, although most popular for VR research, is
not realistic for scenarios of mid to upper action space
dimension (10m or higher), as it can be challenging to
find a suitable environment for carrying out the exper-
iment.
In terms of test participant locomotion in the 6
DoF viewing mode, we opted to avoid teleportation.
Only 1-to-1 physical movement is possible for explor-
ing a local area of the virtual 3D scene, and partic-
ipants are only allowed to move within an approxi-
mately 3m by 3m area, and there is a mark on the
ground in the virtual environment, where the partic-
ipants is to return to prior to verbally reporting on
questions regarding estimated distances.
A final important thing regarding what the exper-
iment should entail, concerns test participants’ per-
ception of their own height in the different viewing
modes. As described, the two 360° modes are pre-
sented to participants as monocular experiences. This
causes perceptual confusion, especially when looking
down on the ground, as the only perceptually plausi-
ble explanation for experiencing no binocular dispar-
ity is that what is viewed must be located at infinity.
Thus, participants should subjectively feel “floating”
high above the ground. For the 3 DoF and 6 DoF VR
modes, test participants do perceive the correct stereo
disparities, but, similarly to the 360° modes, there is
no visual representation of self when looking down
(you do not see your own legs and feet). For these
reasons we included into the experiment that test par-
ticipants would be asked to verbally answer whether
they felt shorter than normal, normal height, or taller
than normal.
4.2 3D Model
The VR models for the user tests are made using a
workflow developed for the production of architec-
tural urban VR scenarios using parametric urban de-
sign to feed a VR model. This is done within a soft-
ware framework comprising open GIS data (as a basis
for the parametric generation of real-world urban en-
vironments), the CityEngine (CE) parametric urban
modeler (for the parametric generation of 3D urban
models), and the Unreal Engine (UE) game engine
(for the preparation of the final rendered VR model).
While the parametric modeling approach poten-
tially allows for model representation at different lev-
els of detail (LOD) and texture sets, for the tests pre-
sented in this paper, a consistent LOD and textur-
ing was chosen using the metaphor of two types of
cardboard (plain and corrugated) architectural scale
model. Geometrically, detailing was limited to adding
windows, doors, pitched roofs, and cornices to build-
ings. Ground surfaces were textured using the same
corrugated cardboard texture as for the buildings with
no accentuation of curbs or other 3D features of the
horizontal plane. While the 3D model represents
a real-world urban space, which, in reality, has a
Scale Perception in VR for Urban Scale Environments: 360 Photos versus Full 3D Virtual Reality
35
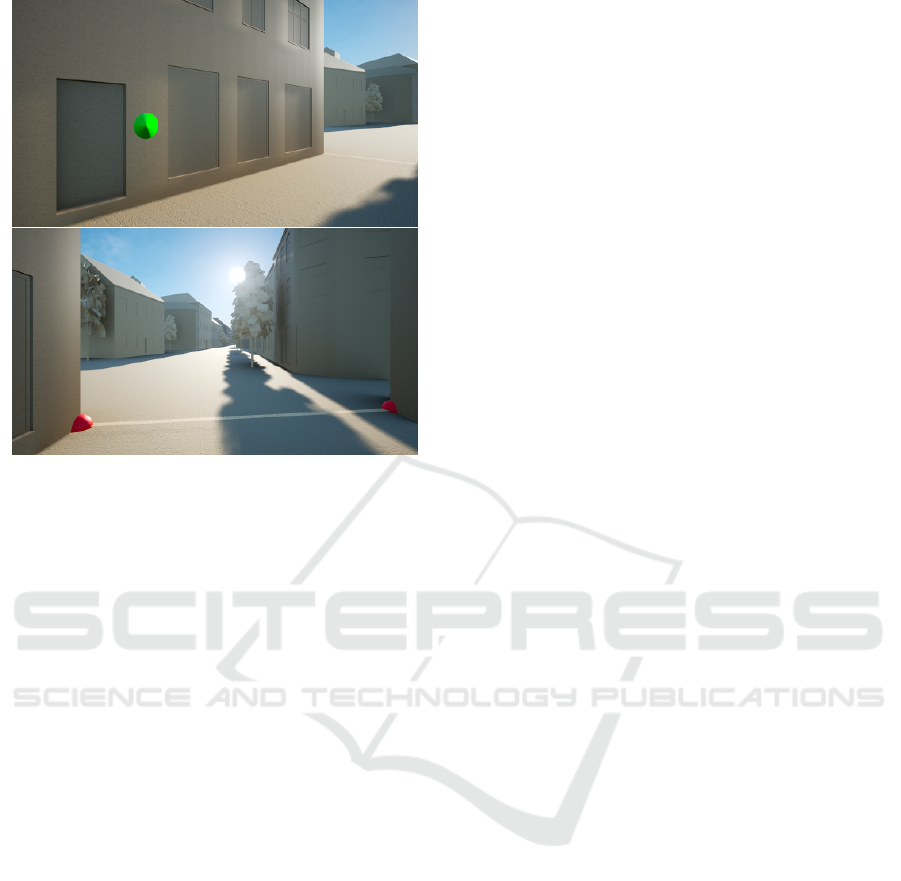
Figure 6: Top: ego-centric distance estimation is evalu-
ated by asking participants what they believe to be the dis-
tance from themselves to a feature indicated in the environ-
ment. Bottom: exo-centric distance estimation is evaluated
by asking participants what they believe to be the distance
between two indicated features in the environment. These
examples are from the 6 DoF Unreal viewing mode; the
same approach is adopted for all viewing modes.
slightly sloping ground, the model was simplified so
that buildings were projected onto a perfectly hori-
zontal plane.
Compared to a simple 3D model where buildings
are represented as simple, white boxes, the addition
of geometric (3D) architectural detailing as described
offers depth cues. While doors and building floors
(as indicated by the vertical distribution of windows)
offer scale cues which relate to the human body (hu-
man scale), niches for doors and windows generate
cast shadows and ambient occlusion for spatial feel
and depth cues. The choice of cardboard texturing
(the architectural scale model metaphor), as opposed
to more photorealistic texturing (i.e. real-world fa-
cade and pavement textures) was chosen in order to
achieve a convincing feel of the model. In order to ap-
pear convincing, real-world texturing requires a high
level of geometric detailing in terms of recesses and
protrusions in facades, doors and other building parts.
The same is true for pavements with all the geomet-
ric imperfections which they typically have in the real
world.
The assumption is, that when choosing the archi-
tectural scale model metaphor instead, the VR model
will be more convincing to the eye, as a scale model
from simple materials like plain and corrugated card-
board is not expected to have the same level of detail
as a real-world urban space. In other words, people
are more tolerant with architectural scale models –
they do not expect them to be “photo realistic” – and
thus accept less detail.
4.3 Viewing Modes
The real-world 360 Photo testing environment is cre-
ated in Unreal Engine as a map separate from the
other environments. This environment uses a self-
illuminating two-sided material wrapped on a simple
sphere object. The VR camera is placed in the origin
point of the world, with the sphere acting as the envi-
ronment. The 360° model panoramas are generated in
CityEngine and displayed using the ArcGIS 360 web-
based VR viewing platform with the Google Chrome
browser. Hence, this experimental setup is used out-
side of Unreal Engine. The 3DoF and 6DoF viewing
modes are created in Unreal Engine and are composed
of a map that contains the imported 3D model from
CityEngine and a map containing the lighting condi-
tions. In this way, the model can be re-imported or
replaced under the same dynamic lighting conditions.
4.4 Lighting
The Virtual Reality Environment (VRE) was achieved
using Unreal Engine 4.27. The default shading
method is used due to its costly yet higher render ca-
pability. Lighting in the scene is composed of a di-
rectional light of intensity 20 lux units, with a tem-
perature of 5900 kelvin. Furthermore, a Sky Light
component is used to capture further parts of the en-
vironment and apply them as light. In this compo-
nent, real-time capture is used to achieve dynamic and
specular lighting. The intensity of this component is
set to 3 units. This represents the total energy emitted
by the capture. A SkyAtmosphere component is used
to simulate the atmosphere along with the light scat-
tering associated with it. Two reflection probes are
placed in the scene to capture the reflections. These
probes are placed to cover all the areas around the
testing zone. Lastly, the Engine Scalability settings
and Material Quality Level are set to “Epic”, which is
the highest graphical setting that can yield acceptable
frame rates in VR.
4.5 Textures
The model is composed from two Physically Based
Rendering (PBR) textures. The ground texture resem-
bles corrugated cardboard whereas the building tex-
ture resembles plain cardboard. Both textures use a
CHIRA 2022 - 6th International Conference on Computer-Human Interaction Research and Applications
36
world aligning method to the origin point instead of
the classical UV coordinate method. This method al-
lows for a more precise calibration of textures in re-
gard to scale for static objects.
4.6 Navigation
Navigation through the different testing conditions is
achieved using a User Interface that can be called by
pressing the B button on the Oculus Quest’s right con-
troller. The menu appears attached to the left con-
troller and can be interfaced by both controllers.
5 EXPERIMENT DESIGN
The aim is to design an experiment to evaluate the ac-
curacy and precision of distance estimation across the
four viewing modes described above. Hence, from an
experiment design perspective, viewing mode repre-
sents the independent variable (with four conditions)
which we assume will have an influence on the de-
pendent variable, in the form of the accuracy of par-
ticipants’ estimated ego- and exo-centric distances.
The experiment comprises four different exo-
centric distance features. Each feature is made up of
two opposite building corners. On either side of these
features there are pre-determined viewpoints, Figure
7, which are used for creating the 360° panoramas,
and well as spawning points for the 3 and 6 DoF VR
modes. Each participant experiences all four viewing
modes, experiencing two features in each mode, to-
talling eight experiences. Hence, participants get to
see all features twice, but from different feature view-
points, and in different modes.
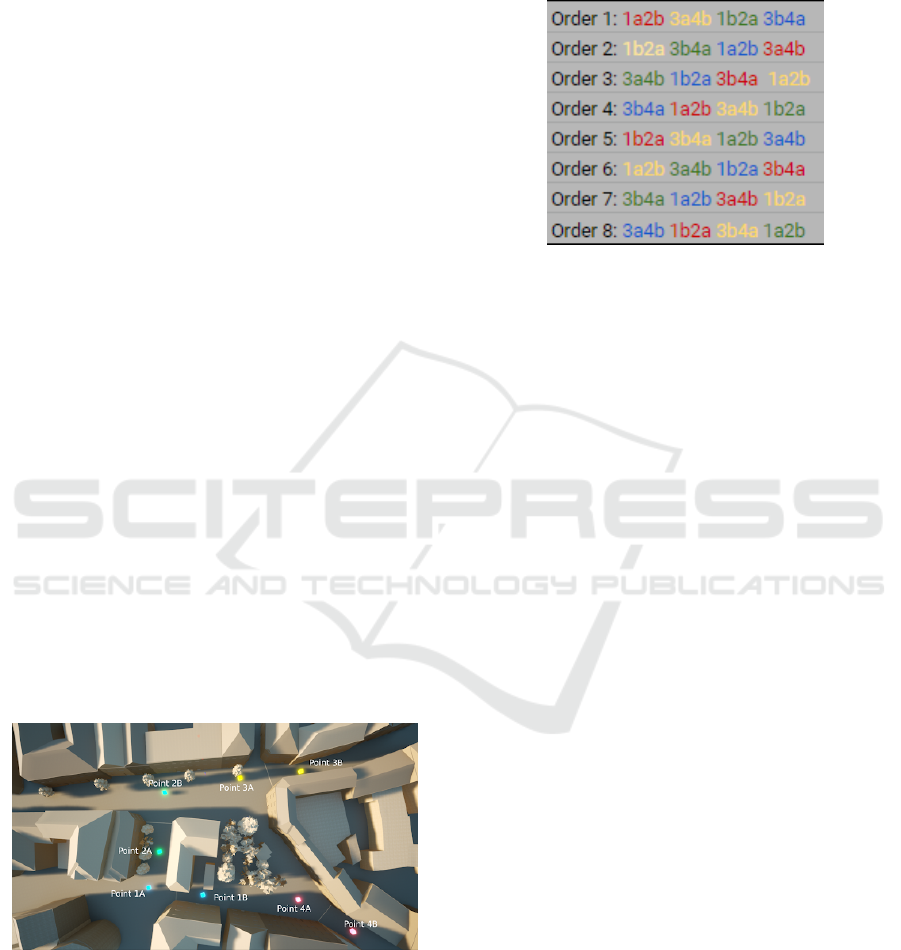
Figure 7: Overview of the urban environment modelled for
the experiment, and the location’s eight viewpoints. The
viewpoints form pairs (A and B) on either side of each exo-
centric distance feature (1-4) for test participants to esti-
mate.
As each participant experiences all modes, the ex-
periment is based on a within-subject design. To alle-
viate a potential carry-over effect between the condi-
tions, the order in which participants will be experi-
encing conditions is systematically arranged based on
the sequence shown in Figure 8.
Figure 8: Viewing location and mode order sequence: Col-
ors indicate viewing modes (red: 360° photo, yellow: 360°
CityEngine, green: 3 DoF Unreal, blue: 6 DoF Unreal),
numbers indicate locations (1 through 4), and letters indi-
cate viewing locations (a or b). The sequence repeats after
eight participants have been tested.
While the orders are not exhaustive in terms of
all of the permutations possible, they are sufficiently
“pseudo random” in the sense that within a full it-
eration of each order (1-8), each viewing location
will occur exactly twice, and across the full sequence,
each viewing mode will occur exactly twice for every
viewing location, thus offering an even distribution of
viewing locations for each participant, and an even
distribution of combinations of viewing locations and
modes across the experiment as a whole. With the
presented scheme, each viewing mode will be the first
experienced mode for one fourth of participants to
rule out bias and adaptation. Each test participant will
provide one “I feel shorter than normal, normal, taller
than normal” opinion for each of four modes, as well
as eight ego-centric distance estimates, and eight exo-
centric distance estimates.
5.1 Participants
32 participants were recruited, 22 male and 10 fe-
male with ages ranging from 20y to 32y (M=24.28y,
SD=2.63y) and heights ranging from 156cm to 195cm
(M=179.28cm, SD=9.36cm). Four of the participants
used contact lenses and five of the participants used
glasses. 27 of the participants had prior experiences
in using VR.
5.2 Procedure
Upon arrival, test participants were greeted and in-
troduced to the experiment. They were asked to
Scale Perception in VR for Urban Scale Environments: 360 Photos versus Full 3D Virtual Reality
37
sign a consent form allowing the data collected to be
used for analysis, and a demographics questionnaire
to enquire about relevant information such as their
height, age, possible visual impairments and experi-
ence with using VR. Subsequently, they were escorted
to the designated experiment area and equipped with
an Oculus Quest 2 HMD. The experiment would be-
gin and participants would go through each condition
until all four conditions had been tested. For each
condition, the participant would be asked the ego-
centric distance to a predetermined point on a wall
at the current viewing location followed by the exo-
centric distance between two street corners. For the 6
DoF condition specifically, the participants were sys-
tematically encouraged to move around.
6 RESULTS AND DISCUSSION
We start the analysis of the results by looking into
the test participants’ evaluation of how tall they felt in
the different modes. Getting a realistic sense of one’s
own height is very important for estimation of dis-
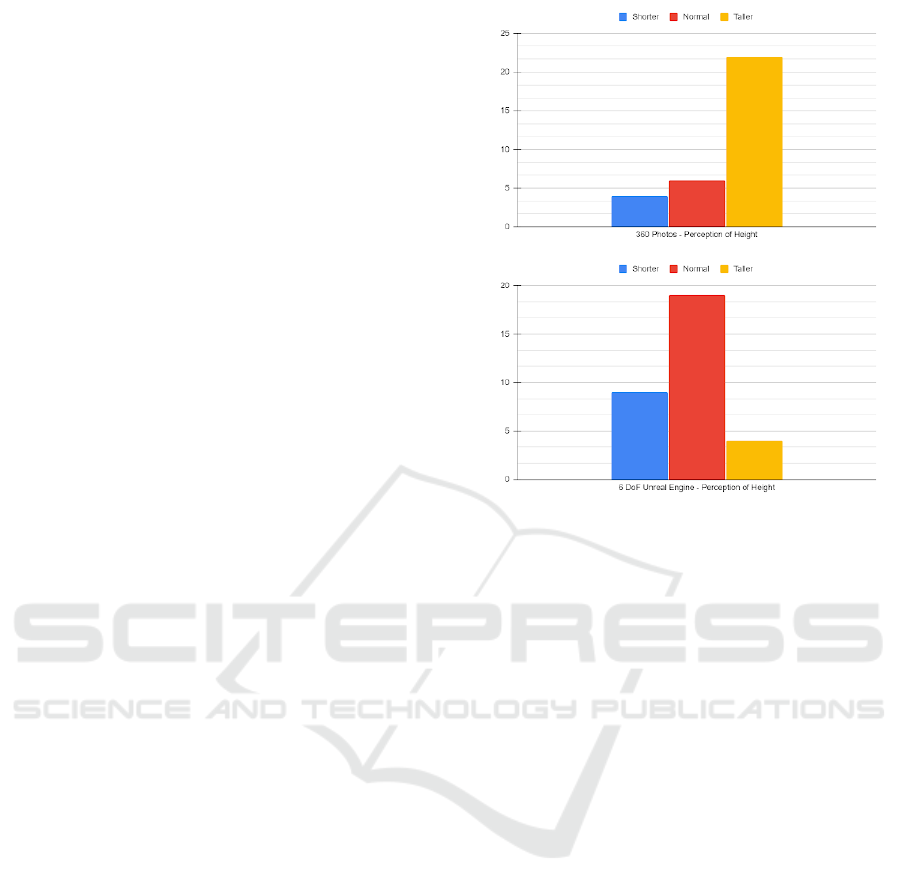
tances. Figure 9 clearly shows that test participants
generally felt taller than normal in the 360° modes
(the graph for 360° CityEngine mode is very similar
but not shown here), as 22 out of 32 participants in-
dicate feeling taller than normal. Conversely, 19 out
of 32 report feeling normal height in the 6 DoF Un-
real mode. The fact that 9 out of 32 participants feel
shorter than normal in the 6 DoF Unreal mode might
actually be an indication of distance compression, i.e.
that participant distance perception is biased towards
underestimation. All in all, though, the participants
generally report feeling taller than normal in the 360°
modes.
Turning towards the estimated ego- and exo-
centric distances, Figure 10 summarizes those results.
Qualitatively, merely from visual inspection of the
plots, it is clear that ego- and exo-centric distance
estimates follow the same overall pattern: distances
are perceived quite accurately in the 360° modes as
the medians of the normalized errors are very close
to zero (all are 0.0 apart from 360° CityEngine ego-
centric, where the median normalized error is -0.2,
but we cannot statistically prove a significant differ-
ence between 360° photo and 360° CityEngine modes
regarding ego-centric distances).
An ANOVA test shows that there are statistically
significant differences between the distance estimates
across modes for both ego- and exo-centric distances.
The ANOVA test was configured as a one-way test
with one independent variable (viewing mode) and
4 conditions (the 4 modes). The p-values for for
Figure 9: Top: test participants’ evaluation of their own
height in the 360° photo viewing mode. Bottom: similar
for the 6 DoF Unreal viewing mode.
the Null hypothesis (users perform equally well in
all modes) for the ego- and exo-centric cases were
0.00025 and 0.00013, respectively, indicating that
equal performance in all viewing modes is highly un-
likely.
A Tukey test was then performed to figure out
which viewing mode performances were statistically
significantly different from other viewing modes.
This Tukey test showed that the 360° CityEngine
mode performance is statistically significantly differ-
ent from either of the Unreal modes (3 or 6 DoF).
Hence participants, in this experiment, are statisti-
cally worse at estimating in 3 and 6 DoF Unreal. Or
in other terms: they perform worse in full binocular
VR than in the monocular 360° modes. The median
errors for the 3 and 6 DoF Unreal modes, combined
with ego- and exo-centric, are -0.23, -0.12, -0.29, and
-0.19, respectively. So, roughly 20% underestimation.
This is a surprising result. Why would the ab-
sence of binocular information lead to better per-
formance? Only more research and experimenta-
tion can answer this, but we may offer a few con-
jectures. Firstly, as mentioned previously, research
has consistently demonstrated 3D VR environments
to cause underestimation. So, our experiment is con-
sistent with that. And for the 360° modes, which
are experienced in the exact same HMD, partic-
ipants subconsciously experience a similar HMD-
induced effect, but the underestimation-effect might
CHIRA 2022 - 6th International Conference on Computer-Human Interaction Research and Applications
38
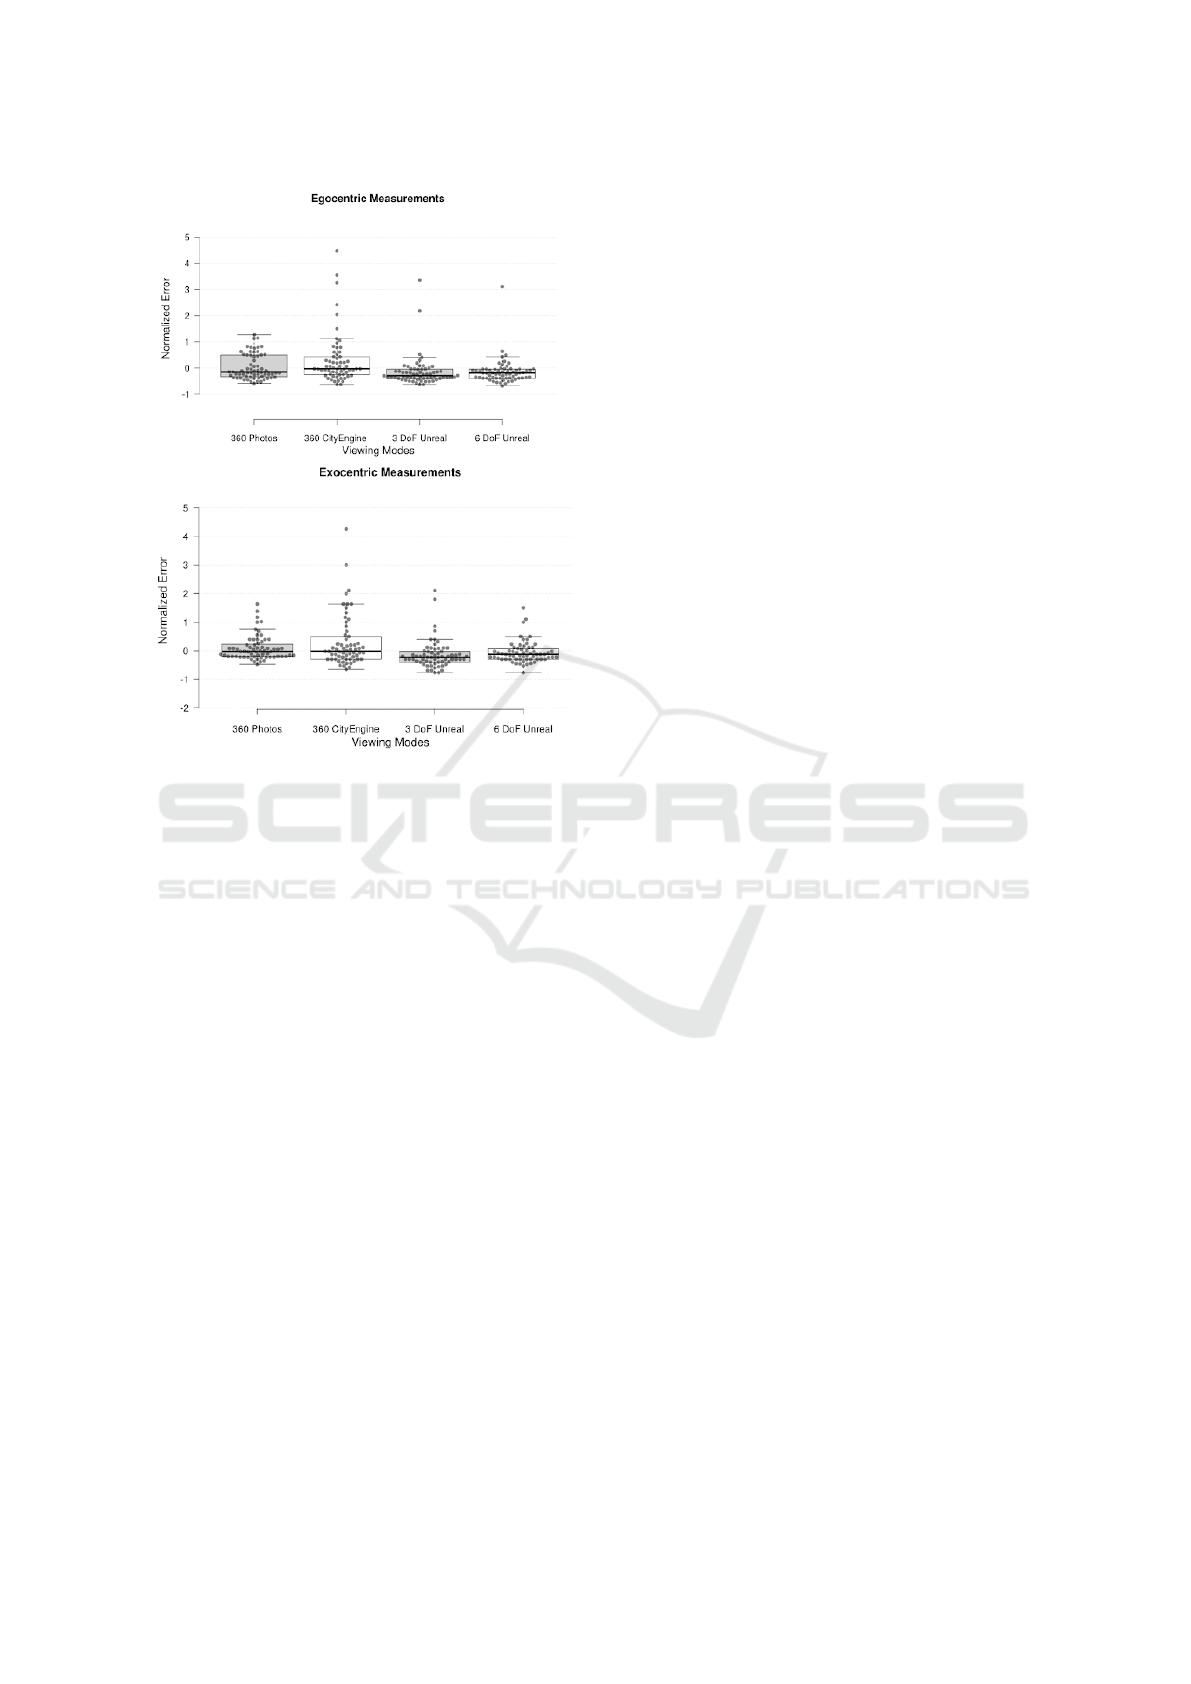
Figure 10: Top: ego-centric distance estimates across view-
ing modes. Bottom: exo-centric distance estimates. The
y-axis indicates normalized error. This number is computed
by subtracting the true value from the participant’s estimate,
and dividing by the true value. Hence a value of 0 means a
perfectly accurate distance estimate. A value of +1.0 corre-
sponds to overestimating the distance by 100%, and value
of -0.6 corresponds to underestimating the distance by 40%.
be offset/counter-acted by the “eerie” sense of being
very tall in the 360° modes, combined with the per-
ceptual stimuli of watching everything as being at in-
finity.
Our experiment did show some underestimation
of ego-centric distances in 360° photo mode (median
error -0.16), although not quite close enough for it to
be statistically significant. So, there is a noticeable
difference between ego- and exo-centric estimation.
We might conjecture that distance estimation in the
360° modes is a more cognitive process than a percep-
tual process due to the conflicting sensory information
and lower sense of immersion, leading participants to
rely solely on higher level cognitive estimation based
on familiarity with typical elements in the scenarios.
Perhaps this functions better for exo-centric distances.
Another interesting aspect of our experiment is
that the 360° photo and the 360° CityEngine results
are statistically very similar, even if the visual ap-
pearances/aesthetics are extremely different. Pho-
tographic realism and detail, versus stylised com-
puter graphics. This is somewhat contradicting other
research in the area, as consensus is that pictorial
cues aid distance perception, (Hornsey and Hibbard,
2021). The difference in our experiment may lie in it
being conducted in a mid to upper action space scale
scene, as opposed to other research focusing on room
scale (lower action space ranges).
7 CONCLUSIONS
The paper investigates distance perception in VR vi-
sualization of architecture at urban scale, i.e. outdoor
spaces in the 15m to 30m range. More specifically, we
investigate two different visualization modes: 360°
panoramas and full 3D VR environments, both expe-
rienced wearing an HMD (Oculus Quest 2).
It is demonstrated experimentally that test partic-
ipants systematically underestimate distances in 3D
VR, which is in alignment with the distance compres-
sion consensus in the research literature. The un-
derestimation is on the order of 20%. Conversely,
the experiment shows that participants perform exo-
centric distance estimation very accurately in the 360°
panorama mode, with a near-zero median error. Ego-
centric distances appear to be compromised towards
underestimation, but the experiment could not prove
this with statistical significance.
The experiment does clearly show that test partic-
ipants feel unusually tall when experiencing the 360°
mode. We conjecture that this effect, combined with
absence of binocular cues in the 360° mode, may
counteract the HMD-induced distance compression.
ACKNOWLEDGEMENTS
This research was partially funded by the CityVR
project, funded by the Department of Architecture,
Design and Media Technology, Aalborg University.
This funding is gratefully acknowledged.
REFERENCES
Boukhris, M., Paljic, A., and Lafon-Pham, D. (2017). 360°
versus 3D Environments in VR Headsets for an Explo-
ration Task. In Lindeman, R. W., Bruder, G., and Iwai,
D., editors, ICAT-EGVE 2017 - International Confer-
ence on Artificial Reality and Telexistence and Eu-
rographics Symposium on Virtual Environments. The
Eurographics Association.
Hornsey, R. L. and Hibbard, P. B. (2021). Contributions of
pictorial and binocular cues to the perception of dis-
Scale Perception in VR for Urban Scale Environments: 360 Photos versus Full 3D Virtual Reality
39

tance in virtual reality. Virtual Reality, 25(4):1087–
1103.
Interrante, V., Ries, B., and Anderson, L. (2006). Distance
perception in immersive virtual environments, revis-
ited. In IEEE Virtual Reality Conference (VR 2006),
pages 3–10.
Jensen, T. D., Kasprzak, F., Szekely, H.-G., Nikolov, I.,
Høngaard, J. S., and Madsen, C. (2020). Preliminary
study on the influence of visual cues, transitional en-
vironments and tactile augmentation on the perception
of scale in vr. HCI International 2020 – Late Breaking
Posters, pages 156–164. Springer International Pub-
lishing.
Loyola, M. (2017). The influence of the availability of vi-
sual cues on the accurate perception of spatial dimen-
sions in architectural virtual environments. Virtual Re-
ality, 22(3):235–243.
Lucaci, A.-I., Jakobsen, M., Jensen, P., and Madsen, C.
(2022). Influence of texture fidelity on spatial per-
ception in virtual reality. In Proceedings of Computer
Graphics Theory and Applications (GRAPP 2022),
pages 244–251. SCITEPRESS.
Ng, A. K. T., Chan, L. K. Y., and Lau, H. Y. K. (2016).
Depth Perception in Virtual Environment: The Ef-
fects of Immersive System and Freedom of Movement,
pages 173–183. Virtual, Augmented and Mixed Real-
ity. Springer International Publishing, Cham.
Peer, A. and Ponto, K. (2017). Evaluating perceived dis-
tance measures in room-scale spaces using consumer-
grade head mounted displays. In 2017 IEEE Sympo-
sium on 3D User Interfaces (3DUI), pages 83–86.
Renner, R., Velichkovsky, B., and Helmert, J. (2013). The
perception of egocentric distances in virtual environ-
ments - a review. ACM computing surveys, 46(2):1–
40.
Ritter, K. A. and Chambers, T. L. (2021). Three-
dimensional modeled environments versus 360 degree
panoramas for mobile virtual reality training. Virtual
Reality, 1.
CHIRA 2022 - 6th International Conference on Computer-Human Interaction Research and Applications
40
