
An Integrated Neural Network and Structural Equation Modeling
Approach for Modeling Activity Trackers Use
Ricardo Sol
a
and Karolina Baras
b
Exact Sciences and Engineering, University of Madeira, Madeira, Portugal
Keywords: Artificial Neural Networks (ANN), Ubiquitous Systems, Personal Informatics, Personal Data Tracking,
Sports/Exercise, Technology Acceptance Model (TAM), Embodied Interaction.
Abstract: The objective of this study is to enhance a Technology Acceptance Model (TAM) with an Artificial Neural
Network (ANN) approach in order to obtain substantially accurate results when compared to Structural
Equation Modeling (SEM). This study looked at another paper that created a TAM dedicated to activity
trackers (AT) obtained via SEM from a questionnaire to 247 participants. This study uses the constructs of
that paper in an ANN as the input units and the Root Mean Square of Errors to indicate that the ANN method
achieves high prediction accuracy. The results provide conclusive evidence that Perceived Usefulness is the
most significant factor affecting AT acceptance. Perceived Ease of Use and Image affect acceptance, however
their impact is much lower. Hedonic Motivation and Habit were found to have a significant relationship with
TAM while Self-Efficacy showed mixed results. This confirmation can be useful for future designs of activity
trackers.
1 INTRODUCTION
Wearable devices such as activity trackers have
become important in monitoring health behavior, for
recreation, and socialization, and thus are a viable and
significant research topic in Human Computer
Interaction. Confirming this trend is the International
Data Corporation in a press release, stating that
worldwide shipments of wearables grew 9.9%
throughout the third quarter of 2021 reaching 138.4
million units (IDC 2021). The improvement and the
commercialization of activity trackers have helped
many users to reach the recommended goal of ten
thousand steps per day in order to maintain or
improve their health (Akers 2012). However, a study
on the acceptance of a particular activity tracker
device discovered that half of the users stop using the
device after two weeks (Shih 2015).
One possibility, to help solve design issues that
lead to loss of interest or decrease od device usage, is
the use of models. Even though some researchers
think of them as excessively theoretical. In fact,
researchers working with interfaces who had often
been skeptical, started to acknowledge that models
a
https://orcid.org/0000-0003-4333-7140
b
https://orcid.org/0000-0002-2050-6565
could be helpful in the design of interfaces (Myers
2000). Since Li et al.’s seminal work, researchers
have been trying to describe the use of trackers
through a model (Li 2010). Li et al. presented a model
with five iterative stages: preparation, collection,
integration, reflection, and action; later the model was
refined by these authors. Also, Epstein et al. looked at
that model and expanded on it by including the lapses
and interruptions of tracking, and highlighting the
intricacy of integration, collection and reflection
(Epstein 2015). Narrowing the scrutiny, Sol and
Baras obtained a model dedicated to activity trackers
use (Sol 2016) that is used in this paper. The most
important advantage of this model is that it is
quantitative. It was obtained by expanding the
Technology Acceptance Model (TAM), with health
oriented, data control, and other constructs. TAM
assumes that user acceptance can be described by two
ideas: Perceived Usefulness (PU), and Perceived Ease
of Use (PEoU) which determine Intention to Use
through Attitude (Davis 1989).
A TAM based model for activity trackers, as most
of the research on technology acceptance models is
done simply with Structural Equation Modeling
Sol, R. and Baras, K.
An Integrated Neural Network and Structural Equation Modeling Approach for Modeling Activity Trackers Use.
DOI: 10.5220/0011526600003323
In Proceedings of the 6th International Conference on Computer-Human Interaction Research and Applications (CHIRA 2022), pages 49-58
ISBN: 978-989-758-609-5; ISSN: 2184-3244
Copyright
c
2022 by SCITEPRESS – Science and Technology Publications, Lda. All rights reserved
49

(SEM) methods, or other models, for example, the
Ubiquitous Computing Acceptance Model
(Spiekermann 2007), and the Health Information
Technology Acceptance Model (Kim 2013). SEM is
a sophisticated multivariate technique that can be
used to scrutinize multiple dependence associations
between variables simultaneously. It is useful for
hypothesis specification and testing, can suggest
novel hypotheses that were not considered initially.
Nevertheless, SEM may lead frequently to an
oversimplification of the complexities involved as it
is simply detecting linear relationships (Ringle 2012).
To address this issue, undertaking a second step using
an Artificial Neural Network (ANN) allows for
further scrutiny and examination.
An ANN is “a massively parallel distributed
processor made up of simple processing units, which
have a neural propensity for storing experimental
knowledge and making it available for use” (Haykin
2004). Contrary to SEM an ANN is not suitable for
hypotheses testing, but further to linear relationships
can also deal with non-liner relationships. Moreover,
an ANN has the capability to assess non-
compensatory processes (Svozil 1997). Additionally,
an ANN is more robust and can offer greater
prediction accuracy than linear models (Tan 2014).
This study uses the constructs of the TAM based
model for activity trackers as the input units of an
ANN in order to obtain a more accurate view of the
acceptance and use of these devices.
In the following sections, we contextualize the study
with the literature review, and present the model.
Next, we describe the methodology, and discuss the
results of ANN analysis. Finally, we conclude, and
envision the possibility of future research.
2 LITERATURE REVIEW
In this section we primarily review the literature
related to activity trackers. We also look into
Artificial Neural Networks research to understand its
relations, importance and classifications. The
acceptance and use of activity trackers is due to many
reasons and motives, several of which seem to clash.
Users may begin tracking their activity since they
have a certain goal in mind (Epstein 2015). Still, there
are users who start to use activity trackers with no
goal in mind and use the device to help them set an
objective. This objective becomes clearer as the usage
changes after transitioning from the discovery phase
to the maintenance phase of pondering (Li 2010).
Other users start tracking merely moved by concern
and curiosity of the quantitative data (Lindqvist
2011). Nonetheless, goal seating is just one notion to
help and persuade health-related behavior change.
For example, when the user wants to implement a
habit in daily life, one of the best ways is for the
activity tracker to help implementing routines (Lazar
2015).
An egocentric perspective for these devices
(Elsden 2015) can be looked at as a form of hedonic
motivation, as is individual encouragement (Patel
2015), the acknowledgement of effort (Kim 2016),
and giving credit (Consolvo 2006).
When looking at image one can look into the lifestyle
of the user (Consolvo 2006) or to the aesthetics and
form of the devices (Harrison 2015). Other notions
embrace social comparison (Harrison 2015), social
competition and collaboration (Patel 2015).
Users manage to change their goals, habits, and
devices; however, the applications or dashboards are
ill equipped to allocate this change. For tracking,
users tend to change devices often or even use several
devices in parallel, which leads to complications in
measuring and associating data (Rooksby 2014). This
issue has many impacts as it increases the difficulty
to provide a tailored efficacy evaluation (Klasnja
2011) that is important for the users’ self-efficacy.
When one approaches to data control the
information that activity trackers are gathering can be
extremely sensitive (Lupton 2017) and the risk of
third-party recording is real (Elsden 2015).
When looking at how to improve the usefulness of
activity trackers different researchers produced
several design ideas, one of which was the facilitating
of micro-plans (Gouveia 2018), another was to give
meaningfulness in context (Rooksby 2014), yet
another was to provide a wide variety of adjustable
goals (Clawson 2015), or to appeal to identity (Lazar
2015), and another was the idea of adherence (Tang
2018).
The idea that the devices have to “speak“ the
language of the users (Lazar 2015) because users are
not data scientists (Rooksby 2014), and the need for
devices to remind them (Shih 2015) are ways to
improve the usability of activity trackers.
Nevertheless, these devices are still being used in a
rather limited manner (Didziokaite 2017).
Numerous statistical techniques are parametric,
such as SEM and Multiple Regression Analysis
(MRA), requiring a great statistic background, while
artificial neural networks are non-parametric models,
which can provide higher prediction accuracy (Tan
2014). An ANN uses a considerable interconnection
of simple computing units called neurons or nodes as
inputs, hidden, and outputs layers with connection
values called synaptic weights that are adaptable via
CHIRA 2022 - 6th International Conference on Computer-Human Interaction Research and Applications
50

an iterative process. A classic ANN consists of
several layers: one input layer, one or more hidden
layers and one output layer (Negnevitsky 2011). In
ANNs for technology acceptance typically only one
hidden layer is used (Tan 2014). There are several
types of ANNs, but the most common is feed forward
back propagation multilayer perceptron (BPFF). In
this kind of network, belonging to supervised learning
ANNs, the knowledge stored in the network by
iteratively subjecting it to patterns of known inputs
and outputs (Negnevitsky 2011). The difference
between desired and actual output, is calculated and
propagated back, in order to change the synaptic
weights and by doing so minimize the estimation
error (Haykin 2004).
A node uses a function f defined as a weighted
sum of its inputs based on equation 1 where the w are
the weights, and the x are the inputs, the bias is b and
the output is Z (Haykin 2004).
𝑍=
𝑓
(𝑤
𝑥
+𝑤
𝑥
+𝑏)
(1)
There are many activation functions for the output
layer, however Sigmoid, shown in equation 2, is
generally used in a technology acceptance context
(Tan 2014).
𝑆𝑖𝑔𝑚𝑜𝑖𝑑
(
𝑥
)
=
1
1+𝑒
(2)
The root mean square of errors (RMSE) is used to
predict accuracy and is calculated using equation 3
and 4 (Tan 2014), where SSE is the sum of squared
error, and MSE is the mean squared prediction error.
𝑀𝑆𝐸 =
𝑆𝑆𝐸
𝑛
(3)
𝑅𝑀𝑆𝐸 =
√
𝑀𝑆𝐸
(4)
3 MODEL OBTAINED VIA SEM
In order to obtain the model for activity tracking use,
via Structural Equation Modeling, the paper targets a
population of actual activity trackers users. These
users were recruited from social media and on a micro
work site. A survey with 80 questions adapted from
prior research was deployed. The items of the survey
were considered using a seven-point Likert scale,
amid between “Strongly Disagree” and “Strongly
Agree.” Specifically, the strength and significance of
direct effect of nineteen independent variables on
behavioral intention were determined. From a total of
17 tested relationships, 11 were statistically
significant.
There were a total of 247 users, mostly from
Western Europe and North America, that completed
Table 1: Definitions of the constructs present in the model.
Definition
Perceived Susceptibility of
Disease
“The perception of the likelihood of experiencing a condition that would
adversel
y
affect one's health” (Ja
y
anti 1998)
Perceived Severity of
Disease
“The beliefs a person holds concerning the effects a given disease or
condition would have on one's state of affairs” (Hochbaum 1952)
Habit “The extent to which people tend to perform behaviors automatically
b
ecause of learnin
g
” (Lima
y
em, 2007)
Health Consciousness “The degree to which health concerns are integrated into a person’s daily
activities” (Ja
y
anti, 1998)
Hedonic Motivation “The fun or pleasure derived from using a technology, and it has been
shown to play an important role in determining technology acceptance
and use” (Brown, 2005)
Image “The degree to which use of an innovation is perceived to enhance one’s
ima
g
e or status in one’s social s
y
stem” (Moore, 1991)
Self-Efficacy “The judgment of one’s ability to use a technology (e.g., computer) to
accomplish a particular
j
ob or task” (Compeau 1995)
Perceived Data Control “The degree to which a person feels they have control over the use of,
and access to, the data collected” (Lindqvist 2011)
Perceived Usefulness “The degree to which a person believes that using a particular system
would enhance his or her
j
ob performance” (Davis 1989)
Perceived Ease of Use “The degree to which a person believes that using a particular system
would be free of effort” (Davis 1989)
An Integrated Neural Network and Structural Equation Modeling Approach for Modeling Activity Trackers Use
51
the survey, from these 144 were male (58.3 percent)
and 103 were female (41.7 percent). The average age
was 33 with a standard deviation of 10.6.
The sample size of 247 has exceeded the
recommended minimum sample size of 111 obtained
from G*Power with an effect size of 0.3, an alpha
level of 0.05 and a power of 0.95 (Faul 2009). In
Table 1 we display the definitions of the constructs
that make up the model.
The previously found model was obtained using
maximum likelihood parameter estimation.
Descriptive statistics, and Exploratory Factor
Analysis were conducted using IBM SPSS version
23. The structural equation model was built-in with
maximum likelihood estimation routines in IBM
SPSS Amos 23.
The Kurtosis analysis found normality issues,
with values higher that 2, in item 2 of the construct
Perceived Usefulness, item 2 of the construct
Perceived Ease of Use, item 1 of the construct
Intention to Use, and in all items of the construct
Behavioral Intention. However, these constructs
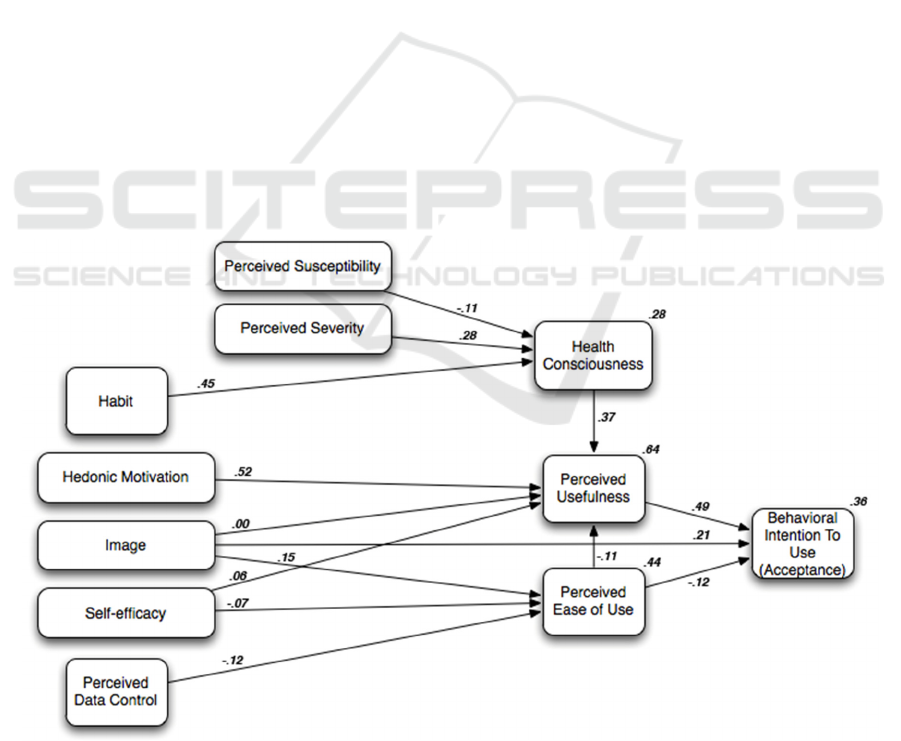
passed in the Exploratory Factor Analysis. In Figure
1 we show the path diagram of the activity tracker
acceptance model with the respective path
coefficients.
4 METHODOLOGY
In this work, an Artificial Neural Network is applied
to analyze, complement and verify the SEM approach
and measure the effectiveness of the constructs that
prevailed for the acceptance of activity trackers.
We used a Multilayer Perceptron (MLP) back
propagation feed-forward (BPFF) method. The MLP
is the most used and widespread ANN method
(Liébana-Cabanillas 2017). The ANN contains three
layers: the input layer, the hidden layer, and the
output layer. In this work, the ANN is created using
SPSS 24. The model obtained from SEM is divided
into four ANN models with one output variable.
Model A has the output as the construct Health
Consciousness and has three inputs Perceived
Susceptibility to Disease, Perceived Severity to
Disease, and Habit. Model B has the output as the
construct Perceived Usefulness and has five inputs
Health Consciousness, Hedonic Motivation, Image,
Self-Efficacy, Perceived Ease of Use. Model C has
the output as the construct Perceived Ease of Use and
has three inputs Image, Self-Efficacy, and Perceived
Data Control. Model D has the output as the construct
Behavioral Intention to Use (BIU)/ Acceptance and
has three inputs Perceived Usefulness, Image,
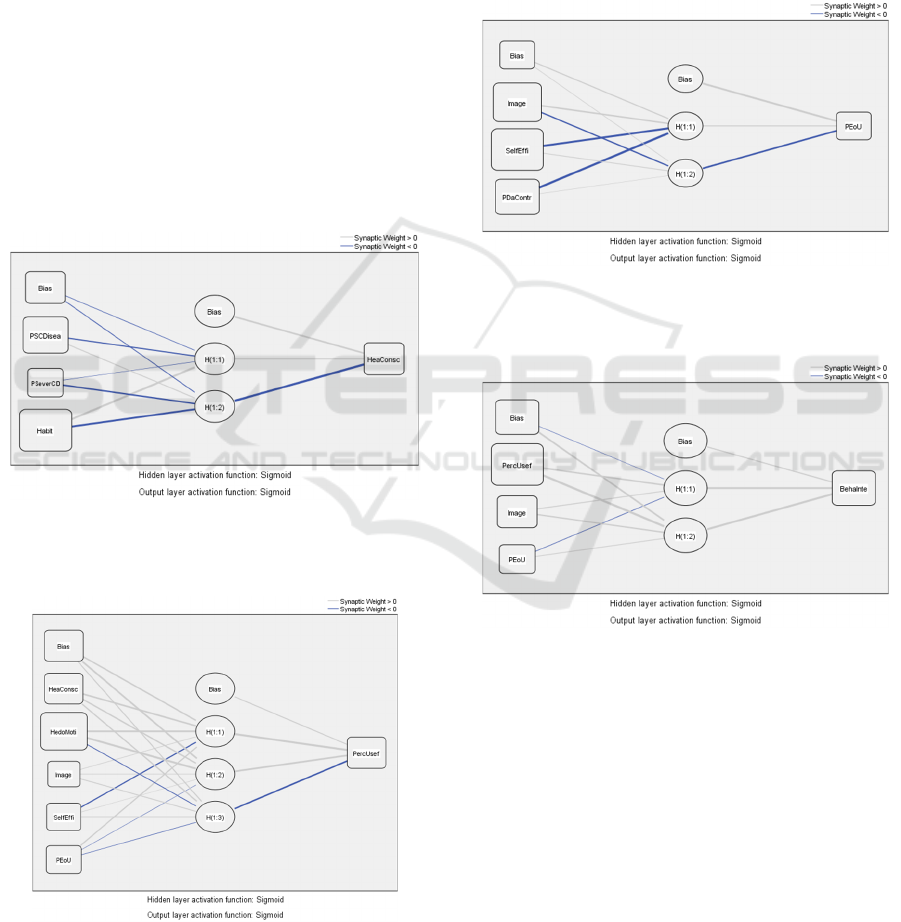
Perceived Ease of Use. The four models ANN are
shown in Figure 2. The nodes (hidden neurons) are
Figure 1: Path Diagram of the Activity Trackers Acceptance Model obtained via SEM with respective path coefficients (Sol
2016).
CHIRA 2022 - 6th International Conference on Computer-Human Interaction Research and Applications
52
automatically generated by SPSS and the activation
function used for both hidden and output layers was
Sigmoid Function. We assigned 90 % of the samples
to the training procedure and the remaining 10% were
used for the testing procedure. To avoid the risk of
over-fitting, we employed a ten-fold cross-validating
process. The root mean square of errors (RMSE) was
used to assure the predictive accuracy of the four
ANNs. The next section analyzes the results of the
ANN.
5 ARTIFICIAL NEURAL
NETWORK RESULTS
An ANN is helpful in discovering both linear and
non-linear relationships without requiring any
distribution assumptions like linearity, normality, or
homoscedasticity as in Structural Equation Modeling
(Leong 2013). By doing so, an ANN can provide
higher prediction accuracy (Tan 2014).
Table 2: RMSE values of ten artificial neural networks.
Model A Model B Model C Model D
Input
Neuron
Perceived
Susceptibility to
Disease (PSusD),
Perceived Severity to
Disease (PSevD), Habi
t
HC, Hedonic
Motivation (HM),
Image, Self-Efficacy,
Perceived Ease of Use
Image (I), Self-
Efficacy (SE),
Perceived Data
Control (PDC)
Perceived
Usefulness, Image,
Perceived Ease of
Use
Output
Neuron
Health Consciousness
(HC)
Perceived Usefulness
(PU)
Perceived Ease of
Use (PEoU)
Behavioral
Intention to Use
(BIU)/ Acceptance
Trainin
g
Testin
g
Trainin
g
Testin
g
Trainin
g
Testin
g
Trainin
g
Testin
g
ANN 1 0.114 0.134 0.072 0.073 0.104 0.096 0.075 0.057
ANN 2 0.117 0.107 0.077 0.077 0.101 0.099 0.072 0.058
ANN 3 0.118 0.116 0.083 0.055 0.100 0.120 0.072 0.067
ANN 4 0.119 0.106 0.076 0.056 0.104 0.094 0.074 0.076
ANN 5 0.119 0.104 0.078 0.077 0.105 0.102 0.087 0.054
ANN 6 0.115 0.129 0.087 0.072 0.102 0.104 0.073 0.071
ANN 7 0.117 0.080 0.080 0.063 0.105 0.159 0.071 0.062
ANN 8 0.116 0.107 0.079 0.049 0.111 0.130 0.079 0.053
ANN 9 0.130 0.108 0.073 0.066 0.100 0.114 0.069 0.083
ANN 10 0.117 0.072 0.069 0.067 0.103 0.079 0.078 0.057
Mean
RMSE
0.118 0.106 0.077 0.066 0.103 0.110 0.075 0.064
Standard
Deviation
0.005 0.019 0.005 0.010 0.003 0.022 0.005 0.010
Table 3: Neural network sensitivity analysis.
Model A Model B Model C Model D
Output Health Consciousness (HC) Perceived Usefulness (PU)
Perceived Ease of Use
(PEoU)
Behavioral Intention to
Use (BIU)/ Acceptance
Relative Importance Relative Importance Relative Importance Relative Importance
ANN PSusD PSevD H HC HM I SE PEoU I SE PDC PU I PEoU
1 0.324 0.240 0.437 0.040 0.671 0.065 0.113 0.112 0.301 0.429 0.270 0.730 0.218 0.052
2 0.326 0.256 0.417 0.070 0.603 0.050 0.123 0.154 0.352 0.356 0.291 0.731 0.166 0.103
3 0.298 0.238 0.464 0.237 0.514 0.025 0.097 0.127 0.358 0.306 0.336 0.690 0.174 0.136
4 0.350 0.161 0.488 0.062 0.603 0.035 0.071 0.229 0.411 0.331 0.258 0.651 0.213 0.136
5 0.298 0.248 0.454 0.091 0.584 0.023 0.052 0.250 0.311 0.423 0.266 0.360 0.188 0.453
6 0.379 0.251 0.370 0.168 0.367 0.033 0.170 0.264 0.324 0.419 0.257 0.694 0.149 0.157
7 0.315 0.217 0.467 0.060 0.567 0.096 0.117 0.161 0.335 0.376 0.289 0.754 0.193 0.053
8 0.311 0.252 0.437 0.039 0.601 0.041 0.029 0.289 0.237 0.503 0.260 0.579 0.174 0.247
9 0.223 0.106 0.671 0.023 0.651 0.018 0.102 0.205 0.304 0.299 0.397 0.723 0.195 0.082
10 0.255 0.275 0.470 0.049 0.604 0.054 0.146 0.146 0.380 0.353 0.267 0.525 0.405 0.070
Average 0.308 0.224 0.468 0.084 0.577 0.044 0.102 0.194 0.331 0.380 0.289 0.644 0.208 0.149
Average 68% 50% 99.8% 16.4% 100% 7.7% 18.9% 35.2% 83.3% 93.4% 72.5% 97.9% 33.3% 25.9%
An Integrated Neural Network and Structural Equation Modeling Approach for Modeling Activity Trackers Use
53
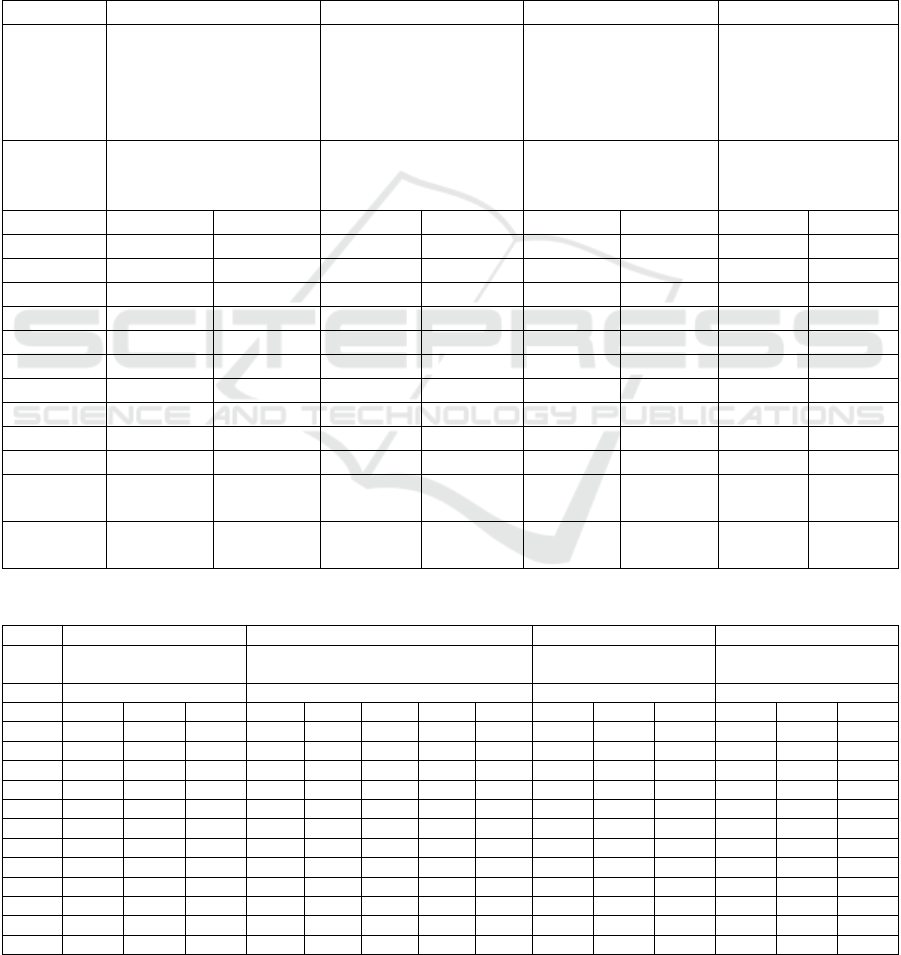
As shown in Table 2, the RMSE values for the
training data and the testing data are low, representing
a higher predictive accuracy and better data fit.
In Table 3, we show the results of the sensitivity
analysis that assessed the strength of the predictive
power of each of the input neurons. In order to have
the normalized importance of these neurons in
percentage we divided the relative importance by the
maximum importance.
Habit (H) was found to be the key determinant in
predicting Health Consciousness (HC) followed by
Perceived Susceptibility to Disease (PSusD) and
lastly Perceived Severity to Disease (PSevD) in
model A. In model B, the order of importance towards
Perceived Usefulness (PU) in descending order is
Hedonic Motivation (HM), followed by Perceived
Ease of Use (PEoU) and Self-Efficacy (SE) and the
least important were Health Consciousness (HC) and
Image (I). For model C, Self-Efficacy (SE) is the most
prominent predictor for Perceived Ease of Use
Figure 2: Neural Network between Perceived Susceptibility
to Disease, Perceived Severity to Disease, and Habit with
Health Consciousness.
Figure 3: Artificial Neural Network between Health
Consciousness, Hedonic Motivation, Image, Self-Efficacy,
and Perceived Ease of Use with Perceived Usefulness.
(PEoU), followed by Image (I) and lastly Perceived
Data Control (PDC). Finally, Perceived Usefulness
(PU) constituted the most effective in term of
predicting Behavioral Intention to Use (BIU)/
Acceptance, followed by Image (I) and lastly
Perceived Ease of Use (PEoU).
All constructs in all ten ANNs for each model had
at least one non-zero synaptic weight connected to the
hidden neurons which validates the relevance of the
constructs as variables as Figures 2 to 5 show.
Figure 4: Artificial Neural Network between Image, Self-
Efficacy, and Perceived Data Control with Perceived Ease
of Use.
Figure 5: Artificial Neural Network between Perceived
Usefulness, Image, and Perceived Ease of Use with
Behavioral Intention to Use / Acceptance.
6 DISCUSSION
The Technology Acceptance Model (TAM) is based
on many theories and grounded in many studies. In
this work, the determinants of activity trackers use
include TAM constructs and other constructs such as
Image, Hedonic Motivation, Habit and Self-Efficacy.
The results show that the research model studied in
this work is acceptable. Next, we discuss the findings
in more detail.
CHIRA 2022 - 6th International Conference on Computer-Human Interaction Research and Applications
54

6.1 Relationships between Perceived
Susceptibility to Disease, Perceived
Severity to Disease, and Habit with
Health Consciousness
As shown in Table 4, the construct Habit showed a
significant relationship with Health Consciousness
with a path coefficient of 0.451 obtained during the
Structural Equation Modeling and has the highest
normalized importance according to the Model A of
the Artificial Neural Network analysis. While to our
knowledge this relation is not found in the literature,
the fact that both approaches ranked Habit in first
place makes one ponder that a Health Conscious
person has health habits.
The findings in this study also show that the
construct Perceived Severity to Disease with 50%
normalized importance is positively related to Health
Consciousness. Looking at this result one might
consider that if a person is Health Conscious, then
that person should have a high degree of awareness of
disease and related issues. Nevertheless, the construct
Perceived Susceptibility of Disease showed mixed
results within the two approaches.
6.2 Relationships between Health
Consciousness, Hedonic
Motivation, Image, Self-Efficacy,
and Perceived Ease of Use with
Perceived Usefulness
During to the SEM the path coefficient between
Hedonic Motivation and Perceived Usefulness is
0.515, which is a significant positive correlation with
the highest normalized importance given by model B
of the ANN. For many studies, the perception of
Hedonic Motivation has been viewed as egocentric
(Elsden 2015) and an important issue for individual
encouragement (Patel 2015), provide motivation
(Lazar 2015), acknowledgement of effort (Kim 2016)
or giving credit (Consolvo 2016).
The construct Perceived Ease of Use was
promoted by the ANN when compared to SEM
approach, however, the normalized importance was
only 35.2%. This result is in line with previous work
that demanded for reminders to be added to the
devices (Shih 2015).
Table 4: Comparison between SEM and ANN analysis (output: Health Consciousness).
SEM Path
SEM
Ranking
ANN normalized
relative importance
ANN
Ranking
Rank
Matched?
Perceived Susceptibility to
Disease
-0.114 3 68% 2 No
Perceived Severity of
Disease
0.283 2 50% 3 No
Habit 0.451 1 99.8% 1 Yes
Table 5: Comparison between SEM and ANN analysis (output: Perceived Usefulness).
SEM Path
SEM
Ranking
ANN normalized
relative importance
ANN
Ranking
Rank
Matched?
Health Consciousness 0.372 2 16.4% 4 No
Hedonic Motivation 0.515 1 100% 1 Yes
Image -0.013 3 7.7% 5 No
Self-Efficacy -0.060 4 18.9% 3 No
Perceived Ease of Use -0.110 5 35.2% 2 No
Table 6: Comparison between SEM and ANN analysis (output: Perceived Ease of Use).
SEM Path
SEM
Ranking
ANN normalized
relative importance
ANN
Ranking
Rank
Matched?
Image 0.146 1 83.3% 2 No
Self-Efficacy -0.067 2 93.4% 1 No
Perceived Data Control -0.115 3 72.5% 3 Yes
An Integrated Neural Network and Structural Equation Modeling Approach for Modeling Activity Trackers Use
55

Table 7: Comparison between SEM and ANN analysis (output: Behavioral Intention to Use / Acceptance).
SEM Path SEM
Rankin
g
ANN normalized
relative importance
ANN
Rankin
g
Rank
Matched?
Perceived Usefulness 0.492 1 97.9% 1 Yes
Ima
g
e 0.207 2 33.3% 2 Yes
Perceived Ease of Use -0.115 3 25.9% 3 Yes
Regarding the construct Sell-Efficacy, the weak
influence is corroborated by model B of the ANN. To
some extent, this result is partially contradicted by
earlier studies that ask for a tailored efficacy
evaluation (Klasnja 2011).
The ANN demoted Health Consciousness giving
a low normalized importance that shows a weak
influence in Perceived Usefulness.
Since the normalized importance for Image is less
than 10%, we may conclude that the effect of Image
in Perceived Usefulness is very small in comparison
to Hedonic Motivation. This result seems to
contradict past research (Harrison 2015) however one
should keep in mind that here we are relating Image
to Perceived Usefulness.
6.3 Relationships between Image,
Self-Efficacy, and Perceived Data
Control with Perceived Ease of Use
The construct Image showed a significant
relationship with Perceived Ease of Use obtained
during the SEM and even though it does not have the
highest normalized importance it is a high value
according to Model A of the Artificial Neural
Networks analysis. This finding of this research is
compatible with the findings of existing studies that
state that Image is present as a component of social
tracking (Rooksby 2014) and that it exists as both
social competition and social comparison (Patel
2015).
The ANN came to empower Self-Efficacy as a
relevant construct in its relationship with Perceived
Ease of Use opposing a path coefficient of -0.067 that
SEM found. The ANN result corroborates with
previous research that demanded for good inter-
device reliability (Dontje 2015). Nevertheless, one
has to take into consideration that an ANN measure
with high predictive accuracy has both a linear and
non-linear relationship among variables.
During the SEM the path coefficient between
Perceived Data Control and Perceived Ease of Use is
-0.115, which is in accordance with the lowest
normalized importance ranking but a high value of
72.5% given by model B of the ANN. To some extent,
this result is partially supported by earlier studies
which emphasize that the personal information
collected by self-tracking can be highly sensitive
(Lupton 2017).
One should note that these results are influenced
by the fact that in Model C the Average RMSE value
of the testing is higher than the Average RMSE for
training.
6.4 Relationships between Perceived
Usefulness, Image, and Perceived
Ease of Use with Behavioral
Intention to Use / Acceptance
Perceived Usefulness with the highest normalized
importance (97.9%) given by Model D of the
Artificial Neural Networks approach was found in the
Structural Equation Modeling to have a significant
relationship in predicting Behavioral Intention to Use
/ Acceptance. This finding supports prior research, as
the suggestions for the designers of activity trackers
to facilitate micro-plans (Gouveia 2018), add a wide
variety of adjustable goals (Clawson 2015), and have
adjustable tracking goals (Epstein 2015).
The construct Image shows a significant influence
in predicting Acceptance in both approaches. The
finding of this research is compatible with the
findings of existing studies as the influence of activity
trackers on lifestyle (Consolvo 2006) and the
importance of aesthetics and form (Harrison 2015).
Concerning the SEM, the path coefficient from
Perceived Ease of use to Acceptance is -0.115,
nevertheless the normalized importance given by
model D of the ANN was 25.9%. This result is in line
with previous work which points out that people are
using activity trackers in a rather limited manner
(Didziokaite 2017).
7 CONCLUSIONS
This research aimed to study beliefs and behavioral
variables that impact the acceptance and use of
activity trackers. It looked to an established
technology acceptance model dedicated to activity
trackers that was obtained via Structural Equation
CHIRA 2022 - 6th International Conference on Computer-Human Interaction Research and Applications
56

Modeling. These constructs of the model are used in
an Artificial Neural Network as the input units of four
ANN. The Root Mean Square of Errors with the
highest value of 0.118 indicates that the ANN method
achieves high prediction accuracy.
The constructs of the model were divided in four
ANNs. Model A had as inputs the constructs:
Perceived Susceptibility to Disease, Perceived
Severity to Disease, and Habit, while the output was
the construct Health Consciousness. Model B had as
inputs Hedonic Motivation, Image, Self-Efficacy,
Health Consciousness, and Perceived Ease of Use,
while the output was Perceived Usefulness. Model C
had as inputs Image, Self-Efficacy, and Perceived
Data Control, while the output was Perceived Ease of
Use. Model D had as inputs Perceived Usefulness,
Image, and Perceived Ease of Use, while the output
was Behavioral Intention to Use (BIU) / Acceptance.
When comparing the results of SEM and ANN
analysis, the main disparity lies in the strength of the
effect of the construct Self-Efficacy with regards to
Perceived Ease of Use. The ANN analysis increases
the importance of Self-Efficacy in the Perceived Ease
of Use of activity trackers. Even though with a lower
impact, the ANN also increases the importance of
Perceived Susceptibility of Disease when related to
Health Consciousness. On the other hand, it also
decreases, with a not so high impact the importance
of Health Consciousness in Perceived Usefulness.
The ANN were able to emphasize the strengths
and weaknesses of the model obtained via SEM.
Furthermore, this research shows the relevance of the
two-stage approach integrating SEM and ANN
techniques to fine-tune this technology acceptance
models and to present valuable information that can
be utilized to increase the acceptance and usability of
activity trackers as well as to enhance device designs.
This research is restricted in the sense that it would be
interesting to include control variables such as age
and gender and compare the results. Also, it used a
cross-sectional approach to obtain the responses of
the activity trackers users at one point in time. Hence,
in a future study one may repeat the questionnaire to
the same users in a longitudinal approach to examine
the temporal effects.
REFERENCES
Akers, J. D., Cornett, R. A., Savla, J. S., Davy, K. P., &
Davy, B. M. (2012). Daily self-monitoring of body
weight, step count, fruit/vegetable intake, and water
consumption: a feasible and effective long-term weight
loss maintenance approach. Journal of the Academy of
Nutrition and Dietetics, 112(5), 685-692.
Brown, S. A., & Venkatesh, V. (2005). A model of adoption
of technology in the household: A baseline model test
and extension incorporating household life cycle.
Management Information Systems Quarterly, 29(3), 11.
Clawson, J., Pater, J. A., Miller, A. D., Mynatt, E. D., &
Mamykina, L. (2015, September). No longer wearing
investigating the abandonment of personal health-
tracking technologies on craigslist. In Proceedings of
the 2015 ACM international joint conference on
pervasive and ubiquitous computing (pp. 647-658).
Compeau, D. R., & Higgins, C. A. (1995). Computer self-
efficacy: Development of a measure and initial test.
MIS quarterly, 189-211.
Consolvo, S., Everitt, K., Smith, I., & Landay, J. A. (2006,
April). Design requirements for technologies that
encourage physical activity. In Proceedings of the
SIGCHI conference on Human Factors in computing
systems (pp. 457-466).
Davis, F. D. (1989). Perceived usefulness, perceived ease
of use, and user acceptance of information technology.
MIS quarterly, 319-340.
Didziokaite, G. (2017). Mundane self-tracking: calorie
counting practices with MyFitnessPal (Doctoral
dissertation, Loughborough University).
Dontje, M. L., De Groot, M., Lengton, R. R., Van Der
Schans, C. P., & Krijnen, W. P. (2015). Measuring steps
with the Fitbit activity tracker: an inter-device
reliability study. Journal of medical engineering &
technology, 39(5), 286-290.
Elsden, C., Kirk, D., Selby, M., & Speed, C. (2015, April).
Beyond personal informatics: Designing for
experiences with data. In Proceedings of the 33rd
Annual ACM Conference Extended Abstracts on
Human Factors in Computing Systems (pp. 2341-
2344).
Epstein, D. A., Ping, A., Fogarty, J., & Munson, S. A.
(2015, September). A lived informatics model of
personal informatics. In Proceedings of the 2015 ACM
international joint conference on pervasive and
ubiquitous computing (pp. 731-742).
Faul, F., Erdfelder, E., Buchner, A., & Lang, A. G. (2009).
Statistical power analyses using G* Power 3.1: Tests
for correlation and regression analyses. Behavior
research methods, 41(4), 1149-1160.
Gouveia, R., Karapanos, E., & Hassenzahl, M. (2018,
April). Activity tracking in vivo. In Proceedings of the
2018 CHI Conference on Human Factors in Computing
Systems (pp. 1-13).
Harrison, D., Marshall, P., Bianchi-Berthouze, N., & Bird,
J. (2015, September). Activity tracking: barriers,
workarounds and customisation. In Proceedings of the
2015 ACM International Joint Conference on Pervasive
and Ubiquitous Computing (pp. 617-621).
Haykin, S. (2010). Neural networks: a comprehensive
foundation. 1999. Mc Millan, New Jersey, 1-24.
Hochbaum, G., Rosenstock, I., & Kegels, S. (1952). Health
belief model. United states public health service, 1.
An Integrated Neural Network and Structural Equation Modeling Approach for Modeling Activity Trackers Use
57

IDC. Press release from IDC on December 06, 2021.
Retrieved March 04, 2022, from https://www.idc.com/
getdoc.jsp?containerId=prUS48460121.
Jayanti, R. K., & Burns, A. C. (1998). The antecedents of
preventive health care behavior: An empirical study.
Journal of the academy of marketing science, 26(1), 6-
15.
Kim, D. J., Lee, Y., Rho, S., & Lim, Y. K. (2016, May).
Design opportunities in three stages of relationship
development between users and self-tracking devices.
In Proceedings of the 2016 CHI Conference on Human
Factors in Computing Systems (pp. 699-703).
Kim, J., & Park, H. A. (2012). Development of a health
information technology acceptance model using
consumers’ health behavior intention. Journal of
medical Internet research, 14(5), e133.
Klasnja, P., Consolvo, S., & Pratt, W. (2011, May). How to
evaluate technologies for health behavior change in
HCI research. In Proceedings of the SIGCHI
conference on human factors in computing systems (pp.
3063-3072).
Lazar, A., Koehler, C., Tanenbaum, T. J., & Nguyen, D. H.
(2015, September). Why we use and abandon smart
devices. In Proceedings of the 2015 ACM international
joint conference on pervasive and ubiquitous
computing (pp. 635-646).
Leong, L. Y., Ooi, K. B., Chong, A. Y. L., & Lin, B. (2013).
Modeling the stimulators of the behavioral intention to
use mobile entertainment: does gender really matter?.
Computers in Human Behavior, 29(5), 2109-2121.
Li, I., Dey, A., & Forlizzi, J. (2010, April). A stage-based
model of personal informatics systems. In Proceedings
of the SIGCHI conference on human factors in
computing systems (pp. 557-566).
Liébana-Cabanillas, F., Marinković, V., & Kalinić, Z.
(2017). A SEM-neural network approach for predicting
antecedents of m-commerce acceptance. International
Journal of Information Management, 37(2), 14-24.
Limayem, M., Hirt, S. G., & Cheung, C. M. (2007). How
habit limits the predictive power of intention: The case
of information systems continuance. MIS quarterly,
705-737.
Lindqvist, J., Cranshaw, J., Wiese, J., Hong, J., &
Zimmerman, J. (2011, May). I'm the mayor of my
house: examining why people use foursquare-a social-
driven location sharing application. In Proceedings of
the SIGCHI conference on human factors in computing
systems (pp. 2409-2418).
Lupton, D. (2017). Self-tracking, health and medicine.
Health Sociology Review, 26(1), 1-5.
Moore, G. C., & Benbasat, I. (1991). Development of an
instrument to measure the perceptions of adopting an
information technology innovation. Information
systems research, 2(3), 192-222.
Myers, B., Hudson, S. E., & Pausch, R. (2000). Past,
present, and future of user interface software tools.
ACM Transactions on Computer-Human Interaction
(TOCHI), 7(1), 3-28.
Negnevitsky, M. (2005). Artificial intelligence: a guide to
intelligent systems. Pearson education.
Patel, M. S., Asch, D. A., & Volpp, K. G. (2015). Wearable
devices as facilitators, not drivers, of health behavior
change. Jama, 313(5), 459-460.
Ringle, C. M., Sarstedt, M., & Straub, D. W. (2012).
Editor's comments: a critical look at the use of PLS-
SEM in" MIS Quarterly". MIS quarterly, iii-xiv.
Rooksby, J., Rost, M., Morrison, A., & Chalmers, M.
(2014, April). Personal tracking as lived informatics. In
Proceedings of the SIGCHI conference on human
factors in computing systems (pp. 1163-1172).
Shih, P. C., Han, K., Poole, E. S., Rosson, M. B., & Carroll,
J. M. (2015). Use and adoption challenges of wearable
activity trackers. IConference 2015 proceedings.
Sol, R., & Baras, K. (2016, September). Assessment of
activity trackers: toward an acceptance model. In
Proceedings of the 2016 ACM International Joint
Conference on Pervasive and Ubiquitous Computing:
Adjunct (pp. 570-575).
Spiekermann, S. (2007). User control in ubiquitous
computing: design alternatives and user acceptance.
Habilitation Humboldt Universität Berlin.
Svozil, D., Kvasnicka, V., & Pospichal, J. (1997).
Introduction to multi-layer feed-forward neural
networks. Chemometrics and intelligent laboratory
systems, 39(1), 43-62.
Tan, G. W. H., Ooi, K. B., Leong, L. Y., & Lin, B. (2014).
Predicting the drivers of behavioral intention to use
mobile learning: A hybrid SEM-Neural Networks
approach. Computers in Human Behavior, 36, 198-213.
Tang, L. M., Meyer, J., Epstein, D. A., Bragg, K., Engelen,
L., Bauman, A., & Kay, J. (2018). Defining adherence:
Making sense of physical activity tracker data.
Proceedings of the ACM on interactive, mobile,
wearable and ubiquitous technologies, 2(1), 1-22.
Temir, E., O'Kane, A. A., Marshall, P., & Blandford, A.
(2016, May). Running: A flexible situated study. In
Proceedings of the 2016 CHI Conference Extended
Abstracts on Human Factors in Computing Systems
(pp. 2906-2914).
CHIRA 2022 - 6th International Conference on Computer-Human Interaction Research and Applications
58
