
Machine Learning for Fatigue Detection using Fitbit Fitness Trackers
Erik Johannes Husom
1 a
, Rustem Dautov
1 b
, Adela-Aniela Nedisan
1,2 c
, Fotis Gonidis
3 d
,
Spyridon Papatzelos
3 e
and Nikolaos Malamas
3 f
1
SINTEF Digital, Forskningsveien 1, 0373 Oslo, Norway
2
University of Oslo, Department of Informatics, Gaustadall
´
een 23B, 0373 Oslo, Norway
3
Gnomon Informatics SA, Antoni Tritsi 21, 57001 Thessaloniki, Greece
Keywords:
Machine Learning, Fatigue Detection, Fatigue Assessment Scale, Healthcare, Fitness Trackers, Fitbit.
Abstract:
Fatigue can be a pre-cursor to many illnesses and injuries, and cause fatal work-related incidents. Fatigue de-
tection has been traditionally performed in lab conditions with stationary medical-grade diagnostics equipment
for electroencephalography making it impractical for many in-field scenarios. More recently, the ubiquitous
use of wearable sensor-enabled technologies in sports, everyday life or fieldwork has enabled collecting large
amounts of physiological information. According to recent studies, the collected biomarkers related to sleep,
physical activity or heart rate have proven to be in correlation with fatigue, making it a natural fit for apply-
ing automated data analysis using Machine Learning. Accordingly, this paper presents our novel Machine
Learning-driven approach to fatigue detection using biomarkers collected by general-purpose wearable fitness
trackers. The developed method can successfully predict fatigue symptoms among target users, and the overall
methodology can be further extended to other diagnostics scenarios which rely on collected wearable data.
1 INTRODUCTION
Many industries, such as maritime, construction or
oil & gas, still depend on extensive manual labour
to be done in the field, i.e. in remote working loca-
tions away from social services and basic healthcare
facilities. Field workers are often exposed to hostile
working conditions, including tough physical work,
lack of recreational activities, homesickness, rough
sea weather, etc. – all these factors often lead to in-
creased fatigue and stress levels. Occupational acci-
dents resulting from poor physical and mental condi-
tions can easily escalate to life-threatening situations,
given that proper medical assistance is not always
accessible. Albeit at a much lower scale, same is-
sues apply to people involved in long-term endurance
sports, such as ocean sailing and mountain hiking, and
expeditions. Once on the route, these people often be-
come completely autonomous and disconnected from
a
https://orcid.org/0000-0002-9325-1604
b
https://orcid.org/0000-0002-0260-6343
c
https://orcid.org/0000-0001-8514-8933
d
https://orcid.org/0000-0002-5605-4249
e
https://orcid.org/0000-0002-2199-4089
f
https://orcid.org/0000-0001-8006-145X
the world for several weeks or even months.
To partially address these challenges, some organ-
isations implement regulatory approaches in order to
control and reduce fatigue-related risks, such as com-
pliance to hours of service (HoS) regulations, alterna-
tively employing a fatigue risk management system
(FRMS) (Gander et al., 2011) and following rostering
principles (S¸ahinkaya and Oktal, 2021). Many indus-
tries also impose mandatory health assessment proce-
dures for their employees before departure allowing
them to work for an approved period of time. Such
one-off checks, however, do not properly reflect the
state of affairs over a period of time, as workers might
develop illnesses and other disorders during their ex-
tended field work. More frequent health assessments
would address this challenge, but are rarely imple-
mented in practice due to the high costs of hiring and
transporting medical staff and equipment.
In these circumstances, telemedicine and remote
patient monitoring solutions are increasingly used
to automate remote health-related procedures in the
field. More specifically, the increased use of sensor-
rich wearable devices enabled real-time collection of
large amounts of physiological data, which can then
be automatically fed into medical diagnostics soft-
ware systems.
Husom, E., Dautov, R., Nedisan, A., Gonidis, F., Papatzelos, S. and Malamas, N.
Machine Learning for Fatigue Detection using Fitbit Fitness Trackers.
DOI: 10.5220/0011527500003321
In Proceedings of the 10th International Conference on Sport Sciences Research and Technology Support (icSPORTS 2022), pages 41-52
ISBN: 978-989-758-610-1; ISSN: 2184-3201
Copyright
c
2022 by SCITEPRESS – Science and Technology Publications, Lda. All rights reserved
41

Traditionally, fatigue detection has relied on the
electroencephalogram (EEG) method to collect data
in lab conditions. The situation is now changing
with the rapid spread of small-size general-purpose
wearable devices, such as smartwatches, fitness track-
ers and chest belts, which are able to collect multi-
dimensional physiological data required to perform
fatigue detection using Machine Learning (ML) tech-
niques in a timely and efficient manner.
Accordingly, the contribution of this paper is two-
fold. First, we propose an automated fatigue de-
tection approach based on the hypothesis that multi-
dimensional biomarkers collected by general-purpose
wearables can be precisely and unambiguously cor-
related with fatigue levels. Second, we implement
this approach using ML techniques to automate the
fatigue detection task. This implementation relies on
pre-collected training data from Fitbit fitness trackers
and fatigue assessment questionnaires manually filled
in by the users during data collection.
The rest of the paper is organised as follows. Sec-
tion 2 familiarises the reader on the topic of fatigue
and the limitations of the currently adopted tools for
fatigue detection, followed by the description of the
proposed approach. Section 3 overviews the related
works, highlighting existing gaps. Section 4 proceeds
with a detailed description of the data collected and
used for fatigue detection in our work, and explains
the technical details underpinning the data prepara-
tion and model training activities. Section 5 evaluates
the obtained results, critically highlighting identified
limitations and threats to validity. Section 6 closes the
paper with some concluding remarks and directions
for future work.
2 BACKGROUND, MOTIVATION,
AND PROPOSED APPROACH
2.1 Fatigue
60-80% of workplace accidents are considered to be
the result of stress-induced issues, different manifes-
tations of stress such as fatigue and lack of energy
having an impact on employees’ ability to safely per-
form their work duty (Christ, 2016). Among var-
ious human factors contributing to work accidents
are personal problems, environmental stress, oper-
ational stress, boredom, frustration, fatigue, morale
and health (Gordon, 1998). Even though many con-
cepts further discussed in this paper are relevant to
all of these factors, in the rest of the paper we mostly
focus on fatigue as one of the most critical, yet under-
explored topics.
Fatigue has been attributed many definitions, of-
ten depending on the context of the experiment it is
used in (Hockey, 2013; Marino, 2019). In our case,
we will use this term to refer to a state of human tired-
ness that does not resolve with rest or sleep, typically
resulting from prolonged physical or mental activity.
When it occurs independently of physical or mental
exertion and does not resolve after rest or sleep, it may
be a symptom of a severe medical condition. There-
fore, fatigue is considered as a major safety hazard
characterised by degraded performance and implicitly
higher error rates. Individual differences and one’s
state of affairs influence how interventions are experi-
enced by each person, thus calling for a differentiated
user-tailored approach, such as measuring and mod-
elling theoretically relevant individual differences and
contextual variables in an objective way in order to
capture the complex relation between stressors and
well-being (Ganster and Rosen, 2013).
The use of electroencephalograms (EEG) has es-
tablished itself as an accurate and widely used method
for fatigue detection (Karuppusamy and Kang, 2020),
able to determine the onset of fatigue at an early stage
(Kudo et al., 2017). EEGs are used to monitor dif-
ferent brain waves that can be linked to fatigue, using
several frequency bands such as alpha (8–13 Hz), beta
(13–35 Hz), theta (4–7 Hz), and delta waves (0.5–4
Hz) (Stern, 2005). The drawback of using EEG in-
dexes is the hardware itself, which is quite a com-
plex and expensive piece of machinery, often requir-
ing special assistance to operate.
An alternative method is percentage eye openness
tracking (PERCLOS) (Zhang et al., 2021). PERC-
LOS tools rely on continuous video capturing of a
person’s sight and using image processing in order
to determine where the eyes are located, and whether
current eye movements can be correlated to the state
of fatigue. The use of PERCLOS in real-life working
conditions is limited due to several hindering factors,
such as insufficient illumination, objects blocking the
face (e.g. sunglasses or baseball caps), turning the
face to the side, or unusual facial expression or emo-
tions (e.g. crying) (Srivastava and Tiwari, 2021).
2.2 Motivation and Proposed Approach
Fatigue-caused accidents can be avoided provided
that signs of fatigue are recognised early enough
(Hellesøy, 1985). Some humans manage to notice
symptoms of fatigue early on, but in most cases the
signs are recognised only once fatigue affects their
physical capabilities significantly. Automating this
task using some standard hardware and software tools
would considerably improve the fatigue diagnostics,
icSPORTS 2022 - 10th International Conference on Sport Sciences Research and Technology Support
42

Figure 1: Conceptual architecture of the proposed approach.
not only by making it less unbiased and ambiguous,
but also by achieving much faster results computed
based on large amounts of collected data.
While EEG and PERCLOS tools can provide data
for automated diagnosis, they are too heavy-weight
and not portable to be used anywhere but in a lab.
Using such tools frequently is not always convenient,
and the fact that a patient opted for such a lab study to
diagnose fatigue typically means that some health de-
terioration has been developing over a period of time.
Taken together, there are two main limitations of the
current state of practice for fatigue detection tools –
namely, limited portability and infrequent use.
With the rapid advances in microelectronics de-
sign, sensor technology, and signal processing, var-
ious kinds of ‘wearable’ devices found their way to
the market. Ranging from the more traditional smart
watches and wristbands to more innovative smart
clothes and jewellery, their technological underpin-
nings are similar. They all rely on miniature em-
bedded sensors to collect various physiological in-
formation about the human body. These collected
biomarkers are an index of an individual’s physiologi-
cal state, and performance degradation can be approx-
imated based on some of these collectable body indi-
cators. Moreover, such computation more and more
often takes place either directly on sensor devices or
on users’ smartphones, which act as gateways for col-
lected physiological data, thus achieving timely re-
sults (Dautov et al., 2017).
Accordingly, in this paper we aim to address the
two aforementioned limitations by making use of
physiological data collected by wearable devices in
order to diagnose fatigue. As opposed to in-lab sta-
tionary equipment, small general-purpose wearable
devices are more light-weight and user-friendly and
less invasive. The approach puts forward the hy-
pothesis that fatigue, albeit best detected directly us-
ing the traditional in-lab technology, can also be pre-
cisely and unambiguously correlated with some com-
mon physiological biomarkers collected or computed
by wearable sensors. In other words, we argue that
particular combinations of indicators which register
a detrimental change in the physical state of an indi-
vidual could be regarded as fatigue. As we further
discuss in more details below, these biomarkers may
include, for example, sleep activity, daytime physical
activity or heart rate data such as variability (HRV).
HRV (Matuz et al., 2021; Patel et al., 2011) and sleep
patterns (Virk et al., 2022) are highly linked to fatigue
levels, and have the advantage of being easily accessi-
ble through general-purpose fitness trackers equipped
with electrodermal activity sensors. These devices
(e.g. Fitbit) can provide timely feedback on the user’s
stress level based on sweat microbursts, and calcu-
late the so-called stress management score, in general
terms based on exertion balance, sleep patterns and
responsiveness (Watters, 2020). In this context, pro-
cessing of large amounts of collected time-series data
with some hidden patterns and correlations to be iden-
tified goes beyond the manual capabilities and natu-
rally calls for ML techniques to be applied. The high-
level conceptual architecture of this approach is de-
picted in Figure 1, highlighting the two key phases –
namely, model training and run-time operation. The
technical details of this implementation are further
discussed in Section 4.
3 RELATED WORKS
Fitness technology allows to capture the dynamicity
of activity-related data by collecting digital biomark-
ers and to correlate these cues with the development
of fatigue over time. Current technological advance-
ments in sensors have led to the emergence of a new
Machine Learning for Fatigue Detection using Fitbit Fitness Trackers
43

class of biomarkers used primarily in aiding the con-
tinuous monitoring of an individual’s health status.
Digital biomarkers are defined as objective, quantifi-
able physiological and behavioural indicators that are
collected and measured by means of digital devices
with the goal of explaining, influencing and/or pre-
dicting health-related outcomes (Wang et al., 2016;
Villa et al., 2020). Conclusively, clinically meaning-
ful, objective data can be captured by collecting and
analyzing these biomarkers. Some digital biomark-
ers that are common to relevant studies reflect knowl-
edge about activity levels (e.g. number of steps, ac-
tivity counts), walking speed (e.g. gait speed), vi-
tal signs (e.g. heart rate, heart rate variability, skin
temperature, respiratory rate) and sleep patterns (e.g.
sleep duration, time in different sleep stages) (Low
et al., 2021), and can be expressed in various units
(Vega et al., 2020). The devices used for collect-
ing these biomarkers are equipped with sensors that
may be placed on the human body, such as smart-
phone sensors (e.g. gyroscope, accelerometer) (Hamy
et al., 2020), wearable sensors (e.g. smartwatch,
fitness bracelet) (Kaewkannate and Kim, 2016), or
sense the surrounding environment, such as home and
ambient sensors (e.g. temperature, luminosity, noise
level, air quality, motion) (Alam et al., 2016; Mielke
et al., 2020; Sheikh et al., 2021). Some common
wearable devices used in studies are the ActiGraph
monitors, Vital Patch, Empatica EM4, Everion, Neu-
rosky Mindware (a type of EEG) and Shimmer IMU
Device. Diverse aspects linked to the quality of life
can be monitored, assessed and managed by contin-
uous, high-resolution, unbiased measurements such
as those provided by biomarkers (Kim et al., 2019;
Wilbur et al., 2018). To give some examples, Acti-
GraphGT3X (Hallman et al., 2015), ActiGraphGT1M
(Merriwether et al., 2018) and ActiGraphGT9X Link-
based studies (Perraudin et al., 2018) show how the
amount of time spent doing specific activities can lead
to the development of pain. This collected informa-
tion can then aid in improving pain treatment and as-
sessment (Leroux et al., 2021). Fatigue can also be
assessed both subjectively and objectively. Studies
show that multimodal digital data can be used with
success to capture self-reported non-pathological fa-
tigue measures (Luo et al., 2020). Some clinical as-
sessment tools for fatigue include one- or multidimen-
sional self-report instruments, such as the Visual Ana-
logue Scale (VAS) and the Fatigue Assesment Scale
(FAS). Everion devices paired with VAS (Luo et al.,
2020; Lee et al., 1991) and FAS (Michielsen et al.,
2003) reveal interesting correlations between fatigue
levels and specific measurements such as heart rate
variability, respiration rate, heart rate, activity counts
(sum of different activities), number of steps and en-
ergy expenditure. Other studies show how whole-
body measurements, such as accelerations, inclina-
tion angles, movement variability, duration and rep-
etitions, could also be regarded as fatigue indicators
(Maman et al., 2017). Other indices for fatigue and
poor mental health are sleep quality (Lavidor et al.,
2003), sleep duration (Wang et al., 2018), time spent
outdoors (Petersen et al., 2015), phone usage (Jacob-
son et al., 2020), speech characteristics (Lu et al.,
2012; Milosevic, 1997), unintended weight changes
and loss of interest or pleasure (American Psychiatric
Association, 2013; Sheikh et al., 2021). Fatigue is
also regarded as a symptom when identifying cancer
and is also present after treatment has been initiated
(Hofman et al., 2007). Thus, there are promising ev-
idences to support the conversion of the previously-
mentioned biomarkers and other additional cues (e.g.
age) into a set of categorical/numerical features used
for automated fatigue assessment. Once the potential
of fitness technology is better explored, one should
expect significant improvement in the areas of sport
medicine research, support technologies and gener-
ally public health. Using ML for fatigue assessment
has been explored for ECG and actigraphy sensors
in a study (Bai et al., 2020), where the participants
wore two medical-grade devices for seven days, and
assessed their fatigue during this period on a scale
from 0 to 10. Models created with linear regression
and LSTM neural networks were compared, with the
results showing that the latter method had the best per-
formance, using bothwb ECG and actigraphy as input
to the model.
4 IMPLEMENTATION
We now proceed with the explanation of Step 1: ML
Training of the proposed approach (Figure 1). We
first describe what the data set consists of and how
we collected it. Next, we explain the required pre-
processing steps and proceed with actual model train-
ing experiments.
4.1 Data Collection
All subjects of the study used a fitness tracker from
the brand Fitbit. The specific model was Fitbit Charge
5,
1
worn around the wrist. The sensors in this fit-
ness tracker include a 3-axis accelerometer, an optical
heart rate sensor, red and infrared sensors capable of
1
https://www.fitbit.com/global/us/products/trackers/
charge5
icSPORTS 2022 - 10th International Conference on Sport Sciences Research and Technology Support
44

measuring oxygen saturation, and a temperature sen-
sor. Fitbit provides cloud services that compute sev-
eral health- and wellbeing-related variables from the
raw data of the fitness tracker, and these variables can
either be downloaded manually from a user’s online
Fitbit account, or accessed through an API provided
by Fitbit. The Fitbit API does not expose all vari-
ables that are available in the manually downloaded
data. For example, the heart rate variability and var-
ious metrics describing the sleep quality (e.g. rest-
lessness score and duration score) are not available
through the API, but can be accessed when down-
loading the data manually through a user’s online ac-
count. In order to produce models that can be used
in an application integrated with the Fitbit cloud ser-
vices, we have restricted ourselves to using variables
that are available from the API. The variables that are
automatically collected and are available through the
Fitbit API are shown in Table 1 (some variables are
left out from the table because they provide redun-
dant information to the ones listed).Learning In addi-
tion to the data collected automatically by the activity
tracker, each person’s age, weight, height and gender
were also recorded.
Table 1: Available variables from the data set collected with
the Fitbit fitness tracker. The sleep stages include: Deep
sleep, light sleep, REM sleep and awake.
Type Variable Granularity
Activity
Calories burned Daily
Number of floors Daily
Sedentary minutes Daily
Lightly active
Daily
minutes
Fairly minutes Daily
Very minutes Daily
Number of steps Daily
Distance walked Daily
Heart rate
Heart rate time series 1 second
Resting heart rate Daily
Sleep
Duration Daily
Efficiency Daily
Start time Daily
End time Daily
Main sleep or nap Daily
Sleep stage duration 1 second
Number of
Dailyoccurences of
sleep stage
The participants wore the Fitbit fitness tracker in
their daily life for seven days, both during day- and
night-time. They were not told to follow any specific
study protocol. The data collected from the activity
Figure 2: Distribution of FAS-scores in the collected
dataset.
tracker was then downloaded from each of the sub-
jects’ user accounts. At the end of the seven days,
the participants filled out a questionnaire in order to
give them a score on the Fatigue Assessment Scale
(FAS) (Michielsen et al., 2003). This is a scale that at-
tempts to assess the level of chronic fatigue for a per-
son, and has been shown to be one of the most promis-
ing fatigue questionnaires (De Vries et al., 2003). The
questionnaire consists of 10 statements about how a
person feels, where each statement can be ranked on
a scale from 1 (never) to 5 (always). The score given
to each of the statements are summed, resulting in a
FAS-score in the range 10-50. Table 2 shows how the
FAS-score can be put in to three distinct categories
indicating the level of chronic fatigue of a subject.
Table 2: Ranges of the Fatigue Assessment Scale (FAS) and
the corresponding categories.
FAS-score Category
10-21 No fatigue
22-34 Fatigue
35-50 Extreme fatigue
The data was collected with consent from all par-
ticipants, and in accordance with the data protection
regulations in Greece. After the collection, the data
was also anonymised (i.e. any personally identifiable
information was removed) before sharing it externally
for training. Secure storage and transferring of the
data was ensured at all times to prevent unauthorised
access or disclosure.
4.1.1 Participants and Dataset Distribution
In total, 35 subjects participated in the data collection,
of which 31 were female and 4 were male. The mean
age of the subjects were 45±13 years. Figure 2 shows
the age distribution of the dataset, and Figure 3 shows
the distribution of FAS-scores.
4.2 Data Preprocessing
The data preparation pipeline is based on our previ-
ous work addressing similar challenges (Husom et al.,
Machine Learning for Fatigue Detection using Fitbit Fitness Trackers
45
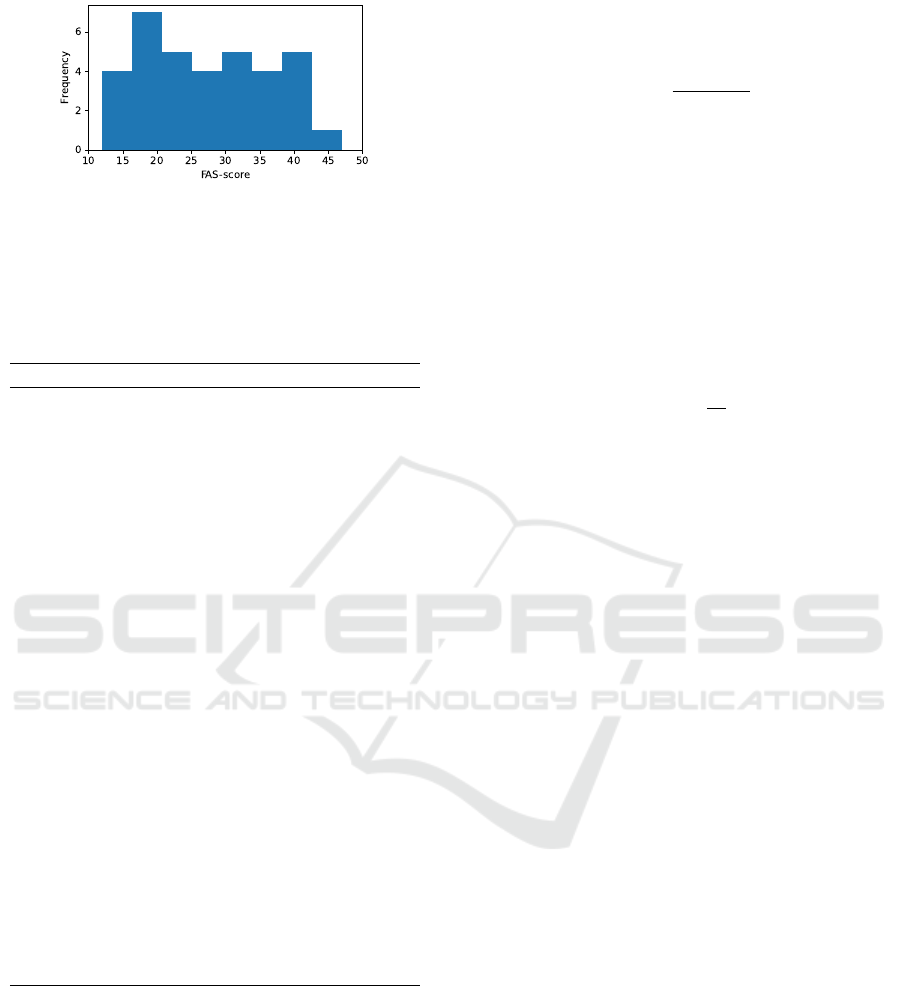
Figure 3: Distribution of FAS-scores in the collected
dataset.
Table 3: Features extracted from the Fitbit fitness tracker
data. PCC represents the Pearson Correlation Coefficient
between each feature and the FAS-score. The twelve fea-
tures with the strongest (including both positive and nega-
tive values) PCC is highlighted with bold typeface.
Feature name Unit PCC
Sleep total duration minutes 0.072
Sleep efficiency score, 0-100 -0.066
Deep sleep duration minutes -0.054
Light sleep duration minutes 0.173
REM sleep duration minutes -0.059
Awake in bed duration minutes -0.029
Deep sleep count count -0.047
Light sleep count count 0.085
REM sleep count count -0.109
Awake in bed count count -0.012
Sedentary minutes minutes 0.138
Lightly active minutes minutes -0.082
Fairly active minutes minutes 0.027
Very active minutes minutes -0.149
Average heart rate beats per min 0.211
Minimum heart rate beats per min 0.333
Maximum heart rate beats per min 0.027
Resting heart rate beats per min 0.265
Calories burned kcal -0.092
Steps count -0.055
Distance meters -0.068
Age years 0.338
Gender female/male -0.394
Weight kg 0.143
Height cm -0.193
Body Mass Index kg/m
2
0.275
2022; Sen et al., 2021) and partially repeats some of
the generic reusable steps, while task-specific tasks,
i.e. related to the Fitbit data format and the target ap-
plication scenario, have been developed from scratch.
From the variables available from the Fitbit API (see
Table 1 we extracted a set of features to use as input
to the ML models. These features are presented in
Table 3, together with the Pearson Correlation Coef-
ficient (PCC) ρ to the FAS-score. The PCC between
two variables X and y is used to evaluate the linear
correlation between them, and is calculated using the
formula (Pearson, 1896):
ρ
X,y
=
cov(X, y)
σ(X)σ(y)
, (1)
where cov is the covariance and σ is the standard
deviation.
While most of the features in Table 3 are taken
directly from the Fitbit API without any feature en-
gineering, we have extracted the average, minimum
and maximum from the heart rate time series. In ad-
dition, both the duration and the number of occur-
rences of the four different sleep stages (deep sleep,
light sleep, REM sleep and awake) are used as input
features. Lastly, we calculated the Body Mass Index
(BMI) for each subject:
BMI =
w
h
2
(2)
where w is the body weight in kilograms, and h is
the height in meters. We added this value as an input
feature, since it showed a mild positive correlation to
the FAS-score (ρ = 0.275).
We selected the twelve features with strongest cor-
relation (either positive or negative) to the FAS-score
to be input features when training our ML models.
These features are highlighted with bold typeface in
Table 3.
The data set was split into a training set (70%)
and a test set (30%). The training data set was used
for building ML models (Step 1 in Figure 1), while
the test data set was used for evaluating the model
performance using the metrics described in Section
4.3 (used to simulate Step 2 in Figure 1). All input
features were scaled down to the range [0, 1], in order
to be given equal weight when processed by the ML
algorithms.
We investigated how the number of input time
steps affected the models’ ability to estimate the FAS-
score. The features are calculated in a way that gives
one data point per day, and the subjects wore the ac-
tivity tracker for seven days, which means that we can
use from one to seven data points as input to the mod-
els.
4.3 Creating Machine Learning Models
We applied and compared six different ML algo-
rithms in our attempt to create a model that can es-
timate the FAS-score based on fitness tracker data:
Decision Tree (DT), Random Forest (RF), XGBoost
(XGB), k-Nearest Neighbor (kNN), Fully-Connected
Neural Network (FCNN) and LSTM (Long Short-
Term Memory) neural network. The goal of all these
icSPORTS 2022 - 10th International Conference on Sport Sciences Research and Technology Support
46

algorithms is to create a mapping between a set of in-
put features X, in this case the data collected using
the Fitbit tracker, and an output target y, which in our
context is the FAS-score. DT is a method for cre-
ating a model based on decision rules learned from
the input features. RF and XGB are ensemble learn-
ers, which means that the models are combinations of
multiple base estimators. For both ensemble learn-
ers we have used decision trees as the base estimator.
kNN is an algorithm that predicts the output of a given
input based on the average of the k nearest neighbors
in the training data set. FCNN and LSTM are deep
learning algorithms. FCNN is a feed-forward neural
network, where information only passes in one direc-
tion, while LSTM is a type of recurrent neural net-
work, where the units of the network have feedback
connections and are specifically designed to handle
sequential input data (Hochreiter and Schmidhuber,
1997). To create models with the neural network al-
gorithms, FCNN and LSTM, we used the library Ten-
sorFlow
2
and the Keras API.
3
The remaining methods
were used through the Scikit-learn
4
library.
The various ML algorithms have several hyper-
parameters that control the configuration of the al-
gorithm and the training process. These hyper-
parameters must be tuned in order to create models
with high-performance. This is done by running mul-
tiple experiments with different configurations, and
using a small part of the training data as validation
data. The validation data will not be used directly
for training, but for measuring the performance of
the model with different choices of hyper-parameters.
The hyper-parameters for each ML algorithm, except
FCNN and LSTM, are shown in Table 4, where we
also present the values and ranges that were a part
of the hyper-parameter search. The hyper-parameter
tuning for the algorithms listed in Table 4 was per-
formed Scikit-learn’s built-in functionality using ran-
dom search. While grid search and manual search for
the best combination of hyper-parameters have been
widely used, random search has proven to be more
efficient (Bergstra and Bengio, 2012). In many cases
the search space for hyper-parameters is enormous,
which makes random search the only viable option.
For the deep learning methods, FCNN and LSTM,
automatic hyper-parameter tuning is very computa-
tionally expensive, because not only does the result
depend on the number of layers, nodes, which activa-
tion function is used etc., but also on the number of
training epochs (i.e. training duration). We opted for
using a manual trial-and-error process for choosing
2
https://www.tensorflow.org/
3
https://keras.io/
4
https://scikit-learn.org/
the architecture for the neural networks, since such an
approach is easier to monitor and control. Further-
more, we aimed for keeping the neural network ar-
chitectures simple to keep the computational cost of
running the models low, increasing the usability on
resource-constrained devices (e.g. running ML infer-
ence locally on smartphones in case network connec-
tivity is limited). We started with networks consisting
of few layers and nodes, and expanded the complexity
while monitoring the error metrics until we observed
promising performance. We arrived at the following
configurations of the deep learning methods:
• FCNN: 1 hidden layer with 8 nodes and Rectified
Linear Unit (ReLU) activation in each node.
• LSTM: 1 LSTM layer with 8 hidden units and sig-
moid activation in each unit.
To evaluate the performance of the models we use
the Mean Squared Error (MSE), defined as:
MSE =
1
n
n
∑
i=1
( ˆy
i
− y
i
)
2
, (3)
where n is the number of samples, y is the actual
values and ˆy is the predicted values. The MSE is a
common error metric for regression models, and is
typically used when training models since it measures
the difference between the predictions and the ground
truth. We also use R
2
-score, often referred to as the
coefficient of determination:
R
2
= 1 −
∑
n
i=1
(y
i
− ˆy
i
)
2
∑
n
i=1
(y
i
− ¯y)
2
, (4)
where ¯y is defined as:
¯y =
1
n
n
∑
i=1
y
i
, (5)
i.e. the mean of the true observations y. The R
2
-
score represents the ratio between the variance ex-
plainable by the model and the total variance. A per-
fect fit will give an R
2
-score of 1, while a score of 0
will indicate that the model performs equally to pre-
dicting the mean of the actual observations for any
input. This error metric has the advantage of being
interpretable independent of the input variables, un-
like MSE, where the magnitude of the error depends
on the scale of the input data.
Machine Learning for Fatigue Detection using Fitbit Fitness Trackers
47
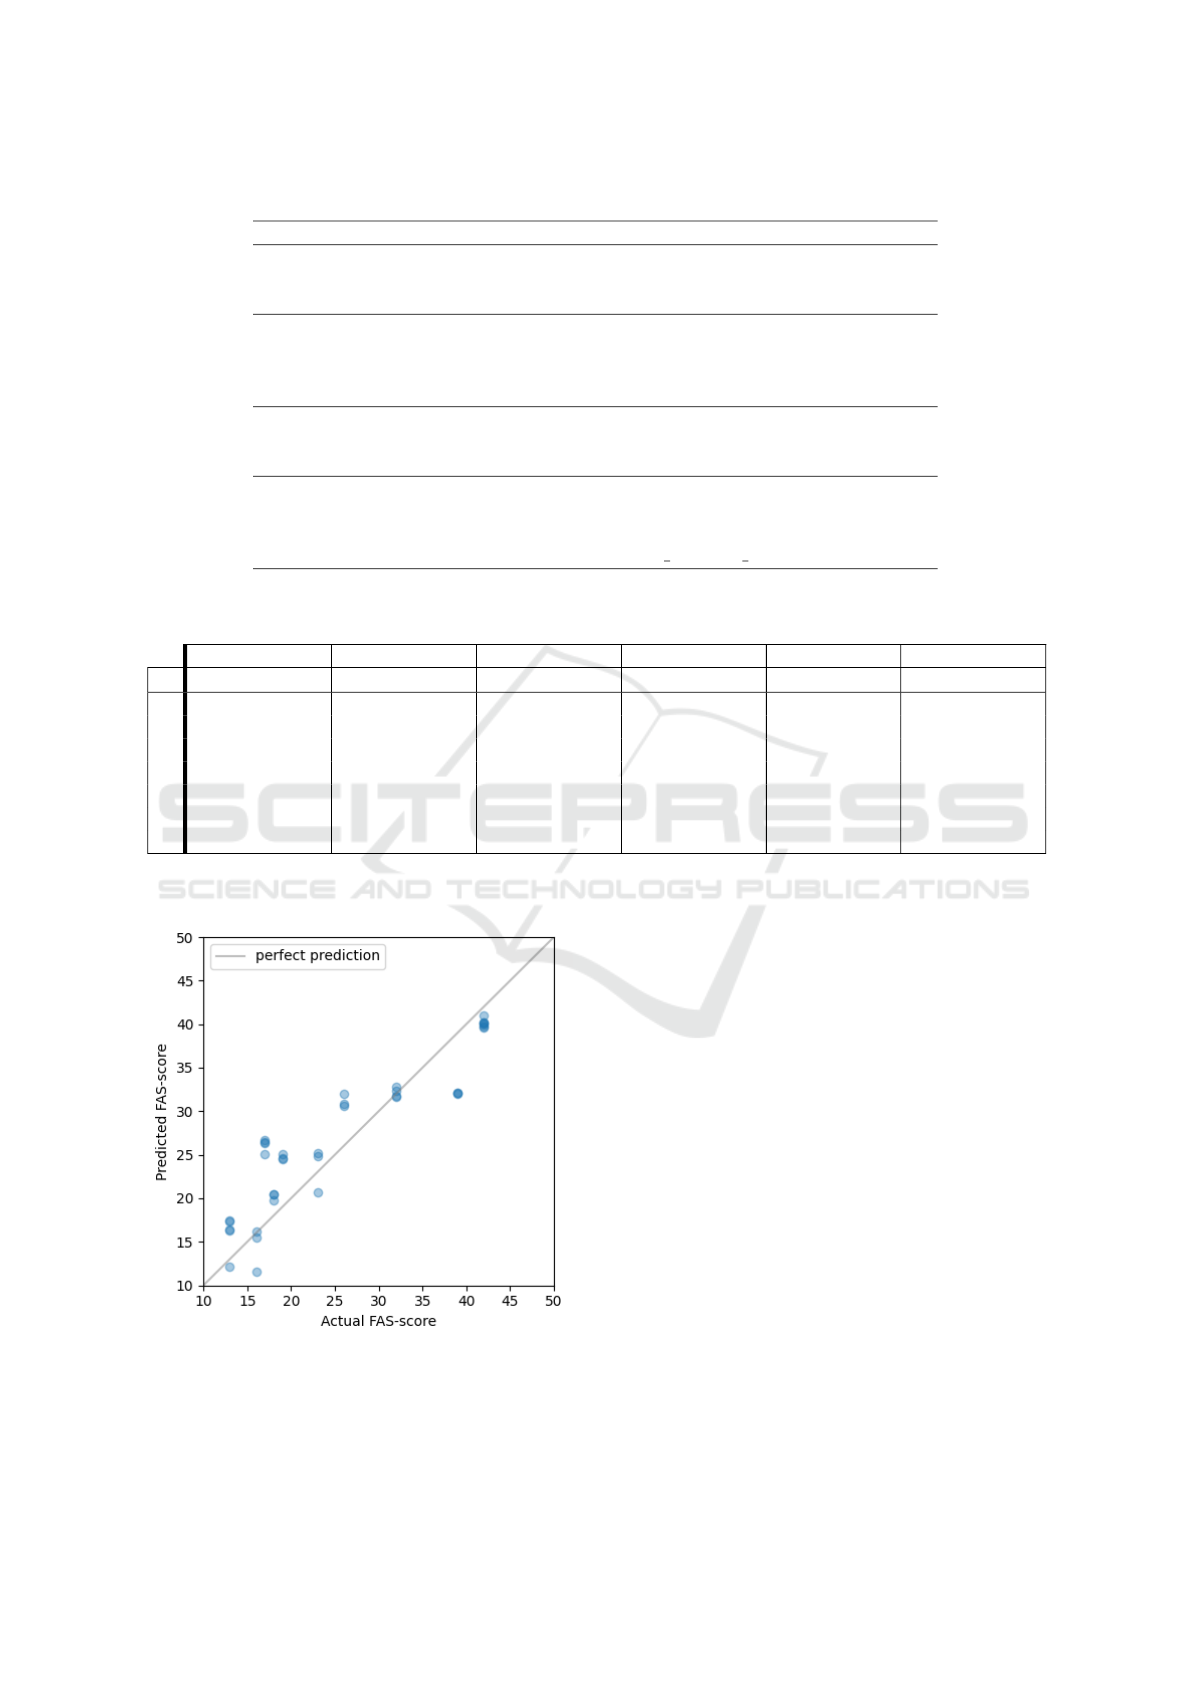
Table 4: Hyper-parameters for the ML algorithms and the values that were tested to tune them.
ML algorithm Hyper-parameter Values
DT
Max depth 2, 5, 10, 15, 20, 50, 100
Minimum samples split 2, 5, 10
Minimum samples leaf 1, 3, 5
RF
Max depth 2, 5, 10, 15, 20, 50, 100
Number of estimators 50, 100, 200, 400, 600, 800, 1000, 1200
Minimum samples split 2, 5, 10
Minimum samples leaf 1, 3, 5
XGB
Max depth 2, 5, 10, 15, 20, 50, 100
Number of estimators 50, 100, 200, 400, 600, 800, 1000, 1200
Learning rate 0.3, 0.1, 0.001, 0.0001
kNN
Number of neighbors 2, 4, 5, 6, 10, 15, 20, 30
Weights uniform or distance
Leaf size 10, 30, 50, 80, 100
Algorithm ball tree, kd tree or brute
Table 5: Model performance of the six different ML algorithms for estimating the Fatigue Assessment Score (FAS). d repre-
sents the number of time steps (days) of the input features that were used as input to the model to estimate the FAS-score.
DT RF XGB kNN FCNN LSTM
d MSE R
2
MSE R
2
MSE R
2
MSE R
2
MSE R
2
MSE R
2
1 141.7 -0.410 159.6 -0.588 127.2 -0.266 84.5 0.159 29.4 0.708 104.3 -0.038
2 136.9 -0.334 156.9 -0.529 123.2 -0.201 91.9 0.104 24.1 0.765 117.8 -0.149
3 150.9 -0.430 154.7 -0.467 125.3 -0.188 102.3 0.030 22.4 0.787 110.3 -0.046
4 194.3 -0.795 147.8 -0.364 121.2 -0.119 108.9 -0.005 21.4 0.803 126.5 -0.169
5 146.7 -0.304 138.6 -0.232 102.8 0.086 115.6 -0.027 20.8 0.815 130.4 -0.159
6 144.2 -0.207 137.7 -0.153 119.5 -0.001 116.7 0.023 25.3 0.788 205.9 -0.724
7 180.8 -0.362 151.6 -0.142 137.2 -0.033 146.0 -0.022 27.4 0.794 135.8 -0.023
Figure 4: Predicted FAS-scores plotted against the actual
values for the best model with an R
2
score of 0.815: FCNN
using the 5 last days of data as input. The grey line repre-
sents the ideal fit.
5 RESULTS AND DISCUSSION
The results of our analysis are shown in Table 5,
where we compare the error metrics MSE and R
2
for
the six different ML algorithms. These scores were
produced using the test data set, which consisted of
30% of the complete training data. We ensured that
the test data set contained a similar distribution of
FAS-scores as the training set, meaning that we had
equal ratios of subjects from each of the three FAS
categories (see Table 2) in both sub-sets. Due to the
limited number of subjects, we were unable to keep
the age distribution similar while maintaining a simi-
lar distribution of FAS-scores. The value d in Table 5
represents how many time steps (days) from the input
data that were used as input to the models.
Table 6 shows the hyper-parameters used for each
of the models. The network architectures for FCNN
and LSTM were kept the same for all values of d,
due to the computational cost of running a hyper-
parameter search on neural networks. For the remain-
ing methods, we performed a hyper-parameter search
icSPORTS 2022 - 10th International Conference on Sport Sciences Research and Technology Support
48

Table 6: Configuration of ML algorithms after hyper-parameter tuning, corresponding to the results shown for each model in
Table 5.
ML algorithm Hyper-parameter d = 1 d = 2 d = 3 d = 4 d = 5 d = 6 d = 7
DT
Max depth 50 20 15 100 20 50 100
Minimum samples split 10 10 10 2 5 10 2
Minimum samples leaf 1 3 3 5 3 1 5
RF
Max depth 2 2 10 10 100 100 10
Number of estimators 600 600 50 200 200 200 100
Minimum samples split 5 5 10 10 2 2 5
Minimum samples leaf 3 3 5 5 5 5 5
XGB
Max depth 50 15 15 15 15 5 20
Number of estimators 400 50 50 50 50 800 400
Learning rate 0.3 0.1 0.1 0.1 0.1 0.3 0.1
kNN
Number of neighbors 30
Weights distance
Leaf size 10
Algorithm kd tree
FCNN
Number of layers 1
Number of nodes in each layer 8
LSTM
Number of units 8
Dropout rate 0.2
for each of the d-values. The hyper-parameters cho-
sen for kNN were the same for any d-value.
The best performing model, made with a FCNN
with d = 5, is highlighted in bold typeface, with MSE
= 20.8 and R
2
= 0.815. The models created with
DT, RF, XGB, kNN and LSTM all had MSE > 100.
Only FCNN, XGB and kNN were able to produce at
least one model with positive R
2
-scores, meaning that
the estimations of the rest of the models are worse
than predicting the mean of the scores of the test set.
FCNN had R
2
> 0.7 for all models, with the best per-
formance using d = 5. This indicates that it is benefi-
cial to have information for a period of multiple days
when using an FCNN to estimate a FAS-score. Sim-
ilar research on fatigue assessment using ML on sen-
sor data (Bai et al., 2020) showed using deep learning
(specifically a type of LSTM network) gave higher
performance than a traditional ML method (linear re-
gression). However, the differences in both input fea-
tures and fatigue assessment method compared to our
approach makes it challenging to compare these re-
sults directly.
The results from our study indicate that deep
learning can be used to create models for estimat-
ing fatigue, by using multivariate sensor data from
a wearable activity tracker. An intuitive measure of
the model performance is Mean Absolute Percentage
Error, which for our best model (created using FCNN
and d = 5) was 0.18. This means that the model had
an average error of 18% when estimating fatigue
on our test data set.
5.1 Limitations and Threats to Validity
We selected which features to use as input to the
model based on their linear correlation (Pearson Cor-
relation Coefficient) to the target, but none of the
PCCs exceeded 0.4. Since all features showed a rela-
tively low correlation, it is not surprising that none of
the traditional (non-deep learning) ML methods was
able to produce models capable of fatigue estimation.
Even though the best FCNN model had an R
2
-score
of 0.815, one should be careful about drawing too
strong conclusions from these results, due to the lim-
ited number of participants in the study, and the fact
that four out of six ML algorithms did not achieve a
positive R
2
-score when evaluated on the test set. Fur-
thermore, the dataset is heavily gender-imbalanced,
with 89% of the subjects being female, which does
not guarantee that the models we have created will
have similar performance on male subjects.
While most of the input features we used
are generic, and can either be collected by most
commercially-available activity trackers or do not de-
pend on an activity tracker at all (e.g. age, gender,
weight, height, heart rate and calories burned), the
features related to active minutes and sleep are com-
puted using Fitbit’s proprietary closed-source algo-
rithms. This means that we are not aware of how these
features are calculated from the raw activity tracker
data, and whether that makes the models created with
these features specific to the data collected using Fit-
bit activity trackers. Furthermore, future adjustments
or changes to the algorithms by Fitbit might affect
Machine Learning for Fatigue Detection using Fitbit Fitness Trackers
49

the performance in unpredictable ways for a deployed
model.
6 CONCLUSIONS
Correctly and promptly diagnosing fatigue among re-
mote workers has a significant social and healthcare
impact, as timely detection of health deterioration
leads to improved well-being and better medical treat-
ment. From a financial perspective, this can also re-
duce potential costs incurred due to patient transporta-
tion, which is especially challenging in offshore mar-
itime conditions (e.g. vessel diversion or evacuation
by a helicopter). Furthermore, reducing such unfore-
seen transportation activities may also minimise the
pollution footprint caused by air and water emissions.
All of these factors emphasise the need for con-
tinuous real-time fatigue detection to pro-actively re-
act to and prevent potential accidents. To achieve this
goal, this paper described our approach to automated
fatigue detection using ML techniques and physiolog-
ical data collected by general-purpose fitness track-
ers (as opposed to medical-grade stationary equip-
ment). The approach is based on the hypothesis that
human fatigue can be correlated with some common
biomarkers, such as sleep activity and heart rate, and
identifying these hidden patterns was done using sev-
eral ML algorithms, among which Fully-Connected
Neural Networks demonstrated best results. Using
this method, we were able to predict the FAS-score
with an average error of 18% when estimating fatigue
on the test data set.
Although the main target users of this approach
are remote in-field workers, it is also relevant to var-
ious sports and recreational activities where people
have to spend long time in remote hostile environ-
ments under continuous physical or mental pressure,
with limited or no immediate access to healthcare ser-
vices.
As of today, we have tested the developed ap-
proach on a limited data set collected in lab conditions
in the context of a relatively small-scale data collec-
tion study. While the results are promising, the imme-
diate next step for further work will be to empirically
validate the approach with real-life users over a longer
period of time. It is expected that the provided feed-
back on the accuracy of the predictions as well as new
data will require further tuning of the models, which
is an established practice in ML engineering.
In this respect, a possible addition to this real-
life validation will be to implement the whole ap-
proach as an automated pipeline, where newly col-
lected biomarkers along with FAS questionnaires can
fuel the incremental re-training of the model in au-
tomated manner. Such implementation is possible
using Continual ML (or Life-long ML) techniques
(Liu, 2017). This will, however, require significant
architecture design and implementation efforts for the
whole application stack and the data pipeline from
wearable sensors through smartphone gateways to
cloud platforms. As an alternative to such a ‘verti-
cal’ architecture (Dautov and Distefano, 2017; Dau-
tov et al., 2019), we will also explore the distributed
architecture for ML training (Dautov and Distefano,
2019) in the absence of a centralised cloud by apply-
ing Federated ML techniques – an emerging paradigm
for training ML models in a distributed manner on
several nodes using local data, and then merging these
individual elements into a global shared model (Yang
et al., 2019). While keeping the sensitive personal in-
formation locally (which is especially important for
healthcare-related scenarios), this will still yield a
fully-functional ML model.
ACKNOWLEDGEMENTS
The research leading to these results has been sup-
ported by a grant from Iceland, Liechtenstein and
Norway through the EEA Grants Greece 2014-2021,
in the frame of the “Business Innovation Greece”
programme. This work was also partly supported
by the InterQ project (958357) and the DAT4.ZERO
project (958363) funded by the European Commis-
sion within the Horizon 2020 research and innovation
programme.
REFERENCES
Alam, M. G. R., Abedin, S. F., Al Ameen, M., and Hong,
C. S. (2016). Web of objects based ambient assisted
living framework for emergency psychiatric state pre-
diction. Sensors, 16(9):1431.
American Psychiatric Association (2013). Diagnostic and
statistical manual of mental disorders: DSM-5. Amer-
ican Psychiatric Association, Washington, DC, 5 edi-
tion.
Bai, Y., Guan, Y., and Ng, W.-F. (2020). Fatigue assessment
using ecg and actigraphy sensors. In Proceedings of
the 2020 International Symposium on Wearable Com-
puters, pages 12–16.
Bergstra, J. and Bengio, Y. (2012). Random search for
hyper-parameter optimization. Journal of machine
learning research, 13(2).
Christ, G. (2016). Burnt Out: Stress on the Job [Info-
graphic]. https://www.ehstoday.com/health/article/
21917550/burnt-out-stress-on-the-job-infographic.
[Online; accessed 7-June-2022].
icSPORTS 2022 - 10th International Conference on Sport Sciences Research and Technology Support
50

Dautov, R. and Distefano, S. (2017). Three-level hierarchi-
cal data fusion through the IoT, edge, and cloud com-
puting. In Proceedings of the 1st International Con-
ference on Internet of Things and Machine Learning,
pages 1–5.
Dautov, R. and Distefano, S. (2019). Automating IoT data-
intensive application allocation in clustered edge com-
puting. IEEE Transactions on Knowledge and Data
Engineering, 33(1):55–69.
Dautov, R., Distefano, S., Bruneo, D., Longo, F., Mer-
lino, G., and Puliafito, A. (2017). Pushing intelli-
gence to the edge with a stream processing architec-
ture. In 2017 IEEE International Conference on Inter-
net of Things (iThings) and IEEE Green Computing
and Communications (GreenCom) and IEEE Cyber,
Physical and Social Computing (CPSCom) and IEEE
Smart Data (SmartData), pages 792–799. IEEE.
Dautov, R., Distefano, S., and Buyya, R. (2019). Hierarchi-
cal data fusion for Smart Healthcare. Journal of Big
Data, 6(1):1–23.
De Vries, J., Michielsen, H. J., and Van Heck, G. L. (2003).
Assessment of fatigue among working people: a com-
parison of six questionnaires. Occupational and envi-
ronmental medicine, 60(suppl 1):i10–i15.
Gander, P., Hartley, L., Powell, D., Cabon, P., Hitchcock,
E., Mills, A., and Popkin, S. (2011). Fatigue risk man-
agement: Organizational factors at the regulatory and
industry/company level. Accident Analysis & Preven-
tion, 43(2):573–590.
Ganster, D. C. and Rosen, C. C. (2013). Work stress and
employee health: A multidisciplinary review. Journal
of management, 39(5):1085–1122.
Gordon, R. P. (1998). The contribution of human factors
to accidents in the offshore oil industry. Reliability
Engineering & System Safety, 61(1-2):95–108.
Hallman, D. M., Gupta, N., Mathiassen, S. E., and Holter-
mann, A. (2015). Association between objectively
measured sitting time and neck–shoulder pain among
blue-collar workers. International Archives of Oc-
cupational and Environmental Health, 88(8):1031–
1042.
Hamy, V., Garcia-Gancedo, L., Pollard, A., Myatt, A.,
Liu, J., Howland, A., Beineke, P., Quattrocchi, E.,
Williams, R., and Crouthamel, M. (2020). Develop-
ing smartphone-based objective assessments of phys-
ical function in rheumatoid arthritis patients: the PA-
RADE study. Digital biomarkers, 4(1):26–44.
Hellesøy, O. H. (1985). Work Environment, Statfjord Field:
Work Environment, Health, and Safety on a North Sea
Oil Platform. Universitetsforlaget.
Hochreiter, S. and Schmidhuber, J. (1997). Long short-term
memory. Neural computation, 9(8):1735–1780.
Hockey, R. (2013). The psychology of fatigue: Work, effort
and control. Cambridge University Press.
Hofman, M., Ryan, J. L., Figueroa-Moseley, C. D., Jean-
Pierre, P., and Morrow, G. R. (2007). Cancer-related
fatigue: the scale of the problem. The oncologist,
12(S1):4–10.
Husom, E. J. B. G., Bernab
´
e, P., and Sen, S. (2022). Deep
learning to predict power output from respiratory in-
ductive plethysmography data. Applied AI Letters,
3(2):e65.
Jacobson, N. C., Summers, B., and Wilhelm, S. (2020).
Digital biomarkers of social anxiety severity: digital
phenotyping using passive smartphone sensors. Jour-
nal of medical Internet research, 22(5):e16875.
Kaewkannate, K. and Kim, S. (2016). A comparison of
wearable fitness devices. BMC public health, 16(1):1–
16.
Karuppusamy, N. S. and Kang, B.-Y. (2020). Multi-
modal System to Detect Driver Fatigue Using EEG,
Gyroscope, and Image Processing. IEEE Access,
8:129645–129667.
Kim, D. H., Nam, K. H., Choi, B. K., Han, I. H., Jeon,
T. J., and Park, S. Y. (2019). The Usefulness of a
Wearable Device in Daily Physical Activity Monitor-
ing for the Hospitalized Patients Undergoing Lumbar
Surgery. Journal of Korean Neurosurgical Society,
62(5):561.
Kudo, Y., Arai, M., and Miki, N. (2017). Fatigue assess-
ment by electroencephalogram measured with candle-
like dry microneedle electrodes. Micro & Nano Let-
ters, 12(8):545–549.
Lavidor, M., Weller, A., and Babkoff, H. (2003). How sleep
is related to fatigue. British journal of health psychol-
ogy, 8(1):95–105.
Lee, K. A., Hicks, G., and Nino-Murcia, G. (1991). Validity
and reliability of a scale to assess fatigue. Psychiatry
research, 36(3):291–298.
Leroux, A., Rzasa-Lynn, R., Crainiceanu, C., and Sharma,
T. (2021). Wearable devices: current status and oppor-
tunities in pain assessment and management. Digital
Biomarkers, 5(1):89–102.
Liu, B. (2017). Lifelong machine learning: a paradigm for
continuous learning. Frontiers of Computer Science,
11(3):359–361.
Low, C. A., Li, M., Vega, J., Durica, K. C., Ferreira, D.,
Tam, V., Hogg, M., Zeh III, H., Doryab, A., and Dey,
A. K. (2021). Digital biomarkers of symptom bur-
den self-reported by perioperative patients undergo-
ing pancreatic surgery: prospective longitudinal study.
JMIR cancer, 7(2).
Lu, H., Frauendorfer, D., Rabbi, M., Mast, M. S., Chit-
taranjan, G. T., Campbell, A. T., Gatica-Perez, D., and
Choudhury, T. (2012). StressSense: Detecting stress
in unconstrained acoustic environments using smart-
phones. In Proceedings of the 2012 ACM conference
on ubiquitous computing, pages 351–360.
Luo, H., Lee, P.-A., Clay, I., Jaggi, M., and De Luca, V.
(2020). Assessment of fatigue using wearable sensors:
a pilot study. Digital biomarkers, 4(1):59–72.
Maman, Z. S., Yazdi, M. A. A., Cavuoto, L. A., and Mega-
hed, F. M. (2017). A data-driven approach to model-
ing physical fatigue in the workplace using wearable
sensors. Applied ergonomics, 65:515–529.
Marino, F. E. (2019). Human Fatigue: Evolution, Health
and Performance. Routledge.
Matuz, A., van der Linden, D., Zsolt, K., Hernadi, I.,
Kazmer, K., and Csatho, A. (2021). Enhanced cardiac
vagal tone in mental fatigue: Analysis of heart rate
Machine Learning for Fatigue Detection using Fitbit Fitness Trackers
51

variability in Time-on-Task, recovery, and reactivity.
Plos one, 16(3):e0238670.
Merriwether, E. N., Frey-Law, L. A., Rakel, B. A., Zim-
merman, M. B., Dailey, D. L., Vance, C. G., Golchha,
M., Geasland, K. M., Chimenti, R., Crofford, L. J.,
et al. (2018). Physical activity is related to function
and fatigue but not pain in women with fibromyal-
gia: baseline analyses from the Fibromyalgia Activ-
ity Study with TENS (FAST). Arthritis research &
therapy, 20(1):1–13.
Michielsen, H. J., De Vries, J., and Van Heck, G. L. (2003).
Psychometric qualities of a brief self-rated fatigue
measure: The fatigue assessment scale. Journal of
psychosomatic research, 54(4):345–352.
Mielke, C., Antons, R., and Haux, R. (2020). Detection
of psychomotor agitation pattern from motion sensor
data in a living environment of a patient with demen-
tia. In Digital Personalized Health and Medicine,
pages 746–750. IOS Press.
Milosevic, S. (1997). Drivers’ fatigue studies. Ergonomics,
40(3):381–389.
Patel, M., Lal, S. K., Kavanagh, D., and Rossiter, P. (2011).
Applying neural network analysis on heart rate vari-
ability data to assess driver fatigue. Expert systems
with Applications, 38(6):7235–7242.
Pearson, K. (1896). VII. Mathematical contributions to the
theory of evolution. – III. Regression, heredity, and
panmixia. Philosophical Transactions of the Royal
Society of London. Series A, containing papers of a
mathematical or physical character, (187):253–318.
Perraudin, C. G., Illiano, V. P., Calvo, F., O’Hare, E., Don-
nelly, S. C., Mullan, R. H., Sander, O., Caulfield, B.,
and Dorn, J. F. (2018). Observational Study of a Wear-
able Sensor and Smartphone Application Supporting
Unsupervised Exercises to Assess Pain and Stiffness.
Digital Biomarkers, 2(3):106–125.
Petersen, J., Austin, D., Mattek, N., and Kaye, J. (2015).
Time out-of-home and cognitive, physical, and emo-
tional wellbeing of older adults: a longitudinal mixed
effects model. PloS one, 10(10):e0139643.
S¸ahinkaya, B. and Oktal, H. (2021). Modeling of Aircrew
Rostering Problem with Fatigue Risk Management
Approach. The International Journal of Aerospace
Psychology, 31(3):269–282.
Sen, S., Bernab
´
e, P., and Husom, E. J. B. (2021). Deepventi-
lation: learning to predict physical effort from breath-
ing. In Proceedings of the Twenty-Ninth International
Conference on International Joint Conferences on Ar-
tificial Intelligence, pages 5231–5233.
Sheikh, M., Qassem, M., and Kyriacou, P. A. (2021). Wear-
able, Environmental, and Smartphone-Based Passive
Sensing for Mental Health Monitoring. Frontiers in
Digital Health, page 33.
Srivastava, D. K. and Tiwari, P. K. (2021). Prevention of
road accidents due to drowsiness detection using PER-
CLOS algorithm. Journal of discrete mathematical
sciences and cryptography, 24(5):1429–1437.
Stern, J. M. (2005). Atlas of EEG patterns. Lippincott
Williams & Wilkins.
Vega, J., Li, M., Aguillera, K., Goel, N., Joshi, E., Durica,
K., Kunta, A., and Low, C. (2020). RAPIDS: Repro-
ducible Analysis Pipeline for Data Streams Collected
with Mobile Devices. Journal of Medical Internet Re-
search.
Villa, M. G., Palsson, T. S., Royo, A. C., Bjarkam, C. R.,
and Boudreau, S. A. (2020). Digital pain mapping
and tracking in patients with chronic pain: Longitu-
dinal study. Journal of Medical Internet Research,
22(10):e21475.
Virk, J. S., Singh, M., Panjwani, U., and Ray, K. (2022). An
intelligent framework for detection of fatigue induced
by sleep-deprivation. Journal of Intelligent & Fuzzy
Systems, 42(2):1223–1233.
Wang, R., Wang, W., DaSilva, A., Huckins, J. F., Kelley,
W. M., Heatherton, T. F., and Campbell, A. T. (2018).
Tracking depression dynamics in college students us-
ing mobile phone and wearable sensing. Proceed-
ings of the ACM on Interactive, Mobile, Wearable and
Ubiquitous Technologies, 2(1):1–26.
Wang, T., Azad, T., and Rajan, R. (2016). The
emerging influence of digital biomarkers on health-
care. https://rockhealth.com/insights/the-emerging-
influence-of-digital-biomarkers-on-healthcare/. [On-
line; accessed 7-June-2022].
Watters, E. (2020). From Fitbit to Mindfit: The Stress Man-
agement Score Helps People Recognize How Their
Body Reacts to Stress. https://blog.fitbit.com/fitbit-
stress-management-approach. [Online; accessed 7-
June-2022].
Wilbur, R. E., Griffin, J. S., Sorensen, M., and Furberg,
R. D. (2018). Establishing digital biomarkers for oc-
cupational health assessment in commercial salmon
fishermen: protocol for a mixed-methods study. JMIR
Research Protocols, 7(12):e10215.
Yang, Q., Liu, Y., Cheng, Y., Kang, Y., Chen, T., and Yu, H.
(2019). Federated learning. Synthesis Lectures on Ar-
tificial Intelligence and Machine Learning, 13(3):1–
207.
Zhang, J., Chen, Z., Liu, W., Ding, P., and Wu, Q. (2021).
A Field Study of Work Type Influence on Air Traf-
fic Controllers’ Fatigue Based on Data-Driven PERC-
LOS Detection. International journal of environmen-
tal research and public health, 18(22):11937.
icSPORTS 2022 - 10th International Conference on Sport Sciences Research and Technology Support
52
