
An Extremal Optimization Algorithm for Improving Gaussian Mixture
Search
Rodica Ioana Lung
a
Center for the Study of Complexity, Babes¸ -Bolyai University, Cluj Napoca, Romania
Keywords:
Clustering, Gaussian Mixture, Extremal Optimization.
Abstract:
Many standard clustering methods rely on optimizing a maximum likelihood function to reveal internal con-
nections within data. While relying on the same model, alternative approaches may provide better insight into
the division of data. This paper presents a new Gaussian mixture clustering approach that uses an extremal
optimization algorithm to maximize the silhouette coefficient. The mean and covariance matrix of each com-
ponent are evolved to maximize each cluster’s priors. Numerical experiments compare the performance of the
expectation-maximization algorithm with the new approach on a set of synthetic and real-world data.
1 INTRODUCTION
Classical approaches for clustering and classification
(Zaki and Meira, 2020; Poggio and Smale, 2003)
can be further exploited by considering different
paradigms in the estimation of their parameters. The
Gaussian mixture model (GM) is one of the many
machine learning methods that estimate parameters
to maximize the corresponding log-likelihood func-
tion. However, it is not necessarily true that param-
eters that maximize the log-likelihood function also
offer the best clustering of data. Moreover, the max-
imization problem may have multiple solutions with
varying qualities from the clustering point of view.
The Gaussian mixture model is very popular in ap-
plications due to its robustness. Examples are mul-
tiple: in image analysis (Guo et al., 2022), sensor
fault diagnosis (Zhang et al., 2022a), driving fatigue
detection (Ansari et al., 2022; Zhang et al., 2022b),
environment (Kwon et al., 2022; Malinowski and
Povinelli, 2022), health (He and Guo, 2022), etc.
The silhouette score (SC) is an internal quality
measure for clusters that is often used to evaluate the
performance of algorithms’ output. It is based on the
mean intra-cluster distance and the mean nearest clus-
ter distance. A higher value indicates a better clus-
tering separation. Applications on specific datasets
report silhouette scores of GMM results better than
those provided by other methods. For example, vari-
ous clustering methods are explored to identify abnor-
a
https://orcid.org/0000-0002-5572-8141
mal behavior detection in smart homes (Bala Suresh
and Nalinadevi, 2022). GMM results outperform K-
means’ for an aircraft trajectory recognition applica-
tion (Kamsing et al., 2020). HPC computing (Bang
et al., 2020), customer churn (Vakeel et al., 2022),
analysis of background noise in offices (De Salvio
et al., 2021), and for a image recommender system
for e-commerce (Addagarla and Amalanathan, 2020),
are examples of applications in which GMM has been
used and evaluated based on the SC.
GMM has also been used on COVID-19 data
(Greenwood et al., 2022; Wisesty and Mengko, 2021)
with silhouette score as performance indicator. GMM
models have reported best silhouette scores for med-
ical document clustering (Davagdorj et al., 2022) on
processed data extracted from PubMed. Other med-
ical applications in which GMM results are evalu-
ated based on the SC include: manual muscle testing
grades (Saranya et al., 2020), insula functional par-
cellation (Zhao et al., 2017), where it is used with
an immune clonal selection algorithm, clustering of
hand grasps in spinal cord injury (Dousty and Zariffa,
2020), etc.
In this paper, an attempt to estimate parame-
ters for the Gaussian mixture model by maximizing
the silhouette coefficient is proposed. The under-
lying clustering model is Gaussian mixture, which
consists in providing means and covariance matrices
for multivariate normal distributions corresponding to
each cluster in the data. The expectation maximiza-
tion (EM) algorithm is known to maximize the log-
likelihood function. Instead of using EM, an extremal
Lung, R.
An Extremal Optimization Algorithm for Improving Gaussian Mixture Search.
DOI: 10.5220/0011528000003332
In Proceedings of the 14th International Joint Conference on Computational Intelligence (IJCCI 2022), pages 91-96
ISBN: 978-989-758-611-8; ISSN: 2184-3236
Copyright © 2023 by SCITEPRESS – Science and Technology Publications, Lda. Under CC license (CC BY-NC-ND 4.0)
91

optimization (EO) algorithm searches for parameters
that maximize the SC by randomly modifying the
clusters with the lowest prior probabilities.
2 GAUSSIAN MIXTURE MODEL
Consider the following clustering problem: let D be
a data set containing instances from R
nxd
. Each at-
tribute can be considered as an instance of a random
variable X
a
, a = 1, . . . , d and X = (X
1
, . . . , X
d
) denotes
the vector of random variables, with x
j
∈ X an in-
stance or data sample from X.
The Gaussian mixture model assumes that each
cluster C
i
in the data can be described by using a mul-
tivariate normal distribution with probability density
function f (x|µ
i
, Σ
i
), where the mean µ
i
and Σ
i
are un-
known parameters (Zaki and Meira, 2020). Then the
probability density function for the entire data X is:
f (x) =
k
∑
i=1
f (x|µ
i
, Σ
i
)P(C
i
) (1)
where k is the number of clusters, and P(C
i
) are the
prior probabilities or mixture parameters.
The Gaussian mixture model estimates the mean,
covariance matrix, and prior probabilities for the k
clusters by maximizing the log-likelihood function
P(D|θ) where
θ = {µ
1
, Σ
1
, P(C
1
), . . . ,µ
k
, Σ
k
, P(C
k
)} (2)
with
∑
k
i=1
P(C
i
) = 1 and
P(D|θ) =
n
∏
j=1
f (x
j
). (3)
The log-likelihood function
lnP(D|θ) =
n
∑
j=1
ln
k
∑
i=1
f (x
j
|µ
i
, Σ
i
)P(C
i
)
!
(4)
Parameter θ
∗
= argmax
θ
lnP(D|θ) it is supposed
to best describe clusters in the data, assuming that
maximizing the sum of ln f (x
j
) yields the best trade-
off among individual f
j
function values. As the log-
likelihood function in eq. (4) is difficult to maximize,
approximating θ
∗
is usually performed by using the
expectation maximization (EM) approach. EM com-
putes the posterior probabilities P(C
i
|x
j
) of C
i
given
x
j
as:
P(C
i
|x
j
) =
f
i
(x
j
)P(C
i
)
∑
k
a=1
f
a
(x
j
)P(C
a
)
. (5)
P(C
i
|x
j
) is denoted by w
i j
and is considered the
weight, or contribution of point x
j
to cluster C
i
.
The EM algorithm has three steps: initialization,
expectation, and maximization steps.
In the initialization step, the means µ
i
for each
cluster C
i
are randomly initialized by using a uni-
form distribution over each dimension X
a
. Covariance
matrices are initialized with the identity matrix, and
P(C
i
) =
1
k
.
In the expectation step posterior probabilities
/weights w
i j
= P(C
i
|x
j
) are computed using eq. (5).
In the maximization step, model parameters µ
i
, Σ
i
,
P(C
i
) are re-estimated by using posterior probabilities
(w
i j
) as weights.
Thus, the mean µ
i
for cluster C
i
is estimated as:
µ
i
=
∑
n
j=1
w
i j
x
j
∑
n
j=1
w
i j
. (6)
The covariance matrix Σ
i
for cluster C
i
is updated
using:
Σ
i
=
∑
n
j=1
w
i j
x
ji
x
T
ji
∑
n
j=1
w
i j
, (7)
where x
ji
= x
j
− µ
i
.
The prior probability for each cluster P(C
i
) is
computed as:
P(C
i
) =
∑
n
j=1
w
i j
n
(8)
The expectation and maximization steps are re-
peated until convergence, i.e. no more changes occur
in the values of cluster means. It is known that pa-
rameters computed by using EM are indeed maxima
of the log-likelihood function.
Predictions are made based on posterior probabil-
ities w
i j
.
3 EXTREMAL OPTIMIZATION
GAUSSIAN MIXTURE MODEL
Extremal optimization - EO (Boettcher and Percus,
2001) is a stochastic search method that evolves an in-
dividual by randomly replacing the fitness of its worst
component. EO has proven to be a powerful optimiza-
tion tool for many applications (Lu et al., 2018). It
is suitable for problems in which solutions are repre-
sented by components with different and comparable
fitness values. A global fitness is also used to evalu-
ate the overall quality of the individual. The general
outline of EO is presented in Algorithm 1.
ECTA 2022 - 14th International Conference on Evolutionary Computation Theory and Applications
92

Algorithm 1: Outline of general EO.
1: Input: Search domain D, objective function f ,
component fitness functions f
i
, i = 1, . . . , k;
2: Randomly generate potential solution s;
3: Set s
best
= s;
4: for a number of iterations do
5: evaluate f
i
(s), i = 1, . . . , k;
6: find component s
i
with the worst fitness;
7: replace s
i
with a random value;
8: if f (s) > f (s
best
) then
9: Set s
best
= s;
10: end if
11: end for
12: Output: s
best
.
In order to use EO, one needs to define the search
domain, the objective function f , and the compo-
nent’s fitness functions f
i
. Within the EO-GM - the
Extremal Optimization Gaussian mixture approach
presented in this paper, the EO is used to search for
the position of the clusters’ means and covariance ma-
trices. An individual is thus defined as
s = {µ
1
, Σ
1
, . . . , µ
k
, Σ
k
},
with µ
i
∈ R
d
and Σ
i
∈ R
d×d
. Matrices Σ
i
have to be
covariance matrices, so they need to be symmetric and
positive semi-definite. Each mean and covariance ma-
trix µ
i
and Σ
i
characterize a component C
i
, i = 1 . . . , k,
so we can also write
s = (C
1
, . . . ,C
k
).
The fitness of each component
f
i
(C
i
) = P(C
i
)
is the prior probability of cluster C
i
, computed using
Eq. (8). Thus, in each EO iteration, the cluster having
the smallest prior probability is randomly altered in
search for a new mean and covariance matrix.
The objective function to be maximized consid-
ered in this approach is the silhouette coefficient SC
(Zaki and Meira, 2020). SC is based on the differ-
ence between the average distance to the points in the
closest cluster and to the points in the same cluster.
For each point x
i
the silhouette coefficient sc
i
based on configuration s = (C
1
, . . . ,C
k
) is computed
as:
sc
i
=
ν
min
out
(x
i
) − ν
in
(x
i
)
max{ν
min
out
(x
i
), ν
in
(x
i
)}
, (9)
where ν
min
out
is the mean distance from x
i
to all points
in the closest cluster:
ν
min
out
= min
j̸= ˆy
i
∑
x∈C
j
||x
i
− x||
n
j
(10)
and n
j
is the size of cluster C
j
. Also, ν
in
(x
i
) is the
mean distance from x
i
to points in its own cluster ˆy
i
:
ν
in
(x
i
) =
∑
x∈C
ˆy
i
,x̸=x
i
||x
i
− x||
n
ˆy
i
− 1
. (11)
The value of sc
i
ranges between -1 and 1, a value
closer to 1 indicates that x
i
is much closer to points in
its own cluster than to points in the next closest one. A
value close to 0 indicates that x
i
may lay somewhere
at the boundaries of two clusters. A value closer to -1
indicates that x
i
is closer to another cluster, so it may
be miss-clustered.
The silhouette coefficient SC is computed as the
average of sc
i
across all points:
SC(s) =
1
n
n
∑
i=1
sc
i
(12)
Within the EO-GM algorithm, the SC is used to
evaluate the overall quality of a solution when com-
paring the current individual s with s
best
. If the current
solution is better than the best-known one, it will re-
place it. Otherwise, the search will continue to the
next iteration. Thus, in line 8 of Algorithm 1 the sil-
houette coefficient is used to compare the two indi-
viduals.
One of the motivations behind this approach is to
show that results provided by classical clustering al-
gorithms, such as Gaussian mixture, may be improved
while maintaining the underlying method. In the case
of Gaussian mixture, by using EO, we may find mean
values and covariance matrices that better describe
clusters - with respect to an internal fitness measure
such as the silhouette coefficient.
Thus, instead of the random initialization of EO
(line 2, Algorithm 1), the means and covariance matri-
ces determined by expectation maximization are used
to initialize solution s.
EO-GM (Algorithm 2 maximizes the silhouette
coefficient by attempting to increase the prior prob-
abilities of each cluster. The EO algorithm requires
a termination condition. In this approach, the maxi-
mum number of iterations of EO-GM is set to 100×d.
GM-EO does not need any other parameter settings.
4 NUMERICAL EXPERIMENTS
Numerical experiments are performed on a set of syn-
thetic benchmarks and real-world data to illustrate the
potential of the approach.
Data. The synthetic data-sets are generated by us-
ing the make classification function from the
An Extremal Optimization Algorithm for Improving Gaussian Mixture Search
93

Algorithm 2: Outline of EO-GM.
1: Input: Data set X ⊂ R
n×d
; number of clusters k;
2: Compute initial solution s = {µ
1
, Σ
1
, . . . , µ
k
, Σ
k
}
using expectation maximization;
3: Set s
best
= s;
4: for a number of iterations do
5: evaluate P(C
i
), i = 1, . . . , k;
6: find component s
i
with smallest P(C
i
) ;
7: replace s
i
with a random value:
8: alter the mean µ
i
by adding a random multi-
variate normal value (with mean 0 and standard
deviation 0.1);
9: alter Σ
i
by adding a randomly generated pos-
itive semi-definite matrix with the same dimen-
sions;
10: if SC(s) > SC(s
best
) then
11: Set s
best
= s;
12: end if
13: end for
14: Output: s
best
.
Figure 1: Example of two synthetic data sets generated with
class separator values of 2 (left) and 0.5 (right).
sklearn package in Python (Pedregosa et al., 2011).
The make classification function allows the gen-
eration of clustering and classification data-sets with
different number of instances, attributes, classes and
different levels of difficulty (controlled by a class sep-
arator parameter). The parameters used to generate
the synthetic data sets are:
• Number of instances: 100, 200, 300, 400, and
500;
• Number of classes and attributes: 3, 5,7,9;
• Class separator: 0.5 and 2; clusters generated us-
ing the value 2 are clearly separated, while clus-
ters generated with the value 0.5 are highly over-
lapping. Figure 1 illustrates the differences be-
tween clusters for a data-set with 500 instances
and 2 attributes.
The real data sets used are taken from the UCI
Machine Learning repository (Dua and Graff, 2017).
Table 1 presents their main characteristics.
Table 1: Real data-sets used for numerical experiments and
their main attributes.
No No No
Data-set instances attributes clusters
Cryoptherapy 90 6 2
Dresses 500 12 2
cezariene 80 5 2
Cervical 72 19 2
Immunotherapy 90 7 2
Banknote 1372 4 2
Plrx 182 12 2
Transfusions 748 4 2
Diabetes 768 8 2
Forest 243 12 2
Iris 150 4 3
Wine 178 13 3
Performance Evaluation. For each data-set, 10 in-
dependent runs are performed, and the silhouette co-
efficient for the initial solution - the one provided by
the gaussian mixture expectation maximization algo-
rithm - is compared with the silhouette coefficient of
the solution provided by EO-GM. For each data set,
the ten values are compared by using a paired t-test,
testing the null hypothesis that EO-GM average re-
sults are less than or equal to that of the GM model.
The null hypothesis is rejected if the p-value is less
than 0.05. As an external indicator, the normalized
mutual information (NMI) is computed, and statisti-
cal significance tests are performed in a similar man-
ner. The NMI indicator compares the reported clus-
ters with the real partitions; a greater value indicates
a better clustering.
Results. Table 2 presents results of the t-test com-
paring the SC scores reported by GM and EO-GM.
We find that in all tested instances the results reported
by EO-GM are significantly better as far as the SC
score is concerned. Regarding the NMI score, only in
one instance the NMI values reported by EO-GM are
significantly better than those reported by GM.
Figure 2 presents box-plots of NMI values for
each real-world data-set and Table 3 corresponding
p-values. For three of the data sets, increasing the
SC indicator also led to better NMI values. Only for
one data-set (forest), EO-GM did not find a better SC
value.
5 CONCLUSIONS
Gaussian mixture models describe clusters in data by
using multivariate normal distributions. In this paper
these parameters are estimated by using an extremal
ECTA 2022 - 14th International Conference on Evolutionary Computation Theory and Applications
94
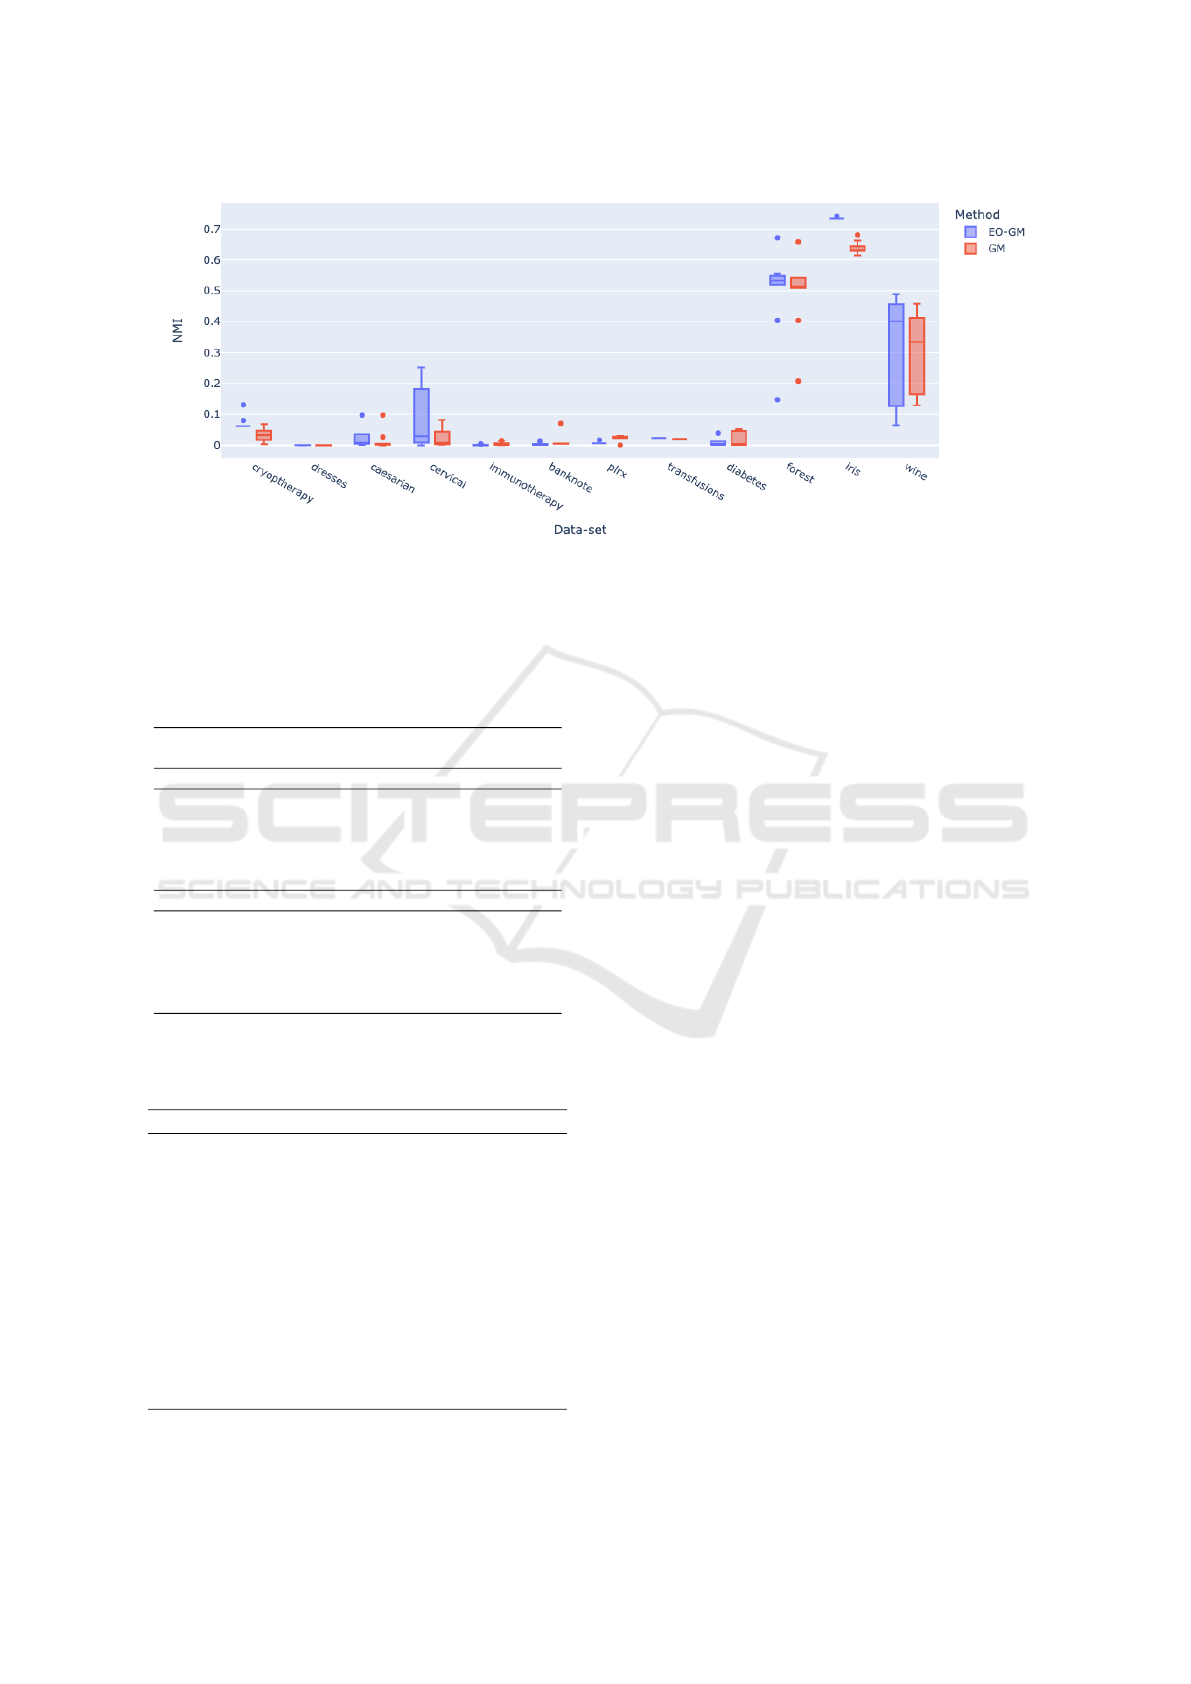
Figure 2: NMI values reported by the two methods on the real data-sets.
Table 2: Synthetic data-sets. p-values of the t-test compar-
ing the SC score between GM and EO-GM. A value lower
than 0.05 indicates that EO-GM scores are higher. A *
indicates that there is significant difference between corre-
sponding NMI values. A
−
sign indicates that NMI values
reported by GM are significantly better.
No Number of attributes
Inst. 3 5 7 9
class separator 2
100 0.01521 0.00153 0.00408* 0.00066
200 0.05781 0.00077 0.00863 0.01105
300 0.00190 0.01035 0.00155 0.00608
400 0.00055 0.07050 0.01238 0.00176
500 0.00857 0.00145 0.00172
−
0.0000
class separator 0.5
100 0.00579 0.01269 0.00700 0.00343
200 0.00066 0.00002 0.00038 0.00121
300 0.00020
−
0.00060 0.00144
−
0.00456
400 0.00706
−
0.00000 0.00033 0.00002
500 0.00216 0.00020 0.00000
−
0.00035
Table 3: T-Test results for real-world data-sets comparing
NMI and SC values.
Data-set p-value (NMI) p-value (SC)
cryoptherapy 2.5133e-04 1.7874e-07
dresses 7.3222e-02 1.3253e-07
cezariene 7.3215e-02 3.9972e-02
cervical 2.3410e-02 1.1954e-04
immunotherapy 9.7516e-01 4.8135e-03
banknote 8.4498e-01 4.0949e-02
plrx 9.9905e-01 1.6340e-04
transfusions 0.000e+00 0.000e+00
diabetes 9.6145e-01 3.7300e-02
forest 3.6748e-01 6.2947e-02
iris 3.0751e-08 1.2630e-06
wine 2.5037e-01 8.2896e-04
optimization algorithm maximizing the silhouette co-
efficient measure. Parameters that describe better the
clusters are computed by evolving an individual en-
coding them directly. The component with the low-
est prior probability is randomly replaced each iter-
ation. Numerical experiments indicate that such an
approach has the potential to better reveal intercon-
nections within data, while using the same model to
describe the clusters.
ACKNOWLEDGEMENTS
This work was supported by a grant of the Romanian
Ministry of Education and Research, CNCS - UEFIS-
CDI, project number PN-III-P4-ID-PCE-2020-2360,
within PNCDI III.
REFERENCES
Addagarla, S. and Amalanathan, A. (2020). Probabilistic
unsupervised machine learning approach for a similar
image recommender system for E-commerce. Symme-
try, 12(11):1–17.
Ansari, S., Du, H., Naghdy, F., and Stirling, D. (2022). Au-
tomatic driver cognitive fatigue detection based on up-
per body posture variations. Expert Systems with Ap-
plications, 203. cited By 0.
Bala Suresh, P. and Nalinadevi, K. (2022). Abnormal Be-
haviour Detection in Smart Home Environments, vol-
ume 96 of Lecture Notes on Data Engineering and
Communications Technologies. Pages: 300.
Bang, J., Kim, C., Wu, K., Sim, A., Byna, S., Kim, S.,
and Eom, H. (2020). HPC Workload Characterization
Using Feature Selection and Clustering. pages 33–40.
Boettcher, S. and Percus, A. G. (2001). Optimization with
extremal dynamics. Phys. Rev. Lett., 86:5211–5214.
An Extremal Optimization Algorithm for Improving Gaussian Mixture Search
95

Davagdorj, K., Wang, L., Li, M., Pham, V.-H., Ryu, K.,
and Theera-Umpon, N. (2022). Discovering Themati-
cally Coherent Biomedical Documents Using Contex-
tualized Bidirectional Encoder Representations from
Transformers-Based Clustering. International Jour-
nal of Environmental Research and Public Health,
19(10).
De Salvio, D., D’Orazio, D., and Garai, M. (2021). Unsu-
pervised analysis of background noise sources in ac-
tive offices. Journal of the Acoustical Society of Amer-
ica, 149(6):4049–4060.
Dousty, M. and Zariffa, J. (2020). Towards Clustering Hand
Grasps of Individuals with Spinal Cord Injury in Ego-
centric Video. volume 2020-July, pages 2151–2154.
Dua, D. and Graff, C. (2017). UCI machine learning repos-
itory.
Greenwood, D., Taverner, T., Adderley, N., Price, M.,
Gokhale, K., Sainsbury, C., Gallier, S., Welch, C.,
Sapey, E., Murray, D., Fanning, H., Ball, S., Ni-
rantharakumar, K., Croft, W., and Moss, P. (2022).
Machine learning of COVID-19 clinical data identi-
fies population structures with therapeutic potential.
iScience, 25(7).
Guo, J., Chen, H., Shen, Z., and Wang, Z. (2022). Im-
age denoising based on global image similar patches
searching and hosvd to patches tensor. Eurasip Jour-
nal on Advances in Signal Processing, 2022(1). cited
By 0.
He, M. and Guo, W. (2022). An integrated approach
for bearing health indicator and stage division us-
ing improved gaussian mixture model and confidence
value. IEEE Transactions on Industrial Informatics,
18(8):5219–5230. cited By 0.
Kamsing, P., Torteeka, P., Yooyen, S., Yenpiem, S., Dela-
haye, D., Notry, P., Phisannupawong, T., and Chan-
numsin, S. (2020). Aircraft trajectory recognition via
statistical analysis clustering for Suvarnabhumi Inter-
national Airport. volume 2020, pages 290–297.
Kwon, S., Seo, I., Noh, H., and Kim, B. (2022). Hyperspec-
tral retrievals of suspended sediment using cluster-
based machine learning regression in shallow waters.
Science of the Total Environment, 833. cited By 0.
Lu, Y., Chen, Y., Chen, M., Chen, P., and Zeng, G. (2018).
Extremal Optimization: Fundamentals, Algorithms,
and Applications. CRC Press.
Malinowski, M. and Povinelli, R. (2022). Using smart me-
ters to learn water customer behavior. IEEE Trans-
actions on Engineering Management, 69(3):729–741.
cited By 0.
Pedregosa, F., Varoquaux, G., Gramfort, A., Michel, V.,
Thirion, B., Grisel, O., Blondel, M., Prettenhofer,
P., Weiss, R., Dubourg, V., Vanderplas, J., Passos,
A., Cournapeau, D., Brucher, M., Perrot, M., and
Duchesnay, E. (2011). Scikit-learn: Machine learning
in Python. Journal of Machine Learning Research,
12:2825–2830.
Poggio, T. and Smale, S. (2003). The mathematics of learn-
ing: Dealing with data. Notices of the American Math-
ematical Society, 50:2003.
Saranya, S., Poonguzhali, S., and Karunakaran, S. (2020).
Gaussian mixture model based clustering of Man-
ual muscle testing grades using surface Electromyo-
gram signals. Physical and Engineering Sciences in
Medicine, 43(3):837–847.
Vakeel, A., Vantari, N., Reddy, S., Muthyapu, R., and Cha-
van, A. (2022). Machine Learning Models for Predict-
ing and Clustering Customer Churn Based on Boost-
ing Algorithms and Gaussian Mixture Model.
Wisesty, U. and Mengko, T. (2021). Comparison of dimen-
sionality reduction and clustering methods for sars-
cov-2 genome. Bulletin of Electrical Engineering and
Informatics, 10(4):2170–2180.
Zaki, M. J. and Meira, Jr, W. (2020). Data Mining and
Machine Learning: Fundamental Concepts and Algo-
rithms. Cambridge University Press, 2 edition.
Zhang, B., Yan, X., Liu, G., and Fan, K. (2022a). Multi-
source fault diagnosis of chiller plant sensors based on
an improved ensemble empirical mode decomposition
gaussian mixture model. Energy Reports, 8:2831–
2842. cited By 0.
Zhang, J., Lu, H., and Sun, J. (2022b). Improved driver
clustering framework by considering the variability of
driving behaviors across traffic operation conditions.
Journal of Transportation Engineering Part A: Sys-
tems, 148(7). cited By 0.
Zhao, X.-W., Ji, J.-Z., and Yao, Y. (2017). Insula
functional parcellation by searching Gaussian mix-
ture model (GMM) using immune clonal selection
(ICS) algorithm. Zhejiang Daxue Xuebao (Gongxue
Ban)/Journal of Zhejiang University (Engineering
Science), 51(12):2320–2331.
ECTA 2022 - 14th International Conference on Evolutionary Computation Theory and Applications
96
