Parameterising the SA-UNet using a Genetic Algorithm
Mahsa Mahdinejad
1 a
, Aidan Murphy
2 b
, Patrick Healy
1 c
and Conor Ryan
1 d
1
Univercity of Limerick, Limerick, Ireland
2
University Colledge Dublin, Dublin, Ireland
Keywords:
Deep Learning, Evolutionary Algorithm, Image Segmentation.
Abstract:
Deep learning is an excellent way for effectively addressing image processing, and several Neural Networks
designs have been explored in this area. The Spatial Attention U-Net architecture, a version of the famous
U-Net but which uses DropBlock and an attention block as well as the common U-Net convolutional blocks,
is one notable example. Finding the best combination of hyper-parameters is expensive, time consuming and
needs expert input. We show the genetic algorithm can be utilized to automatically determine the optimal
combination of Spatial Attention U-Net hyper-parameters to train a model to solve a Retinal Blood Vessel
Segmentation problem. Our new approach is able to find a model with an accuracy measure of 0.9855, an
improvement from our previous experimentation which found a model with accuracy measure of 0.9751. Our
new methods exhibit competitive performance with other state-of-the-art Retinal Blood Vessel Segmentation
techniques.
1 INTRODUCTION
Diabetes is a severe and common disease that, if left
untreated, may result in death (Ogurtsova et al., 2017)
or vision loss (Ciulla et al., 2003). Diabetic Retinopa-
thy (DR), a type of blindness caused by diabetes, is
caused by damage and accumulation of blood vessels
in the eye. Specifically, the production of hard exu-
dates around the fovea is one of the major causes of
blindness. However, early detection and laser photo-
coagulation may help to limit the progression of DR
in the retina.
As DR is not evident until after a diabetes di-
agnosis, early identification of DR involves profes-
sional, manual evaluation of retinal images. Spe-
cialists are increasingly using image processing and
machine learning approaches to help them investi-
gate retinal problems and diagnose DR (Winder et al.,
2009). The process of extracting blood vessels from
retinal images using these methodologies is known as
the Retinal Blood Vessel Segmentation task.
To solve the challenge of identifying blood vessels
in images of eyes, state-of-the-art Neural Networks
(NNs) techniques are used. The Convolutional NN
a
https://orcid.org/0000-0003-4288-3991
b
https://orcid.org/0000-0002-6209-4642
c
https://orcid.org/0000-0002-3824-7442
d
https://orcid.org/0000-0002-7002-5815
(CNN) (LeCun et al., 1995), is an improved version
of the traditional NN that has become the “go to” ap-
proach when dealing with image segmentation prob-
lems. The availability of powerful supercomputers to
train larger and more complex CNNs has led to their
success in an increasingly wider range of image pro-
cessing tasks. This success has come at the expense of
complexity, however, with many popular CNN archi-
tectures taking hundreds (possibly thousands) of GPU
hours to successfully train. As a consequence, de-
signing and experimenting with a CNN architecture
and selecting the appropriate hyper-parameters for a
given task is becoming more and more difficult.
In this paper, we use an evolutionary approach to
automatically search for both suitable CNN architec-
ture and parameters. Specifically, we use a genetic
algorithm (GA) (Holland, 1975), to create a CNN
which can accurately solve a retinal blood vessel seg-
mentation problem.
We use a state-of-the-art CNN, the SA-UNet (Spa-
cial Attention U-Net), as a baseline for the search
space. Similar to our previous work (Popat et al.,
2020; Houreh et al., 2021), we allow the GA to select
the SA-UNet hyper-parameters during the evolution-
ary process. The SA-UNet has been shown to out-
perform the U-Net, which was used in previous ex-
perimentation. Including an attention block increases
the SA-UNet representation capabilities, allowing it
Mahdinejad, M., Murphy, A., Healy, P. and Ryan, C.
Parameterising the SA-UNet using a Genetic Algorithm.
DOI: 10.5220/0011528100003332
In Proceedings of the 14th International Joint Conference on Computational Intelligence (IJCCI 2022), pages 97-104
ISBN: 978-989-758-611-8; ISSN: 2184-3236
Copyright © 2023 by SCITEPRESS – Science and Technology Publications, Lda. Under CC license (CC BY-NC-ND 4.0)
97

to focus on relevant elements in the image while sup-
pressing unneeded ones. That is to say, the SA-UNet
removes noise and irrelevant background units of the
images.
We explain the background of our methods in sec-
tion 2. The experimental setup is described and dis-
cussed in detail in section 3 and the results are then
presented in section 4. Finally, our conclusions and
future work are presented in section 5.
2 BACKGROUND
2.1 Image Segmentation
Image segmentation is an important area of research
in computer vision and machine learning. Au-
tonomous driving, urban navigation and medical im-
age processing all require precise, reliable and effec-
tive segmentation algorithms.
Medical image segmentation is a key aspect in
many current clinical procedures. It is used for a
variety of purposes, including diagnostics, treatment
planning and treatment administration. Professional
therapists usually undertake these visual analyses. As
a result, developing robust and dependable image seg-
mentation algorithms is an essential requirement in
medical image analysis. Image segmentation is the
process of breaking down a digital image into sev-
eral subgroups, reducing the complexity of the image
and making further processing or analysis of the im-
age easier. Other important picture tasks include im-
age level classification and detection. Classification
involves treating each image as though it belonged to
the same category. The process of identifying and rec-
ognizing items is known as detection.
2.2 Convolutional Neural Networks
Deep learning (DL) is a subset of machine learning
that deals with artificial neural networks (ANNs) in
general, especially those with numerous complex lay-
ers. Over the last decade, CNNs have achieved break-
throughs in a range of pattern recognition domains,
extending from image processing to speech recogni-
tion. The most advantageous feature of CNNs is that
they reduce the number of parameters in ANN. This
accomplishment has motivated both researchers and
developers to consider larger and larger models in or-
der to perform challenging tasks that were previously
impossible to solve with traditional ANNs. The most
significant assumption about issues solved by CNN is
that they should not contain spatially dependent prop-
erties. It is only required that objects are detected, re-
gardless of where they appear in the images. Another
essential property of CNN is the ability to extract ab-
stract features as input propagates deeper levels.
2.3 The U-Net & SA-UNet
The current state-of-the-art techniques used to ad-
dress the blood vessel segmentation challenge are all
NN-based approaches. One of the many NN designs
proposed by researchers is the U-net (Ronneberger
et al., 2015), a variation of a fully CNN that, accord-
ing to the authors, can give reasonable prediction with
a small training dataset.
The U-net architecture is a U shape encoder-
decoder with skip connections between them. The en-
coder takes the input characteristics and reduces their
dimension, while the decoder takes the encoder’s fea-
tures and provides the best match to the actual input
or planned output.
The U-net is divided into two sections, the con-
tracting path and the expanding path, which are po-
sitioned on the left and right sides, respectively. The
contracting path is used for down sampling, whereas
the expanding path is used for up sampling.
The main advantage of this design is its capacity
to take a broader context into account while producing
a prediction from the real image pixel by pixel, which
is especially useful for retinal blood vessel segmenta-
tion.
Previously we aimed to optimise the U-Net, ob-
taining a smaller model than the base U-Net (Houreh
et al., 2021; Popat et al., 2020). This reduces the cost
and time to train the model and makes it more suit-
able to run on small or embedded devices. There was,
however, a trade-off in accuracy with this more com-
pact model. As newer state-of-the-art models have
increased the performance on benchmarks higher and
higher, this trade-off can no longer be justified as the
gap in precision between the models grows larger and
larger.
Several U-Net modifications have been proposed
to increase the network’s performance. Some work
has modified the architecture of the U-Net, such as the
Dual Encoding U-Net (DEU-Net) (Wang et al., 2019).
This is a modification of the U-Net with a novel ar-
chitecture, using two encoders and attention blocks.
Another example is the U-Net++ (Zhou et al., 2018),
which aims to reduce the feature maps gap between
the encoder and decoder.
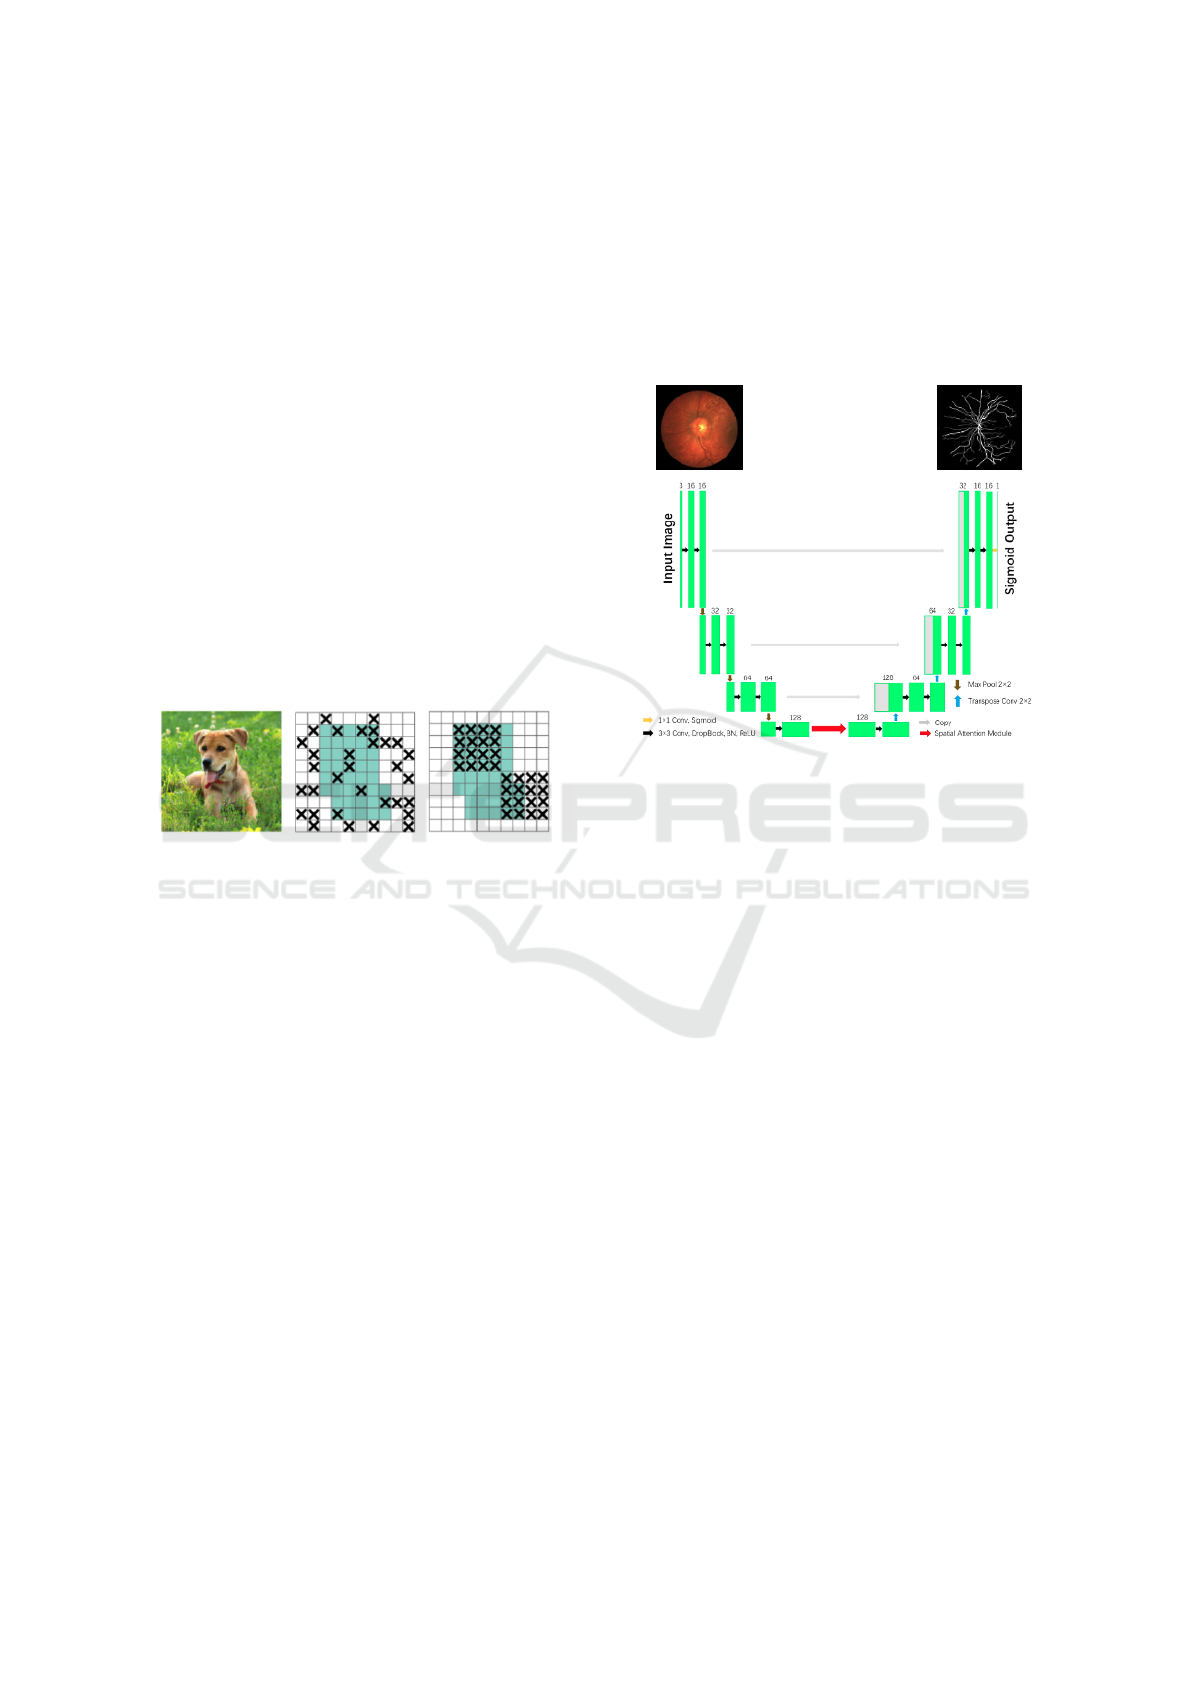
One of the more notable models is the spatial at-
tention U-Net (SA-UNet) (Guo et al., 2021). The SA-
UNet has two major differences compared to the U-
Net. Firstly, it uses spatial attention (Woo et al., 2018)
at the bottom of the U-Net, shown in Fig. 2 and, sec-
ECTA 2022 - 14th International Conference on Evolutionary Computation Theory and Applications
98
ondly, to mitigate overfitting, it uses DropBlock (Ghi-
asi et al., 2018) instead of Dropout (see below for a
description of both DropBlock and Dropout). The
SA-UNet has shown improved performance over the
base U-Net, improving the AUC (see Section 3.5) on
the DRIVE dataset from 0.9755 to 0.9864.
The SA-UNet is adopted as the base model in our
study.
Supervised machine learning projects often must
deal with training sets of small size. This can be due
to the lack of available data, the expense associated
with collecting it or many other reasons. Most CNN
models require vast amounts of data to learn correctly
and are prone to overfit (Dietterich, 1995) and per-
form poorly when trained on restricted datasets.
Dropout (Baldi and Sadowski, 2013) is a regular-
ization algorithm in which certain layer’s outputs are
ignored or ”dropped out” stochastically during train-
ing. This approach shows that Dropout may break
apart situations in which network layers co-adapt to
correct mistakes made by previous layers, and mak-
ing the model more reliable.
Figure 1: An illustration comparing the approaches of
Dropout and DropBlock for ignoring units in an input im-
age (Ghiasi et al., 2018).
DropBlock is a robust CNN regularization
method, similar to Dropout, by setting the input’s
units to 0, and guaranteeing that no units are reliant
on each other during training time. It differs from
Dropout in that it eliminates continuous regions rather
than individual random units from a layer’s feature
map, shown in Fig. 1.
DropBlock has been shown to effectively avoid
network overfitting, allowing for the use of very small
sample datasets to effectively train CNNs. DropBlock
requires the user to specify the value of two parame-
ters, namely, block size, which determines the num-
ber of pixels in each block, and keep probability, the
chance of the block being shut down.
A major challenge in retinal segmentation is the
lack of contrast between the blood vessel area and the
background in the retinal fundus images. Much work
has been done to overcome this absence of distinction,
with attention shown to be among the most power-
ful techniques (Vaswani et al., 2017). The SA-UNet
utilises attention to help the network learn better by
converting a query and a collection of critical values
into output. Spatial attention helps the model to learn
structural information, which is essential for achiev-
ing state-of-the-art results, by emphasising important
units and reducing noises and influence of the back-
ground. In this process first max-pooling and average
pooling operations are applied along the channel axis,
then concatenates them to build an efficient feature
detector.
Figure 2: SA-UNet architecture (Guo et al., 2021).
2.4 Evolutionary Algorithm
Evolutionary Algorithms (EAs) are population-based
optimization techniques, inspired by natural selec-
tion. The works of some of the early computer vi-
sionaries show signs of evolutionary discovery. Con-
cepts in Biological Computing, Biological Mathemat-
ics and Machine Learning, for example, were created
by Alan Turing (Turing, 1990) and John von Neu-
mann (Burks, 1986).
An EA experiment begins by creating a population
of different solutions and specifying a fitness func-
tion and then evolves them over many generations.
The stronger individuals will survive and be passed
down to future generations, while the weaker individ-
uals will die out. In our experiments, an individual is
a NN architecture and its associated parameters.
2.4.1 Genetic Algorithm
A Genetic Algorithm (GA) (Holland, 1975), a sub
field of EAs, takes its inspiration from genetics by
representing solutions as ‘genes’ and using biolog-
ically inspired operators to modify individuals to
drive the evolution. GAs are frequently used to
produce high-quality solutions to optimization and
search challenges.
Our experiments use a GA to tune the set of pa-
rameters of a segmentation method.
Parameterising the SA-UNet using a Genetic Algorithm
99
The GA process, described in 12, begins by cre-
ating a population of individuals. An individual, or
genotype, is a set of genes, each of which represents a
SA-UNet hyper-parameter. The hyper-parameters we
select for optimisation are: depth, number of filters,
kernel sizer, pooling type, activation and optimizer.
Each set of genes produces the genotype, with each
unique genotype representing a unique model.
Algorithm 1: Genetic Algorithm.
Input: G = [g
1
,g
2
,...,g
n
] // Genotype
Output: P = [p
1
, p
2
,..., p
n
] // Phenotype
1 I
i
← (G,P,S)
2 S = ∅
3 Q
t=0
← I
i
// Initial population
4 while t < m // m = max generations
5 do
6 Evaluate each phenotype P ∈ Q
t−1
7 S(I
i
) ← eval(P
i
) assign fitness score
8 Select parents from Q
t−1
using S
9 Genetic operations on G
i
of selected parents
10 Q
t
← (G,P) offspring (new pop)
11 t ← t +1
12 Return I
i
from Q
t
with the best S.
3 EXPERIMENTAL SETUP
3.1 Dataset
The DRIVE (Digital Retinal Images for Vessel Ex-
traction) database (Staal, 2018) was created to al-
low for comparative research on blood vessel seg-
mentation in retinal pictures for the diagnosis, screen-
ing, treatment and evaluation of various diseases such
as diabetes. The morphological attributes of reti-
nal blood vessels, such as length, width, texture and
branching patterns, are identified and used by the ex-
perts. Automatic identification and analysis of the
vasculature may help in DR detection methods, re-
search into the association between vascular deforma-
bility and hypertensive retinopathy, vessel diameter
measurement in relation to hypertension diagnosis
and computer-assisted laser surgery. Furthermore, the
retinal vascular branch has been shown to be unique
to each person and may be utilized for biometric iden-
tification.
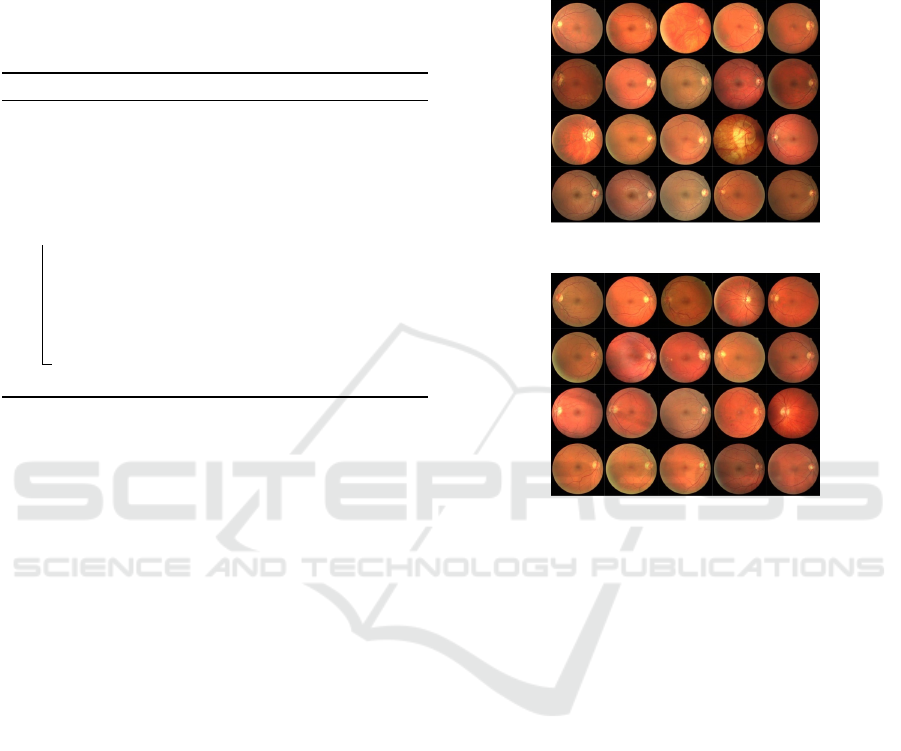
The 40 images were separated into two sets, each
with 20 images. A training set, Fig. 3, and a test set,
Fig. 4. The training set is further separated into a
validation set and a training set. A single manual seg-
mentation of the vasculature is provided for the train-
ing images. Two manual segmentations are provided
for the test cases. One works as a gold standard, while
the other may be used to compare computer-generated
segmentation to those of a human observer. In addi-
tion, for each retinal image, a mask image represent-
ing the area of interest is supplied. An expert ophthal-
mologist guided and trained all human observers who
manually segmented the vasculature.
Figure 3: DRIVE training images.
Figure 4: DRIVE testing images.
3.2 GA Parameters
Each experiment was run for 20 generations with a
population size of 15. This was repeated a total of
10 times. Each run used random initialisation to
create the initial population and employed one-point
crossover and bit-flip mutation. Tournament selection
and generational replacement were also utilised.
Each individual was trained for 10 epochs, with
a batch size of 2, during the evolutionary run. At
the end of each run, the best performing model was
trained for a further 150 epochs.
The evolutionary parameters are summarised in
Table 1.
The fitness function used was validation accuracy.
Validation accuracy helps prevent over fitting, a key
concern given our small training dataset.
3.3 Genome
Our solutions are represented as genomes which are
then translated into a CNN architecture. Table 2 de-
scribes how each genome is constructed, with differ-
ent genes representing different hyper-parameters of
the SA-UNet. The number of bits for each hyper-
ECTA 2022 - 14th International Conference on Evolutionary Computation Theory and Applications
100
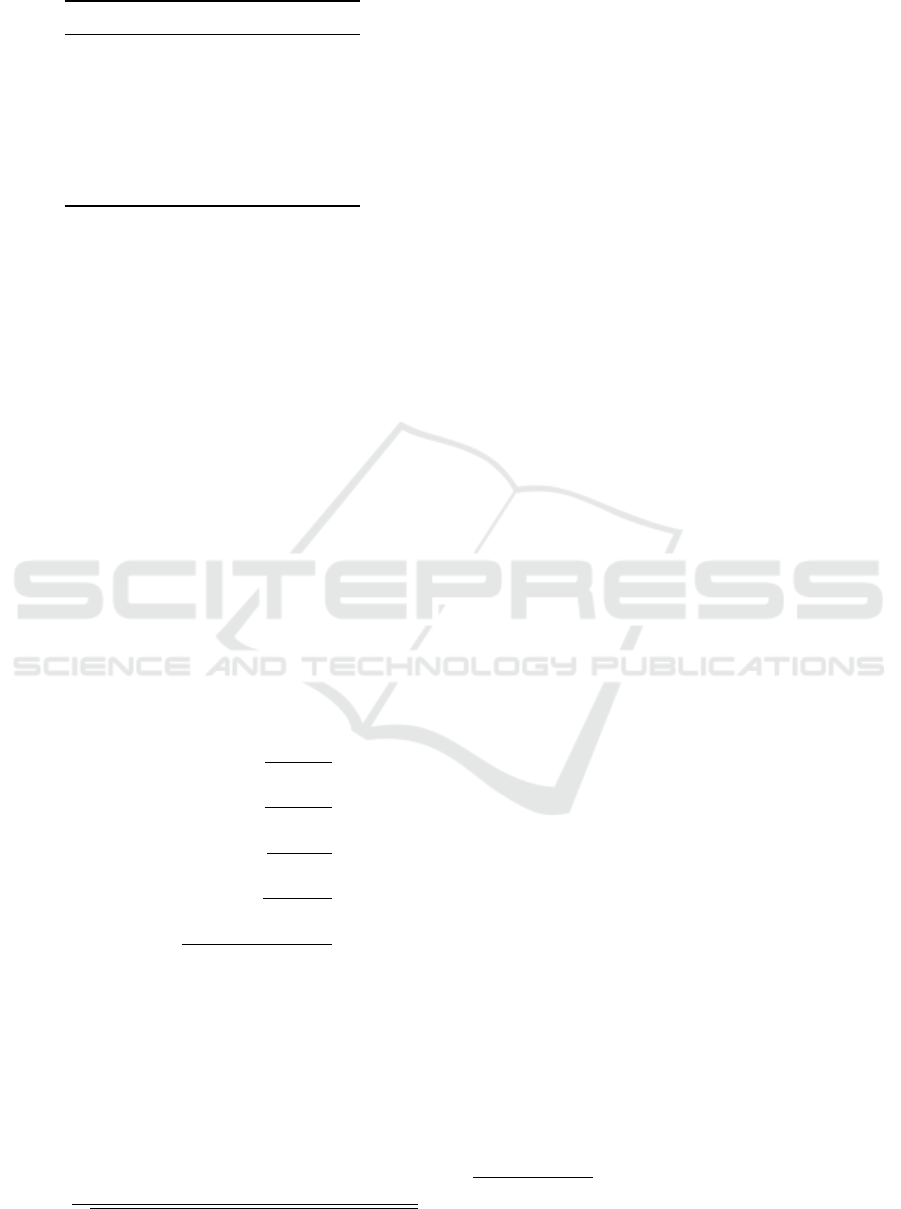
Table 1: List of the parameters used to run GA.
Parameter Value
Runs 10
Total Generations 20
Population Size 15
Crossover Rate 0.9
Mutation Rate 0.5
Epochs 10 (Training)
Epochs 150 (Best)
parameter depends on the number of choices avail-
able.
3.4 Hardware & Software
The experiments were run on a single machine with a
Nvidia Quadro RTX 8000 GPU. TensorFlow (Abadi
et al., 2016) was used to train the networks while the
GA framework used was DEAP (Fortin et al., 2012).
3.5 Evaluation Metrics
Each of test accuracy, sensitivity (the percentage of
true positives (TP) and which may also be considered
as the test’s sensitivity to noticing small changes),
specificity (the percentage of true negative (TN)),
Area Under the Curve (AUC), which refers to the re-
ceiver operating characteristic curve, a metric that as-
sesses how effectively predictions are scored, Positive
Predictive Value (PPV), Negative Predictive Value
(NPV) and F1 Score were used to evaluate our mod-
els.
Sensitivity =
T P
T P + FN
Speci f icity =
T N
T N + FP
PPV =
T P
T P + FP
NPV =
T N
T N + FN
F1Score =
T P
T P + 1/2(FP + FN)
In addition, we used Matthew’s Correlation Co-
efficient (MCC), a technique useful for quantifying
the difference between expected and actual values
(Chicco and Jurman, 2020), which was also used in
the original SA-UNet (Guo et al., 2021) model. MCC
is a trustworthy statistical rate that delivers a high
score only if the prediction performed well in all four
confusion matrix areas (TP, FN, TN, and FP)
MCC =
T P × T N −FP × FN
p
(T P + FP)(T P + FN)(T N + FN)(T N + FN)
4 RESULTS
The full results from all 10 experiments can be seen
in Table 4. The hyper-parameters which yielded the
best model from each run are shown in Table 5. Each
individual, trained for 10 epochs, took approximately
5-7 minutes to train resulting in each run taking ap-
proximately 36 hours to complete (20 population *
(15+1) generations). It took a further 1 hour to train
the best-of-run individual for a further 150 epochs.
The 10 runs resulted in a mean AUC score of
0.9784. Average model weight was 14.29 M, however
interestingly, the best performing model was also the
lightest model at 8.3M
The best performing model, found in experi-
ment 2, achieved an AUC of 0.9855. A comparison of
this performance with other techniques on the DRIVE
1
benchmark dataset is shown in Table 3. We can see
that our GA-based approach achieves close to state-
of-the-art performance, slightly lower than RV-GAN,
which achieves an AUC of 0.9887. It outperforms
both of the well-known IterNet and VGN networks,
as well as two versions of the U-Net.
Our approach lags slightly behind the SA-UNet,
which achieves an AUC of 0.9864. However, both
our approach and the SA-UNet yield similar MCC
scores, 0.8054 and 0.8097, respectively. It is notewor-
thy that our model displays reduced overfitting when
compared to the SA-UNet and original U-Net, shown
in Fig. 5.
Our experimentation produced results which ex-
ceeded our previous approaches, GA-based U-Net
(AUC 0.9751) and HNAS-based (AUC 0.9749), both
of which used the UNet as a base model. Indeed,
nearly all runs found models which achieved better
performance, with the best performing models from
the GA-based U-Net only outperforming 2 runs from
10 of our latest experiments.
The hyper-parameters chosen for each model are
described in Table 5.
7 of the 10 models have depth 2, with 2 having
depth 4. Strikingly, the only model to chose depth
3 was also the best performing model, experiment 2.
Six models had filter size of 32, three models had filter
size 16 and a single best of run model had a filter size
of 64. All but one model had a kernel type of (3,3) and
all but two had a RMSprop optimizer. Sigmoid was
the most popular activation function, appearing in six
models, followed by softplus in three and relu in one.
Pooling type was roughly split evenly, with average
pooling appearing in six models and max pooling in
four models.
1
https://paperswithcode.com/sota/retinal-vessel-
segmentation-on-drive
Parameterising the SA-UNet using a Genetic Algorithm
101
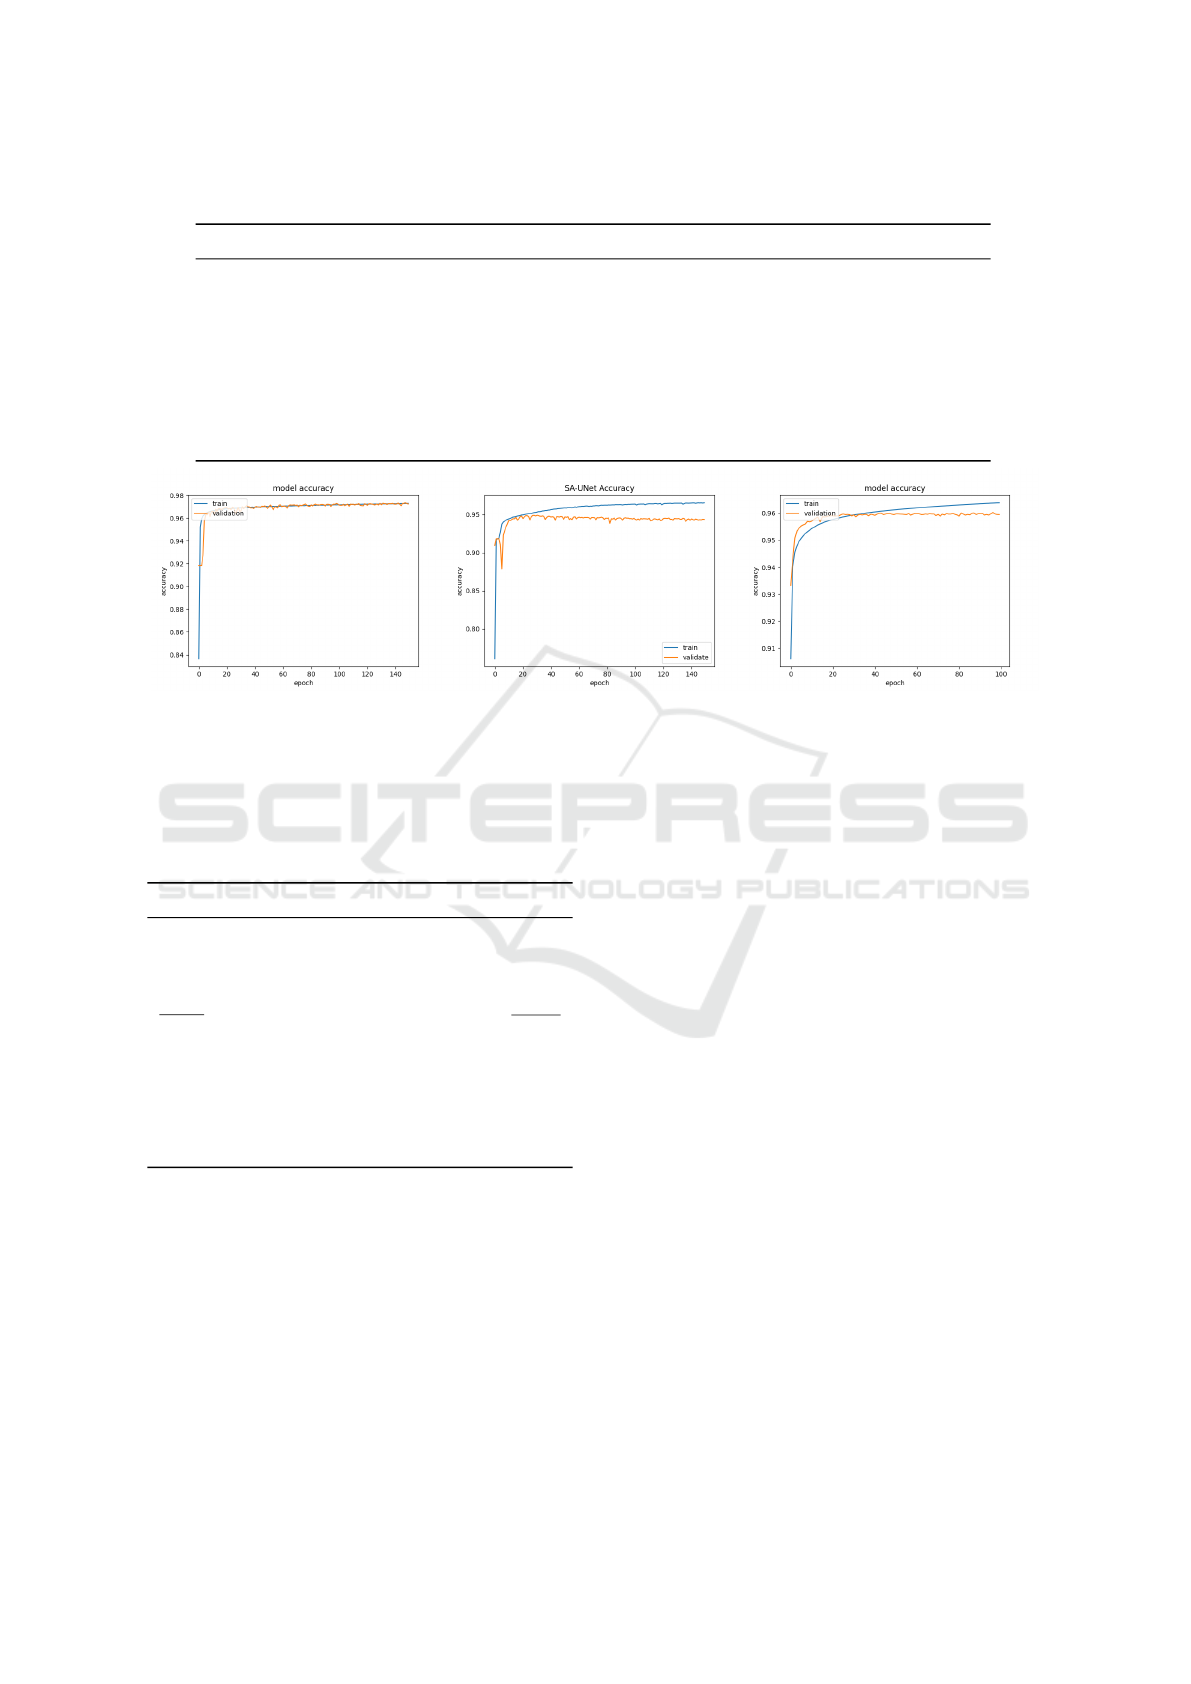
Table 2: Genotype representation of the hyper-parameters.
Parameter Gens Choices Bit-Size
Depth D { 1, 2, 3, 4 } 2
Filter Size F { 16, 32, 64, 128 } 2
Pooling Type T { MaxPooling, AveragePooling } 1
Kernel Type K { (3,3), (5,5), (7,7), (9,9) } 2
Optimizer O { sgd, adam, adamax, adagrad, Nadam, Ftrl, Adadelta, RMSprop } 3
Activation A { relu, sigmoid, softmax, softplus, softsign, tanh, selu, elu } 3
Keep Probability P { 0.8, 0.9 } 1
Block Size B { 7, 9 } 1
(a) Our best model. (b) SA-UNet. (c) U-Net.
Figure 5: Different model’s training and validation plots for 150 epochs.
Table 3: Comparison of the AUC-ROC performance the
best model found during our experimentation with other
stat-of-the-art models. Two last models, GA-based UNet
and HNAS-based, are our previous GA-based optimisation
results.
Method AUC ROC
RV-GAN(Kamran et al., 2021) 0.9887
Study Group Learning (Zhou et al., 2021) 0.9886
SA-UNet (Guo et al., 2021) 0.9864
EXP2 0.9855
U-Net (Uysal et al., 2021) 0.9855
IterNet (Li et al., 2020) 0.9816
VGN (Shin et al., 2019) 0.9802
U-Net (Ronneberger et al., 2015) 0.9755
GA-based U-Net (Popat et al., 2020) 0.9751
HNAS-based (Houreh et al., 2021) 0.9749
DropBlock’s hyper-parameters showed equal us-
age, with keep probability of 0.8 appearing in six
models and 0.9 in four, while block sizes of 7 and
9 both appearing 5 times each.
5 CONCLUSION
A genetic algorithm was used to optimise the design
and hyper-parameters of a convolution neural network
used for image segmentation. Previously, the U-Net
was used as a base model to be optimised. How-
ever, due in part to the small training dataset used, the
model can have a high overfitting rate. Therefore, an
updated version of the U-Net, the SA-UNet was used
as the base model in our latest experimentation as it
has shown improved performance over the original U-
Net. The SA-UNet includes a spacial attention func-
tion in the middle of it’s model. We also extend the
previous experimentation by including DropBlock.
Our results showed improved performance over
previous GA-based methods, increasing the model
best founds AUC from 0.9751 to 0.9855. We also
achieved improved performance over the base U-Net.
The base SA-UNet model still marginally outper-
forms the best model we found, with an AUC of
0.9864.
The results show the addition of DropBlock and
spatial attention in U-Net architecture improves the
models prediction and the genetic algorithm can ef-
fectively be used to find the best combination of
hyper-parameters for the model.
In future we plan to use other evolutionary algo-
rithm such as Grammatical Evolution (GE) to check
if we can improve the CNN models with more flexi-
bility. Another potential work is using different data
augmentation techniques and let the evolutionary al-
gorithm to pick the best one.
ECTA 2022 - 14th International Conference on Evolutionary Computation Theory and Applications
102

Table 4: Hyper-parameters of the 10 Best models.
TestAcc Sensitivity Speci f icity NPV PPV AUC F1 MCC Weight
Exp1 0.9666 0.7800 0.9840 0.9790 0.8277 0.9805 0.8033 0.7855 10.8 M
Exp2 0.9689 0.8225 0.9830 0.9830 0.8224 0.9855 0.8225 0.8054 8.3 M
Exp3 0.9670 0.7725 0.9856 0.9783 0.8376 0.9677 0.8038 0.7865 10.8 M
Exp4 0.9679 0.7792 0.9860 0.9790 0.8422 0.9817 0.8095 0.7927 20.3 M
Exp5 0.9672 0.7962 0.9836 0.9805 0.8231 0.9799 0.8094 0.7916 10.6 M
Exp6 0.9658 0.7547 0.9861 0.9767 0.8390 0.9751 0.7947 0.7774 20.6 M
Exp7 0.9657 0.7420 0.9872 0.9755 0.8473 0.9771 0.7912 0.7746 19.9 M
Exp8 0.9651 0.7695 0.9838 0.9780 0.8205 0.9740 0.7941 0.7756 20.4 M
Exp9 0.9670 0.7763 0.9853 0.9787 0.8352 0.9811 0.8047 0.7873 10.6 M
Exp10 0.9663 0.8189 0.9804 0.9826 0.8010 0.9813 0.8099 0.7914 10.6 M
Table 5: Hyper-parameters of the 10 Best models.
D F T K O A P B
Exp1 2 32 2 (3, 3) adam sigmoid 0.9 7
Exp2 3 16 2 (3, 3) RMSprop sigmoid 0.8 7
Exp3 2 32 2 (3, 3) RMSprop relu 0.9 9
Exp4 2 32 1 (3, 3) RMSprop sigmoid 0.8 9
Exp5 2 32 2 (5, 5) RMSprop sigmoid 0.9 7
Exp6 4 16 1 (3, 3) RMSprop softplus 0.9 9
Exp7 2 64 2 (3, 3) RMSprop softplus 0.8 9
Exp8 4 16 1 (3, 3) Nadam sigmoid 0.8 9
Exp9 2 32 2 (3, 3) RMSprop softplus 0.8 7
Exp10 2 32 1 (3, 3) RMSprop sigmoid 0.8 7
ACKNOWLEDGEMENTS
This project was supported by the Science Foundation
Ireland (SFI) Centre for Research Training in Artifi-
cial Intelligence (CRT-AI), Grant No. 18/CRT/6223,
and also the Irish Software Engineering Research
Centre (Lero), the research Grant No. 16/IA/4605.
REFERENCES
Abadi, M., Barham, P., Chen, J., Chen, Z., Davis, A., Dean,
J., Devin, M., Ghemawat, S., Irving, G., Isard, M.,
et al. (2016). {TensorFlow}: A system for {Large-
Scale} machine learning. In 12th USENIX sympo-
sium on operating systems design and implementation
(OSDI 16), pages 265–283.
Baldi, P. and Sadowski, P. J. (2013). Understanding
dropout. Advances in neural information processing
systems, 26.
Burks, A. W. (1986). A radically non-von-neumann-
architecture for learning and discovery. In Interna-
tional Conference on Parallel Processing, pages 1–17.
Springer.
Chicco, D. and Jurman, G. (2020). The advantages of the
matthews correlation coefficient (mcc) over f1 score
and accuracy in binary classification evaluation. BMC
genomics, 21(1):1–13.
Ciulla, T. A., Amador, A. G., and Zinman, B. (2003). Dia-
betic retinopathy and diabetic macular edema: patho-
physiology, screening, and novel therapies. Diabetes
care, 26(9):2653–2664.
Dietterich, T. (1995). Overfitting and undercomputing in
machine learning. ACM computing surveys (CSUR),
27(3):326–327.
Fortin, F.-A., De Rainville, F.-M., Gardner, M.-A. G.,
Parizeau, M., and Gagn
´
e, C. (2012). Deap: Evolu-
tionary algorithms made easy. The Journal of Machine
Learning Research, 13(1):2171–2175.
Ghiasi, G., Lin, T.-Y., and Le, Q. V. (2018). Dropblock:
A regularization method for convolutional networks.
Advances in neural information processing systems,
31.
Guo, C., Szemenyei, M., Yi, Y., Wang, W., Chen, B.,
and Fan, C. (2021). Sa-unet: Spatial attention u-net
for retinal vessel segmentation. In 2020 25th Inter-
national Conference on Pattern Recognition (ICPR),
pages 1236–1242. IEEE.
Holland, J. H. (1975). Adaptation in Natural and Artificial
Systems. University of Michigan Press, Ann Arbor,
MI. second edition, 1992.
Parameterising the SA-UNet using a Genetic Algorithm
103

Houreh, Y., Mahdinejad, M., Naredo, E., Dias, D. M., and
Ryan, C. (2021). Hnas: Hyper neural architecture
search for image segmentation. In ICAART (2), pages
246–256.
Kamran, S. A., Hossain, K. F., Tavakkoli, A., Zuckerbrod,
S. L., Sanders, K. M., and Baker, S. A. (2021). Rv-
gan: segmenting retinal vascular structure in fundus
photographs using a novel multi-scale generative ad-
versarial network. In International Conference on
Medical Image Computing and Computer-Assisted In-
tervention, pages 34–44. Springer.
LeCun, Y., Bengio, Y., et al. (1995). Convolutional net-
works for images, speech, and time series. The
handbook of brain theory and neural networks,
3361(10):1995.
Li, L., Verma, M., Nakashima, Y., Nagahara, H., and
Kawasaki, R. (2020). Iternet: Retinal image segmen-
tation utilizing structural redundancy in vessel net-
works. In Proceedings of the IEEE/CVF Winter Con-
ference on Applications of Computer Vision, pages
3656–3665.
Ogurtsova, K., da Rocha Fernandes, J., Huang, Y., Lin-
nenkamp, U., Guariguata, L., Cho, N. H., Cavan, D.,
Shaw, J., and Makaroff, L. (2017). Idf diabetes at-
las: Global estimates for the prevalence of diabetes
for 2015 and 2040. Diabetes research and clinical
practice, 128:40–50.
Popat, V., Mahdinejad, M., Cede
˜
no, O. D., Naredo, E., and
Ryan, C. (2020). Ga-based u-net architecture opti-
mization applied to retina blood vessel segmentation.
In IJCCI, pages 192–199.
Ronneberger, O., Fischer, P., and Brox, T. (2015). U-net:
Convolutional networks for biomedical image seg-
mentation. CoRR, abs/1505.04597.
Shin, S. Y., Lee, S., Yun, I. D., and Lee, K. M. (2019). Deep
vessel segmentation by learning graphical connectiv-
ity. Medical image analysis, 58:101556.
Staal, J. (2018). DRIVE: Digital retinal images for vessel
extraction.
Turing, A. M. (1990). The chemical basis of morphogene-
sis. Bulletin of mathematical biology, 52(1):153–197.
Uysal, E. S., Bilici, M. S¸., Zaza, B. S.,
¨
Ozgenc¸, M. Y.,
and Boyar, O. (2021). Exploring the limits of data
augmentation for retinal vessel segmentation. arXiv
preprint arXiv:2105.09365.
Vaswani, A., Shazeer, N., Parmar, N., Uszkoreit, J., Jones,
L., Gomez, A. N., Kaiser, Ł., and Polosukhin, I.
(2017). Attention is all you need. Advances in neural
information processing systems, 30.
Wang, B., Qiu, S., and He, H. (2019). Dual encoding u-net
for retinal vessel segmentation. In International con-
ference on medical image computing and computer-
assisted intervention, pages 84–92. Springer.
Winder, R. J., Morrow, P. J., McRitchie, I. N., Bailie, J., and
Hart, P. M. (2009). Algorithms for digital image pro-
cessing in diabetic retinopathy. Computerized medical
imaging and graphics, 33(8):608–622.
Woo, S., Park, J., Lee, J.-Y., and Kweon, I. S. (2018). Cbam:
Convolutional block attention module. In Proceed-
ings of the European conference on computer vision
(ECCV), pages 3–19.
Zhou, Y., Yu, H., and Shi, H. (2021). Study group learning:
Improving retinal vessel segmentation trained with
noisy labels. In International Conference on Medi-
cal Image Computing and Computer-Assisted Inter-
vention, pages 57–67. Springer.
Zhou, Z., Rahman Siddiquee, M. M., Tajbakhsh, N., and
Liang, J. (2018). Unet++: A nested u-net architecture
for medical image segmentation. In Deep learning in
medical image analysis and multimodal learning for
clinical decision support, pages 3–11. Springer.
ECTA 2022 - 14th International Conference on Evolutionary Computation Theory and Applications
104
