
Subjective Assessment of Commercially Common Input and Display
Modalities in a Driving Simulator
Kian Motahari
a
and Margarita Vinnikov
b
Department of Informatics, New Jersey Institute of Technology, Newark, U.S.A.
Keywords: Virtual Reality, Driving Simulator, Task Load, Usability, Simulator Sickness, Steering.
Abstract: Driving simulators could be valuable tools for better understanding human behavior while driving. The latter
has the potential to guide the design of roads and vehicles. In addition, studies of driving habits can help gain
insight into the relationship between human attention and locomotion. A critical aspect of a driving simulator
involves the right choice of stimulus presentation and interaction methodologies. This paper presents a driving
simulator study that evaluates a series of commonly used display and steering devices in terms of usability,
physical and cognitive task load, and simulator sickness indices. Specifically, conventional large display, com-
mercially available head-mounted display, and various steering devices were compared. Our study used two
steering devices (stationary and wireless) and a gamepad controller to control the simulated vehicle. We hy-
pothesize that using a Head-Mounted Display (HMD), although suitable for inducing immersion, might come
with the cost of possible simulator sickness and a decrease in driving performance. We analyzed the individual
and combined impact of display and steering input device types on our subjective metrics measurements. Our
results proved our hypothesis on higher perceived immersion for HMD based driving simulator. Also, the
paper highlights the trade-offs between big monitor setup and Virtual Reality (VR) in terms of workload and
fatigue.
1
INTRODUCTION
VR is a class of graphical user interfaces that gen-
erates an immersive, spatially realistic, and interac-
tive environment that could be both experienced and
interacted with using head-mounted stereo goggles,
multi-projected installation, headphones, peripheral
suits, and gloves (Brey and Søraker, 2009). The use
of VR has been prevalent in both empirical research
and industry for various operational tasks such as
driving, surgical procedures, and work with machin-
ery. Historically, multi-projected installations such as
CAVE
TM
systems were the most commonly used in
VR (Cruz-Neira et al., 1992). Such installations
require sizeable physical space, a separate tracking
system, and integration of input devices. Nowadays,
HMD are highly preferred since they still provide
binocular stereo vision, with head and hand track- ing
already Incorporated into a head-worn system. The
advantage of using VR for training and operating
purposes is the ability to simulate and replicate
a
https://orcid.org/0000-0002-5398-5881
b
https://orcid.org/0000-0001-9043-7166
hazardous and realistic situations in a controlled
manner, where the possibility of endangering the
users is either diminished or eliminated. For example,
driving simulators place the driver in an artificial
environment to recreate a real driving experience that
is conducted safely and in a controlled manner. The
driving simulator could be used not only for training
purposes but also to provide insight into driving
performance, road design, and assessment of human
behavior under different circumstances, such as the
influence of substances and severe weather and
lighting conditions (Chang, 2016). Therefore, to
account for human behavior during driving, we need
to understand what display types and interaction
modalities are most appropriate when designing
driving simulators for an average user. Consequently,
this study examines the impact of utilizing VR based
dis- plays (HMD and large TV screen) and VR
controllers (wireless and stationary steering wheels
and conventional game controllers) on subjective
metrics related to driving performance. We
Motahari, K. and Vinnikov, M.
Subjective Assessment of Commercially Common Input and Display Modalities in a Driving Simulator.
DOI: 10.5220/0011528800003323
In Proceedings of the 6th Inter national Conference on Computer-Human Interaction Research and Applications (CHIRA 2022), pages 155-162
ISBN: 978-989-758-609-5; ISSN: 2184-3244
Copyright
c
2022 by SCITEPRESS – Science and Technology Publications, Lda. All r ights reserved
155

specifically analyze the effect of these interaction and
display methods (combined and individually) on
human behavior and self- reported, driving-related
metrics.
The rest of the paper is structured as follows: First,
we review the literature related to driving in terms of
concepts of driving simulators, VR simulations, task-
dependent human behavior, evaluation of steering and
proposed methods, the fidelity of interaction and stim-
ulus, and bodily/cognitive task load.
2
RELATED WORKS
Driving performance metrics might include the time
to interact (move/rotate) with the device or the higher-
level measurements like negotiating bends or the abil-
ity to adjust the steering after perturbations. For ex-
ample, Fitts’ law is a predictive model proposed to
design interfaces to generalize involved factors. It
states that the time required to move a pointer to a
target area is dependent on the distance to the target
divided by the area of the target (Fitts, 1954). Accot
et al. (Accot and Zhai, 1999) developed a trajectory-
based testing paradigm as a study scenario in parallel
with Fitts’ positioning task. Their pro- posed steering
law can predict completion time relative to tunnel
(path) parameters (such as length and width), which
could be used as a tool for assessing trajectory-based
tasks. Yet, control of a vehicle in- volves the ability
to steer to negotiate bends at high speeds and take the
right trajectory along the curved road (Kountouriotis
et al., 2015). Van Leeuwen et al. (van Leeuwen et al.,
2015b) investigated how driving performance and
gaze behavior change through- out the time a novice
driver’s driving skills progress. A driving simulator
was used to evaluate performance and gaze activity as
participants practiced driving. They showed that
improvement in the driving performance can be
tracked and is correlated with the gaze activity and its
changes throughout practicing using the driving
simulator. They also showed that horizontal gaze
variance could be used to predict an increase in speed.
To quantify the trajectory of steering, multiple
processes have been proposed (Hedegaard et al., 2019,
Sportillo et al., 2017). Hedegaard et al. (Hedegaard et
al., 2019) used angular deviation, which is the
difference between a steering input signal and an av-
erage of all input signals to evaluate the steering per-
formance across different steering modalities. They
also quantified the smoothness of steering by using
the frequency of significant peaks of the steering input
signal. On the other hand, Sportillo et al. (Sportillo et
al., 2017) used the number of steering turns as an
indicator of steering stability after regaining control
of a simulated vehicle. In our works, we will assess
the steering performance to analyze the impact of dis-
play and input fidelity on the stability of a vehicle’s
trajectories while negotiating bends in two urban and
rural environments and also to acquire gaze-steering
coordination, which is a good indicator of driving per-
formance and level of engagement with the control of
a vehicle.
The degree of realism in a simulator is referred to
as “physical fidelity” (van Leeuwen et al., 2015a).
According to mentioned definition, physical fidelity
could be defined for multiple aspects of simulation
that include stimuli presentation (display, audio, field
of view, texture quality, etc.), input methods, and in-
teraction with the simulated content. To elicit re-
alistic responses from participants while performing
tasks like driving, we need a certain level of physi-
cal fidelity of the stimuli. However, according to (van
Leeuwen et al., 2015a), there are several drawbacks
to high fidelity simulation, which include: higher fi-
delity, the experiment will face a large number of vari-
ables to be controlled during the conduction of the ex-
periment; Simulator discomfort, which can cause par-
ticipants’ withdrawal and reduced data quality; and,
realism and high fidelity of certain types of visual
information might be unnecessary or even distract-
ing to evoke realistic performance from the partici-
pants. As a result, we need to address both the impact
of display or interaction fidelity solely or combined.
Van Leeuwen et al. (van Leeuwen et al., 2015a) in
their study, implemented three levels of visual fidelity
for a driving task experiment to evaluate the lane-
keeping and gaze strategies adopted by participants.
They demonstrated that the highest fidelity scenario
resulted in higher steering activity, driving speed, and
horizontal gaze variance compared to medium and
low fidelity scenarios. Also, their driving simulator
study addressed the impact of visual fidelity on curve
negotiation, gaze behavior, and self-reported discom-
fort. They used three levels of visual fidelity (high
fidelity with texture, mid-range fidelity without tex-
tures, and low-fidelity with only lane markers). They
showed higher steering activity on the straight road,
higher speed, and a higher degree of gaze variance for
the high-fidelity scenario compared to the other two
scenarios. It is not enough to address the impact of
fidelity of only display or interaction method on driv-
ing; it is also important to analyze the complex effect
of fidelity of display and input modality combined.
McMahan et al. (McMahan et al., 2012) addressed the
independent and compound effect of display and
interaction fidelity on participants’ performance in a
VR first-person shooter game using a six-sided CAVE
CHIRA 2022 - 6th International Conference on Computer-Human Interaction Research and Applications
156

system. They showed that the compound effect of low
fidelity and high fidelity for both display and interac-
tion could significantly improve the in-game perfor-
mances (completion time, damage taken, etc.). This
effect could be associated with familiarity with those
combinations (low or high fidelity for display and
interaction), which resembles the standard desktop
FPS games and real-life experiences. In the current
study, we examine the compound impact of physical
fidelity in terms of field of view, which is presented
in the form of HMD based and display-based stimuli
presentation (display fidelity), and input methods,
presented here in the form of controller-based
methods and realistic commercial steering devices
(input fidelity) on driving-related performances, and
also on perceived levels of immersion, sense of
agency, cognitive and physical task load, and
simulator discomfort.
An important aspect of a simulation is the mental
and physical effort the users need to engage with the
environment and interaction modalities. Cognitive
task load is the total amount of user’s mental demands
required to use a specific system (Luxton et al., 2016)
and workload, according to (Hart and Staveland,
1988), is defined as the perceived relation- ship
between the number of available resources and the
required amount by a given task. Various surveys can
be used to quantify the cognitive and bodily task load.
For example, the most commonly used survey is the
NASA Task Load Index (NASA TLX), which is a
self-reported measure of workload (Hart and
Staveland, 1988). It evaluates the task load along six
axes: mental demand, physical demand, temporal
demand, effort, frustration, and self-performance. Al-
though NASA-TLX was initially designed for pilots
of space flights, it has been adapted for other envi-
ronments and tasks such as surgery and driving activ-
ity. For example, Kountouriotis et al. (Kountouriotis
et al., 2015) examined the impact of cognitive load on
steering performance. Their study evaluated the
effect of attention on steering performance in a sim-
ulated driving task. They used gaze fixation points
(as a contributor to the cognitive load) that their po-
sition was either changing relative to the vehicle or
was fixed relative to the vehicle. Their result indicated
that the gaze fixations that were not analogous to the
future path cause steering biases. Furthermore, Har-
ris et al. (Harris et al., 2020) discussed the additional
factors that are needed to be incorporated into the cur-
rent workload measures for VR tasks. These factors
include a degree of immersion, perceptual challenge,
and methods to control the environment. In this work,
we use NASA-TLX, simulation sickness, and a us-
ability questionnaire (that includes items related to
immersion, overall satisfaction and excitement, and
fatigue in involved body parts) tailored for our spe-
cific VR task to evaluate users’ experience of driving
in VR.
3
METHOD
The present work aims to evaluate the impact of dis-
play and steering input methods on driving-related
fidelity for subjective and objective measures. The
study also explored the relationship between eye-hand
coordination in driving, control of the vehicle’s trajec-
tory, and perceived sense of immersion, fatigue, and
cognitive and bodily effort. The present study follows
a within-subject design with two independent vari-
ables (display type and controller type) that formed
six blocks. These blocks included all possible com-
binations of two display options (large display and
HMD) and three steering devices (stationary steer-
ing device, wireless steering device, and manual con-
troller). The main task included driving through a se-
ries of designated paths that involved driving straight
and turning right and left. In all three possible instruc-
tions, participants were asked to control the steering
and velocity of the virtual vehicle through an inter-
section and then either continue straight, turn right, or
turn left. Each trial ends when a participant reaches
a designated endpoint. Trials took place in two dis-
tinct virtual scenes (urban and rural characteristics)
with an equal amount of turns in each scene. Conse-
quently, each block consisted of twelve trials that had
two variables of scene type (urban and rural), driving
instruction type (straight, left, right), and two repeats.
To test the impact of each scenario block, we col-
lected the participants’ subjective assessment of sim-
ulation discomfort, immersion, and task cognitive and
physical workload by using questionnaires after each
block. Gaze movements and steering activities were
recorded during driving tasks, and we discuss them in
a separate report. We hypothesized that: A higher
degree of immersion will be experienced in the HMD
scenarios, regardless of the input method. And less
physical discomfort and simulation sickness would be
experienced using the steering wheel (stationary and
wireless) scenarios.
3.1
Participants
The present study includes 18 participants (5 female
and 13 male), all over 18 years old (M = 20.6 ± 3.5).
With all of them having previous driving experience
and 8 participants who had prior experience with VR.
Written informed consent was obtained from all par-
Subjective Assessment of Commercially Common Input and Display Modalities in a Driving Simulator
157

ticipants following a protocol approved by the Institu-
tional Review Board at NJIT. Participants were asked
to report any proneness to cybersickness or prior ex-
perience of dizziness with VR. One participant was
excluded from the experiment and performing the
tasks.
3.2
Stimuli
This experiment has used costume-made software de-
veloped with Unity 3D software (Haas, 2014). At the
start, participants’ ID and input device, and display
type are set, and before the onset of the main scene,
the calibration scene is presented. We also had a neu-
tral scene for training, which we let participants try
before the start of each to familiarize them with the
control of the vehicle using the block’s input device.
If participants had already trained with a given input
device in a subsequent block, we skipped the training
session (a total of four times of running the training
scene). The calibration scene was the standard
calibration process provided by the Pupil Labs eye
tracker add-on for unity. The driving tasks of the
experiment took place in two scene types - urban and
rural scenes. The urban scene included intersections in
a city model (Manufacture), and the rural scene
features a rural area with a roundabout in the center
of the virtual scene. Both scenes included active
pedestrians, but only in the urban scene, participants
could cross the intersection. In the HMD-based
blocks, instructions were shown on the speedometer
and car dash- board monitor. Instructions were
presented on the speedometer for the monitor-based
blocks due to the fixed camera position. Also, both
scenes included an intersection (a roundabout for the
rural scene) where participants were instructed to
perform the driving task (right and left turns and
driving straight) on them. Both scenes include
pedestrians, but only in the urban scene do they cross
the road, depending on the traffic light.
The platform used for the experiment was a PC
(six cores Core i7 3.7 GHz, Nvidia GTX 1070). Two
steering wheel devices were Logitech G920 (for PC)
(Logitech, 2015) as the stationary steering wheel
setup, and Hyperkin S Wheel Wireless Racing
Controller (Hyperkin, 2019) as the wireless steering
wheel setup. Both devices feature hand pedals that
we used to control of the vehicle. For the manual
control as the input method, we used 6-DoF HTC
VIVE controllers (Corporation, 2018) and Xbox one
controller (Microsoft) respectively paired with HMD
and large monitor scenarios. A 42 inches 4k TV, and
HTC VIVE Pro VR headset (Corporation, 2018) were
used for the large display scenarios, and the HMD-
based scenarios, respectively.
3.3
Procedure
Upon arrival, each participant was given a consent
form and a short study description. Participants were
strongly encouraged to read the provided documents,
ask questions, and express any concerns before sign-
ing the consent document.
This was followed by
a short demographic questionnaire and a simulation
sickness questionnaire. Then participants were ex-
posed to six experimental blocks in random order.
Before the start of each block, participants were pro-
vided with a short trial scene to familiarize themselves
with the input/display modalities of the block. After
participants were comfortable with steering with the
provided controller for the trial, an experimental
block would start. At the beginning of each block,
users’ gaze was calibrated based on Pupil Labs’
mobile eye-tracker and VR add-on. The calibration
was a non-invasive process that required users to stare
at five fixation targets for a predefined amount of
time. After all points were collected, an experimenter
was presented with an accuracy index. If the index was
be- low 0.9, the calibration procedure was repeated. If
the calibration procedure had failed after three trials,
the experiment for that participant was terminated.
During the block, the participant was presented with
12 trials. Participants were instructed to finish a
driving task for each trial within the block. We
terminated the trial if participants crashed the vehicle
to the sides of the road, or in the case of the urban
scene, also crashing with the virtual pedestrians
caused the trial termination. After finishing each
block, participants were provided with usability,
simulator sickness, and NASA task load
questionnaires (TLX). Each experiment was followed
by a debriefing session.
3.4
Data Analysis
NASA Task Load Index (NASA-TLX) included six
questions on a designated seven-point Likert scale. R
programming language was used to import the cumu-
lative data for statistical analysis. We used raw scores
from each section to determine the significance of dif-
ferences between the six experimental blocks. The
usability questionnaire (table 1) used in this study in-
cluded 30 questions that cover physical comfort, as-
pects of game-play like accuracy and control of the
task, immersion, sense of presence, and sense of con-
trol over the task. All answers were available seven-
point Likert scale responses. Scores were ordinal data
without the assumption of normality. Simulator Sick-
CHIRA 2022 - 6th International Conference on Computer-Human Interaction Research and Applications
158
ness Questionnaire (SSQ) used in this study included
the assessment of 15 symptoms that range from gen-
eral discomfort to specific symptoms like nausea and
sweating. Each symptom had a four-level response
that included none, slight, moderate, and severe. For
the analysis of subjective data scores, with regards to
block specifications, we used R and (Kuznetsova et
al., 2017) package to perform a mixed model analysis
of the relationship between task load, simulator
sickness, and usability scores, separately, and input
and display modalities of the driving block. As fixed
effects, input and display types with interaction terms
in the model were used. As random effects, we had
intercepts for participants. P-values were obtained by
likelihood ratio tests of the full model with effects in
question against the model without the effect in ques-
tion.
4
RESULTS
The usability questionnaire questions were split into
three sections: questions related to the overall sat-
isfaction of the experiment, questions related to the
sense of immersion and presence, and those associ-
ated with physical comfort. This discrimination is
due to the contextual similarities of the questions and
similar relationships with the display and input sce-
narios. Results of the mixed model analyses for the
usability questionnaire items revealed that the choice
of input device significantly impacted 19 out of 30
questions, and 18 out of 30 questions were predicted
by the display type (for concrete results, see table 1).
However, no significant effect of interaction between
display type and input device type on any of the us-
ability questions has been observed. Among five us-
ability questions related to the overall satisfaction of
the experience and enjoyment (Q18 to Q22 table 1),
satisfaction or enjoyment of the experience, sense of
accomplishment, and suitability of task to gameplay
increased by the two steering devices (stationary and
wireless). However, excitement with experience in-
creased by HMD and steering devices. The score of
all questions related to the sense of immersion, pres-
ence, and engagement with the virtual environment
(Q1 to Q12 from table 1) increased for the scenarios
with HMD display and steering wheels in compari-
son to a large monitor and gamepad controller. The
only exception is the perceived picture quality (Q12,
table 1), which showed the highest scores for condi-
tions with monitor display. For the fatigue-related and
physical comfort items (Q13 to Q17 of table 1), fa-
tigue in the wrist and fatigue in neck decreased for the
monitor display blocks, fatigue in fingers decreased
for the steering devices, and overall physical comfort
enhanced for the monitor-based scenarios, and com-
fort with the viewing position increased for the steer-
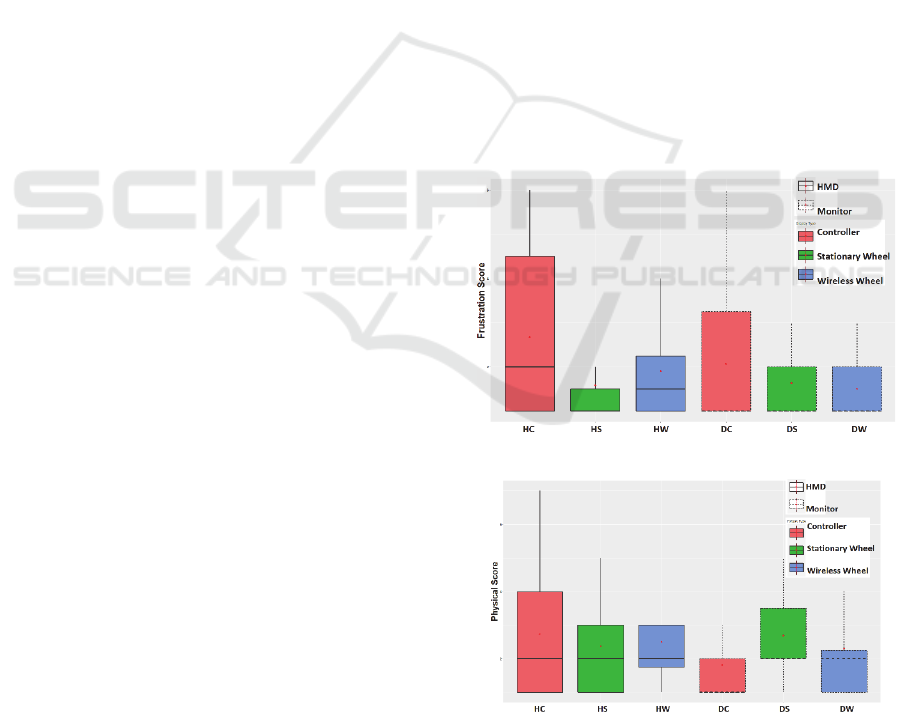
ing devices. For the NASA task load scores, the inter-
action effect of display and input impacted the physi-
cal score (
χ
2
(2) = 6.31, p = 0.04), the interaction of
monitor display and stationary wheel input increasing
it by 1.16 ± 0.47 (Likert scale score), and monitor
display and wireless wheel input increasing it by 0.82
± 0.47 (figure 1b). Also, the interaction effect of input
and display types affected performance score (
χ
2
(2) =
11.11, p = 0.004), monitor display and stationary
wheel lowering it by 1.69 ± 0.55. Lastly, in- put type
impacted the frustration level (
χ
2
(2) = 8.19, p = 0.01),
stationary wheel input lowering it by 1.07 ± 0.39
(figure 1a). From simulator sickness related scores, we
observed a significant effect of input de- vice type on
the general discomfort level (
χ
2
(2) = 6.53 , p = 0.038).
Level of the fatigue was impacted by the input device
type (
χ
2
(2) = 7.02, p = 0.03). Self reported headache
induced by the trial blocks was significantly affected
by the type of display (χ
2
(1) = 6.26, p = 0.01), and also
by the input device type (χ
2
(2) = 6.98, p = 0.03), but
no interaction effect was observed.
(a)
Frustration level scores of NASA TLX across
experimental blocks.
(b)
Physical task load scores of NASA TLX across
experimental blocks.
Figure 1: Compound effect of the input device and display
type on frustration level and physical load of NASA TLX
questionnaire based on experimental blocks.
Subjective Assessment of Commercially Common Input and Display Modalities in a Driving Simulator
159

Table 1: Results of the mixed model analysis of the effect of the input and display modalities on the usability items. Impact
of display and/or input modality on each score is indicated according to the likelihood ratio (* p < 0.05, ** p < 0.01, *** p
< 0.001).
Displa
y
Input
Usability Question p-value
χ
2
Df p-value
χ
2
Df
Q1
Rate you
r
sense of immersion *** 20.56
1
*** 24.37
2
Q2
Rate you
r
sense of
b
eing in the virtual environmen
t
*** 17.42
1
** 10.73
2
Q3
How
much
did
it
seem
as
if
you
could
reach out and touch
the objects or people you saw
*** 17.42
1
** 10.73
2
Q4
How often when an objec
t
seemed to
b
eheade
d
towar
d
you did you want to move to get out of its way
*** 17.42
1
** 10.73
2
Q5
To
what
extent
did
you
experience
a
sense of ’being there’
inside the environment you saw
*** 16.90
1
*
6.28
2
Q6
How often di
d
you wan
t
to try to touch something you saw *** 16.9
1
*
6.28
2
Q7
How involve
d
was the experience *** 14.28
1
*** 16.93
2
Q8
How completely were you
r
senses engage
d
*** 18.44
1
*** 14.03
2
Q9
To wha
t
exten
t
did you experience a sensation of reality *** 20.95
1
** 10.62
2
Q10
How engaging was the experience *** 17.81
1
*** 22.27
2
Q11
Overall, how much di
d
touching the things an
d
p
eople in the
environment you saw/heard feel like it would if you had
ex
p
erienced them directl
y
*** 17.81
1
*** 22.27
2
Q12
How was the
p
icture quality during the experience *** 13.30
1
2.93 0.23
2
Q13
Rate you
r
p
hysical comfor
t
level afte
r
you
r
experience
*
5.07
1
0.08 4.91
2
Q14
Rate you
r
soreness o
r
fatigue of the wris
t
** 9.28
1
0.87 0.27
2
Q15
Rate you
r
soreness o
r
fatigue in fingers 0.06 3.28
1
*** 20.65
2
Q16
Rate you
r
soreness o
r
fatigue in nec
k
o
r
shoulde
r
*
4.77
1
0.33 2.20
2
Q17
How comfortable were you with you
r
viewing
p
osition 0.20 1.62
1
*
7.66
2
Q18
How exciting was the experience
*
5.16
1
*
8.39
2
Q19
Overall, how satisfying o
r
enjoyable was the experience you
j
us
t
had
0.97 0.0008
1
*** 23.8
2
Q20
Rate suitability of the tas
k
to gameplay 0.85 0.03
1
*** 24.25
2
Q21
Rate you
r
sense of enjoymen
t
0.12 2.40
1
*** 36.53
2
Q22
Rate you
r
sense of accomplishmen
t
0.41 0.65
1
*** 16.68
2
Q23
Rate you
r
soreness o
r
fatigue in arms 0.30 1.07
1
0.81 0.40
2
Q24
Rate you
r
p
recision/accurac
y
0.81 0.05
1
0.12 4.22
2
Q25
Rate you
r
control of the tas
k
0.79 0.07
1
0.31 2.31
2
Q26
Rate you
r
sense of challenge 0.75 0.10
1
0.09 4.70
2
Q27
Overall, how well do you feel you have
b
een driving 0.38 0.76
1
0.17 3.46
2
Q28
Overall, how easily do you feel you have
b
een driving 0.88 0.02
1
0.37 1.93
2
Eye strain was predicted by the display type (χ
2
(1) =
13.80, p =0.0002). A significant impact of the input
device type on the sense of nausea was observed (χ
2
(2) = 9.07, p = 0.01). For the sense of dizziness, we
saw display type significantly impacting it (χ
2
(1) =
4.26, p = 0.03). Finally, We observed that the sense
of ”fullness of head” was impacted by the display
modality (χ
2
(1) = 4.66, p = 0.03).
5
DISCUSSION
This article explored how different combinations of
steering input devices and display types for our driv-
ing simulator could impact participants’ assessment
of task load, simulator sickness, and usability. It was
observed that both steering input devices lowered the
general discomfort from SSQ, while the gamepad
controller increased it. This observation agrees with
the higher level of frustration from the usability data
for the conventional controller. Wireless and station-
ary steering wheel devices also caused lower fatigue
levels (form SSQ). The observations from the result
section provide support for the claim that HMD and
the realistic steering devices improve the sense of im-
mersion and engagement with the driving experience.
CHIRA 2022 - 6th International Conference on Computer-Human Interaction Research and Applications
160

Also, realistic steering devices helped participants to
have a more satisfying driving experience and report
less fatigue in their fingers. However, the monitor
display was superior to the HMD in terms of reporting
less fatigue in the neck and wrist and higher perceived
picture quality and physical comfort. Relatively
lower reported physical comfort and higher fatigue in
the neck for the HMD scenarios were expected due to
the additional weight of the headset. However, higher
fatigue in the wrist for the HMD scenarios could be
because, throughout the experiment, we observed that
participants tend to match the physical position of the
wireless steering device with its in-game position
when using the HMD (that could cause more physical
load on the wrists), while for the monitor-based
scenarios they tend to hold the wireless steering
device in a more comfortable position (usually on
their feet) rather than trying to match it with the on-
display position. Also, a higher immersion and
engagement with an environment were reported for
the HMD scenarios that made participants mimic and
reproduce the real-life driving experience. Also, since
the output resolution of the display and HMD were
the same, higher perceived picture quality for the
monitor scenarios could be related to the results from
the simulator sickness data that participants reported
a lower level of eye strain for the monitor scenarios,
and therefore it impacted their perception of picture
quality. In addition, according to (Vinnikov and
Allison, 2014), which explored the impact of depth of
field (DOF) for stereoscopic and non-stereoscopic
displays on perceived image quality and viewing
comfort, DOF rendering in HMD scenarios could be
the reason for lower perceived im- age quality over
monitor-based scenarios. Due to the no interaction
effect of input and display modalities on usability
questions, display, and input modalities aren’t
interdependent. Results indicated a strong interaction
effect of input and display types on physical task load
and self-evaluation of performance from the NASA
task load questionnaire. Also, from the NASA task
load, it was observed that the realistic in- put devices
(i.e., wireless and stationary wheels) lowered the level
of reported frustration compared to the gamepad
controllers. Although the stationary steering wheel
caused the lowest amount of frustration regardless of
the display type, it decreased the self-evaluated
performance when paired with the monitor display.
This observation implies that the realistic in-put
device results in the best performance assessment
paired with a more immersive display method. In line
with these results, (McMahan et al., 2012) also
showed that the compound effect of input and dis-
play fidelity, when both are high or low fidelity, im-
proves the performance in their game scenario dis-
cussed in the related works section.
Steering input
devices and large display scenarios lowered the self-
reported ratings for the headache symptom relative to
other conditions. Higher levels of eye strain (from
SSQ) have been recorded for the HMD in compari-
son to the monitor display scenarios. Interestingly,
regarding the nausea symptom (from SSQ), wireless
stationary steering input devices recorded lower lev-
els, regardless of the display setup. This is significant
because no interaction effect has been shown on nau-
sea. Also, HMD-based scenarios indicated a higher
degree of reported dizziness than monitor-based ones.
Finally, from the SSQ, similar to the dizziness symp-
tom, a higher degree of fullness of the head has been
shown for the monitor display scenarios. These re-
sults indicate that when a realistic controlling scheme
is paired with an immersive display type, symptoms
associated with simulator sickness tend to decrease.
However, although in general monitor-based scenar-
ios caused fewer simulator sickness symptoms, when
paired with realistic input devices caused more symp-
toms in comparison to when paired with a controller.
Also, according to the results, lower discomfort for
the monitor display scenarios from the SSQ data con-
firms the observation from the usability questionnaire.
In addition, the usage of realistic input devices (sta-
tionary and wireless steering devices) lowered the dis-
comfort, which could be because the control scheme
for those devices was intuitive to the driving task
(higher suitability of task to gameplay for the steer-
ing wheels from the usability results) in comparison
to the scenarios with a gamepad controller. Despite
these observations, results from NASA TLX ques-
tionnaire indicated that a stationary steering device,
when paired with the monitor display, causes a higher
level of physical task load. This observation sug-
gests that although the more intuitive control scheme
causes lower physical discomfort when paired with
immersive stimulus presentation, it also mitigates the
physical task load overhead of realistic interactions
and force feedback.
6
CONCLUSION
This study focused on evaluating different types of
steering devices and display methods in a driving sim-
ulator in relation to participants’ subjective assess-
ment of the driving experience. Six stimulus presen-
tation and interaction blocks were designed to com-
prise all possible pairs of two steering devices and
controllers and two display methods. The results in-
dicate that in terms of immersion, sense of presence,
Subjective Assessment of Commercially Common Input and Display Modalities in a Driving Simulator
161

sense of agency, comfort, and achievement, two steer-
ing wheels (wireless and stationary), especially when
paired with VR headset, are superior to conventional
VR and non-VR controllers. Further analysis of gaze-
steering correlation, distribution of fixations across
the Area of Interest (AOI)s, and the relationship be-
tween subjective assessment of task load and calcu-
lated steering effort, based on made trajectories, is in
perspective. One shortcoming of the current works
was the lack of the ability of natural steering (actual
rotation) for the conventional controllers. Also, due
to the increasing number of variables, we did not ac-
count for participants’ positional and rotational infor-
mation in the blocks with large displays. Finally, this
work had a limited number of road types and driving
scenarios. Nonetheless, more studies are needed to
address the exact variables associated with steering
devices and displays related to observed impacts on
subjective assessments. Possible improvements for
controller-based scenarios should be examined. Due
to the variability of optical flow in different scenes,
when driving, further investigation into the relation-
ship between changes in optical flow and its impact
on gaze-steering correlation is essential. Then, we
can address how changes in the visual information (in
urban vs. rural scenes) that alter perceived motion
and are associated with simultaneous steering actions
could constitute the levels of bodily discomfort and
task load (physical, cognitive, temporal).
REFERENCES
Accot, J. and Zhai, S. (1999). Performance evaluation of
input devices in trajectory-based tasks: an application of
the steering law. In Proceedings of the SIGCHI
conference on Human Factors in Computing Systems,
pages 466–472.
Brey, P. and Søraker, J. H. (2009). Philosophy of computing
and information technology. In Philosophy of tech-
nology and engineering sciences, pages 1341–1407.
Elsevier.
Chang, K.-H. (2016). e-Design: computer-aided engineer-
ing design. Academic Press.
Corporation, H. (2018). VIVE Pro HMD User guide.
Cruz-Neira, C., Sandin, D. J., DeFanti, T. A., Kenyon, R. V.,
and Hart, J. C. (1992). The cave: audio visual experi-
ence automatic virtual environment. Communications of
the ACM, 35(6):64–73.
Fitts, P. M. (1954). The information capacity of the human
motor system in controlling the amplitude of move-
ment. Journal of experimental psychology, 47(6):381.
Haas, J. K. (2014). A history of the unity game engine.
Harris, D., Wilson, M., and Vine, S. (2020). Development
and validation of a simulation workload measure: the
simulation task load index (sim-tlx). Virtual Reality,
24(4):557–566.
Hart, S. G. and Staveland, L. E. (1988). Development of
nasa-tlx (task load index): Results of empirical and
theoretical research. In Advances in psychology, vol-
ume 52, pages 139–183. Elsevier.
Hedegaard, M., Støttrup, N., Sørensen, F. F., Langer, T. H.,
and Samani, A. (2019). Evaluation of five steering in-
put devices in terms of muscle activity, upper body
kinematics and steering performance during heavy machine
simulator driving. International Journal of Industrial
Ergonomics, 72:137–145.
Hyperkin (2019). S Wheel Wireless Racing Controller User
Manual.
Kountouriotis, G. K., Wilkie, R. M., Gardner, P. H., and
Merat, N. (2015). Looking and thinking when driv- ing:
The impact of gaze and cognitive load on steer- ing.
Transportation research part F: traffic psychol- ogy
and behaviour, 34:108–121.
Kuznetsova, A., Brockhoff, P. B., and Christensen, R. H.
(2017). lmertest package: tests in linear mixed effects
models. Journal of statistical software, 82:1–26.
Logitech (2015). Logitech G920 Driving Force Racing
Wheel User Guide.
Luxton, D. D., June, J. D., Sano, A., and Bickmore, T.
(2016). Intelligent mobile, wearable, and ambient
technologies for behavioral health care. In Artifi- cial
intelligence in behavioral and mental health care, pages
137–162. Elsevier.
Manufacture, N. Windridge city Unity Asset.
McMahan, R. P., Bowman, D. A., Zielinski, D. J., and
Brady, R. B. (2012). Evaluating display fidelity and
interaction fidelity in a virtual reality game. IEEE
transactions on visualization and computer graphics,
18(4):626–633.
Microsoft. Xbox One Wireless Controller.
Sportillo, D., Paljic, A., Boukhris, M., Fuchs, P., Ojeda, L.,
and Roussarie, V. (2017). An immersive virtual re-
ality system for semi-autonomous driving simulation: a
comparison between realistic and 6-dof controller-
based interaction. In Proceedings of the 9th Interna-
tional Conference on Computer and Automation En-
gineering, pages 6–10.
van Leeuwen, P. M., Gómez i Subils, C., Ramon Jimenez,
A., Happee, R., and de Winter, J. C. (2015a). Effects of
visual fidelity on curve negotiation, gaze behaviour and
simulator discomfort. Ergonomics, 58(8):1347– 1364.
van Leeuwen, P. M., Happee, R., and de Winter, J. C.
(2015b). Changes of driving performance and gaze
behavior of novice drivers during a 30-min simulator-
based training. Procedia Manufacturing, 3:3325– 3332.
Vinnikov, M. and Allison, R. S. (2014). Gaze-contingent
depth of field in realistic scenes: The user experience. In
Proceedings of the symposium on eye tracking re-
search and applications, pages 119–126.
CHIRA 2022 - 6th International Conference on Computer-Human Interaction Research and Applications
162
