
A Preliminary Investigation into the Factors Impacting
Tyre Failure in Wheelchair Basketball
Rajtilak Kapoor, Hugo Espinosa and David Rowlands
Griffith School of Engineering and Built Environment, Griffith University, Kessels Road, Nathan, Australia
Keywords: Technology, Sport, Wheelchair Sport, Basketball, Tyre Failure.
Abstract: Wheelchair sports are increasingly gaining popularity amongst athletes and spectators alike. This report
outlines work carried out investigating the physical influences on the equipment used for Wheelchair
Basketball. The preliminary experimental study explores the degradation of wheelchair tyres through the
analysis of temperature, inflation pressure, acceleration, gameplay, individual playstyle, and strategy. With
the aid of pressure monitoring and inertial measurement technology the study investigated the impact of player
action on the wheelchairs. The experimental study was carried out in two phases employing the first phase of
testing to provide the basis of the second phase. Through the first phase it was observed that the different
temperature modalities did not have a significant impact on the degradation. The second phase focused on
pressure observations and inertial sensor data paired with video. Through this process, the effect of player
action was observed to have the greatest impact on the tyre degradation. Aggressive playstyles characterised
by heavy impacts, and sharp decelerations were shown to play a significant role in reducing equipment
reliability.
1 INTRODUCTION
The physical benefits of exercise are well investigated
for able-bodied individuals, enhanced psychological
benefits for those living with disabilities may be an
additional pro that still requires further enquiry.
Improvements in general quality of life and an
opportunity to positively reinterpret their abilities and
roles in society being key contributors to maintaining
good mental health (Bergamini, et al., 2015).
Wheelchair sports are becoming increasingly popular
for athletes with disabilities and amongst spectators.
Wheelchair Basketball (WB) is the most developed
sport in relation to the number of participants,
understanding of the rules by the audience,
organisation, standardisation, and quality of training
(Seron, de Carvalho, & Greguol, 2019). Under the
rules of WB, wheelchairs are considered a part of the
player themselves (IWBF Executive Council, 2020).
Athletes, therefore, rely on their wheelchairs
functioning in perfect condition to be able to train and
deliver high level performances. Tyre reliability and
the logistical demands created to meet the challenge
presented by critical tyre failure, have become a
major factor in diminishing performance. Alongside
this, the impact on gameplay and strategy also hinders
participation levels from prospective players,
especially in competitions that require interstate or
international travel.
This paper describes a preliminary study into the
sport of WB and the physical factors impacting the
degradation of the equipment used. The study
investigates the factors impacting critical failure of
tyres in WB, by experimentally determining the
influence of phenomenon such as friction, internal
tyre pressure, and in-game collisions. The study aims
to provide insight into the causation of tyre failures,
and lay the groundwork for future enquiry. The small
study attempts to break new ground with limited
resources and testing opportunities, to undertake the
initial research required to provide justification for
larger and more in-depth investigations in the future.
2 BACKGROUND
Investigations into WB and other wheelchair sports
have primarily been targeted at performance
enhancement, and the impact of the equipment on the
physiology of the athlete (Seron, de Carvalho, &
Greguol, 2019). The existing work appears scarce in
relation to the reliability of the wheelchairs. The
review process carried out, covered investigations
Kapoor, R., Espinosa, H. and Rowlands, D.
A Preliminary Investigation into the Factors Impacting Tyre Failure in Wheelchair Basketball.
DOI: 10.5220/0011538100003321
In Proceedings of the 10th International Conference on Sport Sciences Research and Technology Support (icSPORTS 2022), pages 93-100
ISBN: 978-989-758-610-1; ISSN: 2184-3201
Copyright
c
2022 by SCITEPRESS – Science and Technology Publications, Lda. All rights reserved
93
into the physiological impact of WB, tyre types,
external and internal physical conditions, alongside
the use of technology to develop an improved insight
into WB.
Camber angle has been defined as the angle of the
wheels with respect to the vertical axis, such that the
distance between the top points of the wheels is less
than that of the bottom points (Mason B. S., Van der
Woude, de Groot, & Goosey-Tolfrey, 2011). Sports
wheelchairs have large cambered rear wheels which
by expanding the wheelbase area provide increased
stability. Tubular pneumatic tyres are a popular
choice for athletes since these tyres are enclosed
within the rim wall of the wheels enabling higher
inflation pressure (i.e., 125 psi) and are believed to be
less prone to punctures (Brandt, 1993). A study
investigating the influence of various tyre
configurations, highlighted the importance of the tyre
type and the internal pressure (Mason, Lemstra, van
der Woude, Vegter, & Goosey-Tolfrey, 2015). The
study found that the preferred pneumatic tyres
reduced the physiological demand, compared to
failure proof solid tyres. The same study highlighted
the importance of minimising rolling resistance and
concluded that inflation pressure had a significant
impact on performance, but there existed a point
beyond which the pressure becomes too high to
provide athletes with enough grip to perform.
Operating conditions and workload experienced
by the wheelchairs play a significant role in the failure
of tyres. The literature reports that operating
conditions such as under- or over-inflation, excess
weight, and improper wheel orientation are major
contributing factors to early or unexpected tyre failure
(Evans, 2002). A study looking into the workload on
athletes estimated that players travelled up to 5 kms
per game and approximated 64% of game time spent
in propulsion (Coutts, 1992). Court sports, unlike
racing require braking, sharp changes in direction,
striking, catching, and contact alongside acceleration
and speed maintenance. Such investigations provide
support for the use of pneumatic tyres for WB.
Fuss (2012) discussed the validity of gyroscopes
in accurately ascertaining performance metrics in
wheelchair sports through experimentally and
empirically evidenced knowledge gathered over a 7-
year period. Shepherd et al. (2018) through an
extensive review process highlighted the efficacy of
IMUs for use in wheelchair court sports, while
recognising algorithm and hardware barriers in
widespread adoption. The impact of the operant
conditions on the reliability of the playing equipment,
however, remains largely unexplored.
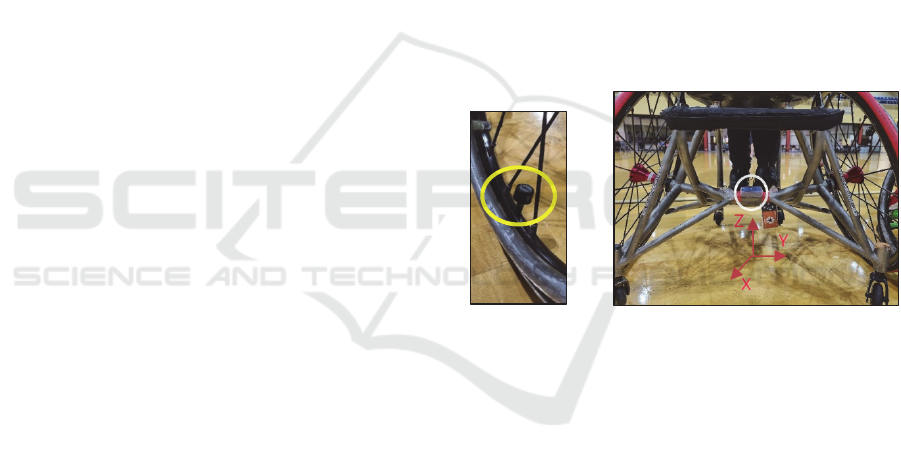
2.1 Instrumentation
A temperature gun (Fluke Corporation) and pressure
gauge (BBB Digital Pressure Gauge) were employed
for non-invasive measurement of tyre temperature
and inflation pressure. The Fobo Bike 2 sensors (Fobo
Tyre) monitor tyre pressure and temperature in real
time, and provide real time tracking through
Bluetooth connectivity, and generate data logs
(Boada, Lazaro, Villarino, Gil-Dolcet, & Girbau,
2021). The pressure/temperature sensors attach on to
the tyre valves (Figure 1(a)) with minimal interaction
with the athletes and constantly monitor the internal
operating conditions of the tyre.
In-house IMU sensors (Espinosa, Shepherd,
Thiel, & Worsey, 2019), 55×30×13 mm and 23 gms,
comprising a 16g triaxial accelerometer, ±2000
o
/s
triaxial gyroscope, ±7 Gauss triaxial magnetometer,
and an LED added for video synchronisation, were
used in this study. The sampling rate was set to 250
Hz. The sensors have 2.4 GHz wireless connectivity
and an SD card for local data storage.
(a) (b)
Figure 1: (a) Fobo Bike 2 sensor attached to valve
(b) SABEL Sense attachment location to wheelchairs
(circled) with axis orientation.
3 METHODOLOGY
The investigative process consisted of physical
testing divided into two phases. The first phase
examined the effect of temperature and pressure on
the tyres in training and games, while the second
phase examined the effect of player actions and the
impact on the tyres in match like situations. The
results obtained from the first phase were used to
inform the testing procedure for the second phase,
where the IMU and video files were synchronised to
analyse shortlisted events from the in-game collisions
observed.
icSPORTS 2022 - 10th International Conference on Sport Sciences Research and Technology Support
94

3.1 Participants
Overlapping sets of participants formed the groups
engaged for the purposes of this investigation.
Preliminary testing was carried out with 22
wheelchair athletes of varying classification (Mean
(M)=2.8, Standard Deviation (SD)=1.4) and
experience levels. Final stage testing was carried out
with 7 individuals (M=2.8, SD=1.0). These
individuals were selected based on player quality, and
classification. Classification was used to form testing
categories, following suggestions supporting a
restructure of the classification system (Molik,
Laskin, Kosmol, Skucas, & Bida, 2010). All final
testing phase participants provided written consent
and were given necessary information about the
research and methods used. All investigative tasks
were carried out following complete Ethics approval
obtained from the Human Research Ethics
Committee at Griffith University (GU Ref no.
2021/917).
3.2 Testing
3.2.1 Phase 1
Phase 1 was carried out at six training sessions and a
friendly tournament. Tyre and court surface
temperatures were recorded at the start of trainings, at
the halfway mark, and at the end of each session. Tyre
inflation pressures were recorded at one training
session at the start and the end. The ambient
temperature was recorded at the start of every
training.
Testing at the friendly tournament focussed on 10
participants (M=2.8, SD=1.2) pre-selected by
coaches from within the preliminary testing group.
The tournament took place at the Boondall
Entertainment Centre’s (Brisbane, Australia)
basketball facilities with the participants spread out
over 5 distinct teams created for the purposes of the
tournament comprising athletes of varying WB
ability and experience. Tyre temperatures were
recorded for 7 games with measurements being made
pre-game and at the conclusion of each quarter.
Pressure measurements were made for 4 participants
over the course of 3 games with readings being taken
pre-game, at half-time, and the end of the game.
External ambient and court surface temperatures were
recorded at the start of each game.
3.2.1 Phase 2
Phase 2 targeted inflation pressure, the influence of
in-game manoeuvres, and collisions using the TPMS
and IMUs. The variance displayed was tracked first
at a 2-hour weekly training session, similar to those
in phase 1, and a specialised training camp. The
participants of the study were informed of the sensors
capabilities and were present for the process of fitting
each sensor onto their respective wheelchairs. For all
testing sessions, 12 TPMS sensors were connected
via Bluetooth to the primary investigator’s
smartphone.
At the training camp, two sessions were
monitored over two consecutive days. These sessions
were run with the goal of simulating match scenarios.
The first session employed only the TPMS sensors
and served to finalise justification for the additional
application of IMUs. During the second session a
single IMU was attached to the wheelchair of each
participant, to measure impact forces. The IMUs were
synced to video recordings to enable correlation of
activities with the IMU data.
3.3 Data Extraction and Analysis
The data from phase 1 was analysed to uncover early
trends and streamline data collection methodology.
The temperature and pressure mean, standard
deviation, variance and correlation values were
calculated for all participants’ tyres. From phase 2,
the data collected was used to build temperature and
pressure profiles matched to the in-training IMU data.
These profiles were employed to keep track of the
number and intensity of direct impacts to the
wheelchairs, and to correlate any sharp changes in the
pressure or temperature. Plots for player classification
categories were created to visualise differences in
player preferences and the impact of classification on
the internal physical conditions of the tyres. The data
spread observed for the athlete was graphically
represented using the participants mean values as the
calibration point, with reference to which a new data
set was created to display the variation of each point
from the mean. Using box and whisker plots to
determine true outlier values from the TPMS error
range, the relevant IMU data was estimated. Which
was then analysed to uncover the impact of player
action associated with the outliers.
4 RESULTS
4.1 Phase 1
The mean ambient temperature during the sessions
was observed to be 25.0±1.9 °C. The ambient and
court temperatures displayed poor correlation
(r=0.313) with only 9.77% variance in court
temperatures. This indicated that the ambient
conditions had a small effect on the court surface,
A Preliminary Investigation into the Factors Impacting Tyre Failure in Wheelchair Basketball
95
likely due to the sessions being held in indoor
facilities with air conditioning. A larger effect would
be expected in outdoor testing.
The court surface temperature showed a negative
trend over the course of testing, as the courts cooled
down from the start to the end. The mean
temperatures at the different stages reflected this
trend with the start, 27.8±1.85C°, half-way,
27.4±1.74C°, and end, 27.16±1.46C°. This reduction
in court temperature over the duration of testing
sessions indicated that the heat dissipation due to the
friction between the tyres and surface was not large
enough to cause the surface temperature to increase.
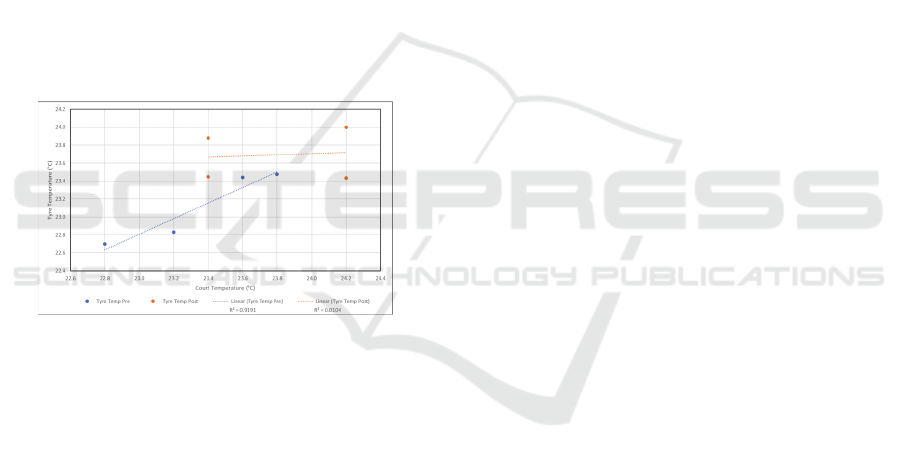
During testing carried out at games, a similar
trend was observed in the change observed between
quarters. The mean change observed for all
participants was -0.14±0.39°C. The correlation
(Figure 2) between the court and tyre temperatures
displayed a strong positive relation at the start of
games, but a weak correlation (r
2
=0.0104) for
readings taken post game. This was indicative that
game activities had a greater impact on tyre
temperatures as opposed to the court temperature.
Figure 2: Tyre Temperatures VS Court Surface
Temperatures during Games.
Pressure readings taken during a training session
showed an average reduction of 16.5±1.96 kPa, with
a mean starting tyre pressure of 524.1±68.5 kPa.
Pressure measurements taken on the game day also
displayed a reduction with a mean of 186.1±100.3
kPa, with participants using an average starting
pressure of 624.9±20.9 kPa. The large difference
between the starting pressures observed showed that
the athletes preferred to play games with higher tyre
pressure than trainings. This implies a greater
attention to detail with regards to wheelchair setup
exhibited by athletes for games. While the mass of the
chair is constant the mass of the athlete is variable,
hence each athlete inflates their tyres to self-selected
pressures to ensure proper tread contact and peak
performance, resulting in different athletes having
different starting tyre pressures. The larger reduction
in tyre pressure was indicative that in-game activities
had a greater impact on tyre pressure as opposed to
training activities. The trends observed in temperature
and pressure over the preliminary testing phase
indicated a non-significant impact on temperature but
a significant impact on inflation pressure due to WB
activities.
4.2 Phase 2
During the weekly training session used for the final
phase a max pressure difference of 12 kPa was
observed in one participant, with an average change
of 7.17±3.01 kPa. No significant impact of varying
starting pressures was observed across the
participants. Nine of the 12 tyres observed showed a
positive trend, displaying a small average increase in
pressure over the course of the training. The pressures
were observed to peak before the halfway mark where
max effort was put out by the athletes before
stabilising for the second half of training.
Temperature measurements followed trends
similar to those observed in the preliminary phase,
with tyres possessing higher temperatures at the start
of training, following the court temperature and then
going through a gradual reduction during the session.
A max deviation of 3°C and a mean of 1.58±0.99°C
was observed.
Over the first session at the training camp a max
individual change of 7 kPa, with a mean pressure
deviation of 4.08±1.4 kPa was observed. The shorter
observation time was seen as a possible cause for the
reduced deviation. The large standard deviation for
the weekly training was seen as an indication of the
impact of the individual athlete’s playstyle and
preferred equipment setup. Unlike the regular training
testing, all pressure profiles exhibited a negative
curve. This observation aligned with expectations for
the training camp, with more uniform player effort
and care for equipment exhibited by the athletes.
Temperature readings recorded during the first
session displayed a mean differential of 1.17±0.39°C.
With a maximum temperature drop of 2°C, the
profiles for all participants displayed a small negative
coefficient in line with observations earlier findings.
The data gathered at the second session of the
training camp gave a mean pressure differential of
8.00±3.6 kPa, with a max difference of 13 kPa.
Pressure profiles for all participants were observed to
have a positive coefficient. This positive relationship
was indicative of the impact of higher intensity
training with greater workload on the equipment in
match-like scenarios. The larger change also pointed
towards the likelihood of greater tyre wear occurring
in match situations as opposed to trainings.
Temperature profiles for 5 out of 6 participants
exhibited a negative profile, however no participant
finished the session with tyre temperatures higher
than those recorded at the start. With the overall peak
temperature at the start of training, temperatures were
icSPORTS 2022 - 10th International Conference on Sport Sciences Research and Technology Support
96
observed to reduce in the first half of the session with
a second peak observed in the second half of the
session which corresponded to full court practice
matches being played. A maximum deviation of 4°C,
and a mean deviation of 3.58±0.67°C was observed
for the session. The larger deviation when compared
to the regular training and the first session of the camp
provided further evidence that match scenarios
exerted greater load on the tyres.
4.2.1 Classification based Results
Three categories, low, middle, and high, were created
based of the participant pool to organise the data
based on WB player classification system. The
categories also served to provide insight into the
differences in impact of playstyles of athletes with
varying abilities.
The low category participant displayed a negative
coefficient for the left tyre but a positive coefficient
for the right. Over the course of the training session
both tyres initially gained pressure sharply and then
gradually lost pressure over the later three quarters of
the session. Temperature readings did not follow a
similar trajectory, but instead displayed a sharp
decrease followed by a slight increase and
stabilisation. A mean pressure variation of 5.5±3.5
kPa and a mean temperature change of 2.0±1.4°C was
observed.
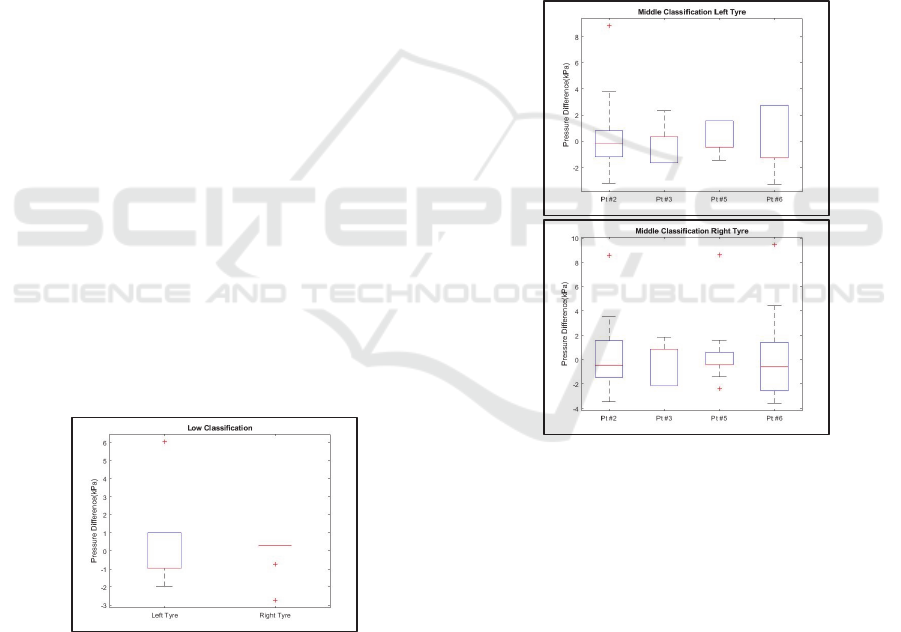
The outlier values seen in the box plots (Figure 3)
indicated the impact of training, resulting in greater
variations than those predicted based on the
preliminary testing. The outlier on the left tire
corresponded to a pressure value of 602 kPa observed
at the start of training. The outliers on the right tyre
corresponded to initial inflation pressure or were
within the error range of the instrumentation.
Figure 3: Low Classification Participant Pressure Variance
Left and Right Tyres.
All participants of the middle category displayed
a negative coefficient for their respective pressure
profiles. The average maximum pressure observed
over session 1 was 592.6±101.6 kPa and session 2
was 564.8±89.2 kPa. The higher pressure observed
during session 1 was due to greater variation in the
initial pressure preferences of the participants,
reflected in the larger standard deviation.
Maximum temperature deviation observed during
session 2 was 4°C, which exceeded the deviation
observed in session 1 (2°C). The temperature profiles
from both sessions followed the expected trends from
the findings in the preliminary phase.
Middle classification participants displayed a
total of 5 outliers (Figure 4), an incidence rate lower
(62.5%) to that observed for the low classification
category. However, the variance observed was larger,
with the more data exceeding the ±2 kPa error range.
The negative outlier for participant 5 displayed a
pressure difference of -2.3881 kPa with a
corresponding true pressure value of 431 kPa. The
significantly larger occurrence rate of outliers for
right tyres as opposed to left (×4) displayed a
developing trend in playstyle and player habits.
Figure 4: Middle Classification Participants Pressure
Variance Left (top) and Right (bottom) Tyres at Training
Camp Session 2.
The high category participants displayed negative
coefficients for their pressure profiles for session 1,
but a positive coefficient for session 2. The average
maximum pressure observed over session 1 was
496.3±105.2 kPa and session 2 was 533.8±106.8 kPa.
The greater pressure in session 2 was attributed to
player preferences for higher initial inflation pressure
for match scenarios.
Session 2 observed a larger temperature deviation
compared to session 1. The differences in magnitude
were like those observed for the Middle category.
Session 1 observed an initial increase to the
maximum observed temperature of 23°C followed by
a stepwise decrease over the course of training.
A Preliminary Investigation into the Factors Impacting Tyre Failure in Wheelchair Basketball
97
Session 2 started with a higher temperature, 26°C,
and then exhibited a sharp reduction to the minimum
temperature 22°C, followed by a slight increase.
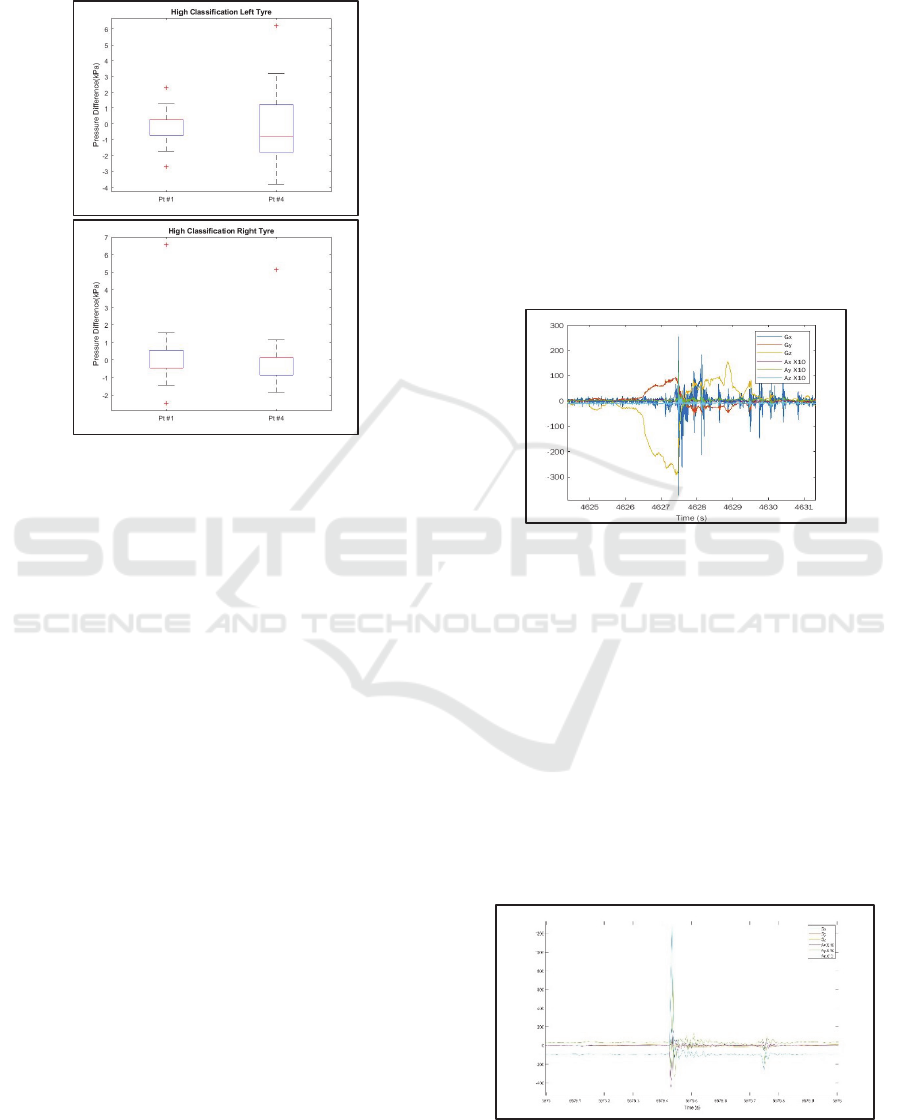
Figure 5: High Classification Participants Pressure
Variance Left (top) and Right (bottom) Tyres at Training
Camp session 2.
High classification participants displayed a high
rate of outlier occurrence (150%) and variance sizes
exceeding the accepted error range (Figure 5). With
increased trunk control and ability, it was observed at
trainings that high classification athletes were better
positioned to place themselves and their chairs in
extreme situations to extract the best possible
performance. Both negative outliers observed for
participant 1 corresponded to the chosen initial
inflation pressure by the participant. The largest
outlier, 6.5556 kPa, corresponded to a true pressure
of 484 kPa displaying an instantaneous change of 7
kPa, during a 3v3 half-court drill designed to simulate
condensed activity but lowered intensity match
scenario.
4.2.2 Outliers
Of all the outliers observed, two were deemed to be
of particular interest. Participant 6 displayed the
largest pressure differential of 9.4351 kPa from the
mean with a corresponding true pressure of 568 kPa.
The instantaneous pressure change was reported to be
10 kPa. During a half court scrimmage, participant 2
displayed a sharp increase of 4 kPa. The elevated
pressure was sustained for a period of 15 mins
followed by a drop of 2 kPa.
From the IMU data observed for these two
outliers along with video analysis, participant 2
(Figure 6) was observed to move in a short arc on the
court ending in a sudden stop with the athlete facing
90° out of phase from the direction of initial
movement. The change in direction was represented
clearly in the gyroscopic data with large, elongated
peaks displayed in the z and y axis of the data. These
peaks were followed closely with accelerometer
peaks along the y and z axes, displaying the
instantaneous deceleration. The max acceleration
observed was 15.9995 g along the y, and the
minimum acceleration observed was along the z-axis
at -14.7329 g. As the IMU was placed such that the y-
axis ran parallel to the player surface and in line with
the wheelchair axel representing forces experienced
from either side of the athlete, the acceleration can be
seen to cause a skidding motion increasing tyre
deformation and in-turn the likelihood of failure.
Figure 6: Participant 2 Outlier IMU Curve.
Participant 6’s outlier (Figure 7) was not captured
on video. The gyroscopic data displays very little
change through the incident. The triaxial system
displays an absolute maximum change not exceeding
200°/s, indicating that no large change in direction
occurred. However, the sharp peaks from the
gyroscope and the coinciding peaks from the
accelerometer hint that the athlete came to a sudden
stop or was impacted by another athlete. A maximum
acceleration of 12.98 g was observed along the z-axis,
closely followed by a slightly lower y max. Minimum
acceleration was seen along the x-axis indicating that
the force was imparted from the front of the
participant.
Figure 7: Participant 6 Outlier IMU Curve.
icSPORTS 2022 - 10th International Conference on Sport Sciences Research and Technology Support
98

5 DISCUSSION AND
CONCLUSION
Investigations into the various temperature modalities
provided evidence of the minimal impact of ambient
air temperature. Further, while it was observed that
court surface temperatures have a strong relationship
with initial tyre temperatures, there was little impact
on the temperature variations displayed over the
course of testing. The small negative change observed
in internal and tyre material temperature indicated
that the effort exerted by the players and the
interaction of the tyres with the court possessed a
significant but uniform impact on tyre wear. The
uniform negative trend eliminated temperature as one
of the major physical influences, leading to greater
emphasis on the influence of variable inflation
pressure as a source of the failures. An inconsistency
was observed in the initial inflation pressures
employed by the participants, as some were particular
about initial pressures prior to games to ensure
performance quality, and comfort. The inconsistency
in initial pressure, however, was not observed to have
a significant impact on the individual variations in
pressure. The overall trend of pressure reduction
confirmed the expected material interaction between
the tyres and the surface, with localised sharp changes
pointing towards the impact of gameplay.
Through the evidence gathered in the final testing
phase the importance of individual playstyle, physical
classification, and tendencies was highlighted. The
accelerometer and gyroscope data provided evidence
of the high g-forces experienced by the athletes and
the equipment drawing attention to the workload
placed on both.
Over the course of the preliminary and final phase
of testing the greater impact on equipment during the
match scenarios as opposed to regular training
sessions was confirmed. Through preliminary
findings it was suspected that player actions that
caused direct collisions to tyres or made the
wheelchairs move in unpredictable trajectories, such
as dragging sideways or tipping on to one wheel,
resulted in large forces being experienced and likely
to be a contributing factor in accelerated tyre
degradation. Insignificant differences were observed
for the pressure variations between classification
categories indicating a small influence of the
individual player classification on the pressure
variation. Anecdotal evidence gathered in
conversation with athletes and coaches indicated that
higher classification athletes and those with
aggressive playstyles experienced more tyre failures.
Through the combined analysis of participant
pressure profiles, IMU data, and match simulation
video recordings it was confirmed that athlete actions
held a large influence on tyre degradation and failure.
It was also noted that offence more than defence, and
athlete hand preferences effected the rate of failure
for individual tyres.
The outcomes from the study provide evidence
from varying tyre pressures to back anecdotal
knowledge of the tyre degradation patterns observed.
The findings allow athletes and coaches to make
better in-game and training decisions. Through the
multi-phased experimental methodology employed,
the investigators were able to build an argument for
increased enquiry into WB and other para sport
equipment reliability.
Several setbacks over the course of the research
period reduced the potential of the study. As the focus
of the study was to investigate the effects of player
actions on the physical properties, emphasis was laid
on testing to occur in real world environments. The
present study was unable to capture competitive
match data, focus on gathering such evidence would
be key to further the understanding of WB physics.
CAD models could be employed to simulate testing
and establish reference values of failure to inform
future work. The TPMS technology employed was
designed for non-scientific purposes, possessed low
resolution, and did not possess a standardised sample
rate. The use of more specialised sensors would allow
for better analysis and produce more informative
results. An increased number of SABEL Sense IMUs
employed on the wheels (following (Shepherd, Wada,
Rowlands, & James, 2016)) would allow for
measuring impacts in additional planes.
The study laid the groundwork for further targeted
investigations into inflation pressure and temperature
in competitive match situations. The influence of
match scenarios as opposed to training on the
degradation rate of the equipment forms the core of
the experimental study. The results discussed expand
the understanding of WB gameplay, and leave room
for future enquiry in to the sport and other parasport
modalities.
ACKNOWLEDGMENTS
The investigators would like to acknowledge the
contribution and support of Ms. Amanda Mather, Mr.
Nick Such, and Mr. Tom Kelly from Sporting
Wheelies and Disabled Association for providing
access to athletes, facilities, and insight into WB. I
would also like express my gratitude towards Mr.
Duncan Free and the office of Industry and External
Engagement at Griffith University for supporting this
study.
A Preliminary Investigation into the Factors Impacting Tyre Failure in Wheelchair Basketball
99

REFERENCES
BBB Digital Pressure Gauge. (n.d.). Retrieved from
https://www.99bikes.com.au/pressure-gauge-bbb-
digital
Bergamini, E., Morelli, F., Marchetti, F., Vannozzi, G.,
Polidori, L., Paradisi, F., . . . Delussu, A. S. (2015).
Wheelchair Propulsion biomechanics in Junior
Basketball Players: A Method for the Evaluation of the
Efficacy of a Specific Training Program. BioMed
Research International, 2015.
Boada, M., Lazaro, A., Villarino, R., Gil-Dolcet, E., &
Girbau, D. (2021). Battery-Less NFC Bicycle Tire
Pressure Sensor Based on a Force-Sensing Resistor.
IEEE Access, 9, 103975-103987.
Brandt, J. (1993). The Bicycle Wheel. Palo Alto: Avocet,
Inc.
Coutts, K. D. (1992). Dynamics of wheelchair basketball.
Medicine and Science in Sports and Exercise, 24(2),
231-234.
Espinosa, H. G., Lee, J., & James, D. A. (2015). The Inertial
Sensor: A base platform for wider adoption in sports
science applications. Journal of Fitness Research, 4(1),
13-20. Retrieved from https://sabellabs.com/sense/
Espinosa, H. G., Shepherd, J. B., Thiel, D. V., & Worsey,
M. T. (2019). Anytime, anywhere! Inertial sensor
monitor sports performance. IEEE Potentials, 38(3),
11-16.
Evans, M. S. (2002). Tyre Compounding for Improved
Performance. Frankfurt: iSmithers Rapra Publishing.
FIBA Central Board. (2020). Official Basketball Rules
2020: Basketball Equipment. Mies: FIBA.
Fluke Corporation. (n.d.). Mini Infrared Thermometer.
Retrieved from https://www.fluke.com/en-
au/product/temperature-measurement/ir-
thermometers/fluke-62-max
Fobo Tyre. (n.d.). Fobo Bike 2. (Fobo (Salutica Allied
Solutions)) Retrieved from
https://www.fobotyre.com.au/fobo-bike/
Fuss, F. K. (2012). Speed measurements in whellchair
sports-theory and application. Sports Technology, 5,
29-42.
IWBF Executive Council. (2020). Official Wheelchair
Basketball Rules 2021. Mies: International Wheelchair
Basketball Federation (IWBF).
Mason, B. S., Lemstra, M., van der Woude, L. H., Vegter,
R., & Goosey-Tolfrey, V. L. (2015). Influence of wheel
configuration on wheelchair basketball performance:
Wheel stiffness, tyre type and tyre orientation. Medical
Engineering and Physics, 37, 392-399.
Mason, B. S., Van der Woude, L. H., de Groot, S., &
Goosey-Tolfrey, V. L. (2011). Effects of Camber on the
Ergonomics of Propulsion in Wheelchair Athletes.
Medicine and Science in Sports and Exercise, 43(2),
319-326.
Molik, B., Laskin, J. J., Kosmol, A., Skucas, K., & Bida, U.
(2010). Relationship Between Functional Classification
Levels and Anaerobic Performance of Whellchair
Basketball Athletes. Research Quarterly for Exercise
and Sport, 81(1), 69-73.
Seron, B. B., de Carvalho, E. M., & Greguol, M. (2019).
Analysis of Physiological and Kinematic Demands of
Wheelchair Basketball Games - A Review. The Journal
of Strength and Conditioning Research, 33
(5), 1453-
1462.
Shepherd, J. B., James, D. A., Espinosa, H. G., Thiel, D. V.,
& Rowlands, D. D. (2018). A Literature Review
Informaing an Operational Guideline for Inertial Sensor
Propulsion Measurement in Wheelchair Court Sports.
Sports, 6(2), 34.
Shepherd, J. B., Wada, T., Rowlands, D., & James, D. A.
(2016). A Novel AHRS Inertial Sensor-Based
Algorithm for Wheelchair Propulsion Performance
Analysis. Algorithms, 9(3), 55.
icSPORTS 2022 - 10th International Conference on Sport Sciences Research and Technology Support
100
