
On using Authorization Traces to Support Role Mining with
Evolutionary Algorithms
Simon Anderer
1
, Alpay Sahin
1
, Bernd Scheuermann
1
and Sanaz Mostaghim
2
1
Faculty of Management Science and Engineering, Hochschule Karlsruhe, Moltkestrasse 30, Karlsruhe, Germany
2
Institute for Intelligent Cooperating Systems, Otto-von-Guericke Universit
¨
at, Magdeburg, Germany
Keywords:
Access Control, Role Mining, Real-world Data, Evolutionary Algorithm.
Abstract:
To protect the security of IT systems of companies and organizations, Role Based Access Control is a widely
used concept. The corresponding optimization problem, the Role Mining Problem, which consists of finding
an optimum set of roles based on a given assignment of permissions to users was shown to be NP-complete
and evolutionary algorithms have demonstrated to be a promising solution strategy. It is usually assumed that
the assignment of permissions to users, used for role mining, reflects exactly the permissions needed by a user
to perform the given tasks. However, considering enterprise resource planning systems (ERP) in real-world
use cases, permission-to-user assignments are often outdated or, if at all, only partially available. In contrast,
trace data, which records the behavior of users in ERP systems, is easily available. This paper describes and
analyzes the different data types and sources provided by ERP systems. Furthermore, it is examined, if this
data is suitable to create an initial permission-to-user assignment or to enhance the quality of a yet existing
one. For this purpose, different trace-data-based methods are introduced. In the context of an industry-related
research project, ERP data of two different companies is analyzed and used to evaluate the presented methods.
1 INTRODUCTION
The security of IT systems used by companies or or-
ganizations, in which multiple users share access to
common resources, are nowadays exposed to more
threats than ever before. On the one hand, they need
to be protected from external attacks, like malware
and phishing. On the other hand, internal threats,
like fraud or erroneous behavior of employees, cause
for huge financial damage and must be addressed ac-
cordingly (Verizon, 2019). A key to this is good au-
thorization management. Role Based Access Control
(RBAC) is a widely spread concept in this context. In-
stead of assigning permissions directly to users, per-
missions are grouped into roles, which are assigned
to users. This reduces complexity, while increasing
security comprehensibility and manageability.
There are two approaches to create role concepts
for RBAC: The top-down approach, which involves
an intensive analysis of company-specific business
processes and functional structures in order to divide
them into functional units and aggregate the corre-
sponding permissions into a role, is considered very
costly (Roeckle et al., 2000). Thus, more and more
researchers have become interested in the bottom-up
approach in recent years, as it can be automated, and
is therefore more cost-effective (Frank et al., 2010).
The bottom-up approach considers the identification
of good role concepts as mathematical optimization
problem, the so-called Role Mining Problem, which
was shown to be NP-complete (Vaidya et al., 2007),
such that it offers a rich use case for the application of
evolutionary algorithms. The goal of the bottom-up
approach is to define roles based on already known
assignments of permissions to users. It is clear that
a role concept, derived from the bottom-up approach,
can only be as good as the permission-to-user assign-
ment available allows it to be. In real-world business
use cases, permission-to-user assignments are often
outdated or, if at all, only partially available, which
accounts for a great necessity of methods to improve
their quality before role mining.
Enterprise resource planning systems (ERP) are
used to coordinate, plan and control operational pro-
duction factors in different business areas of an or-
ganization, which comprise, for example, materials,
capital, equipment or personnel. Therefore, ERP sys-
tems are deployed in nearly all major companies and
in various departments e.g. in finance and controlling,
in purchasing, sales, logistics, quality management
Anderer, S., Sahin, A., Scheuermann, B. and Mostaghim, S.
On using Authorization Traces to Support Role Mining with Evolutionary Algorithms.
DOI: 10.5220/0011539300003332
In Proceedings of the 14th International Joint Conference on Computational Intelligence (IJCCI 2022), pages 121-132
ISBN: 978-989-758-611-8; ISSN: 2184-3236
Copyright © 2023 by SCITEPRESS – Science and Technology Publications, Lda. Under CC license (CC BY-NC-ND 4.0)
121
or in human resources. In this paper, different ap-
proaches are introduced, which can be used to create
initial permission-to-user assignments or to enhance
the quality of a yet existing one. In particular, the
focus is on how trace data, which reflects a user’s be-
havior in an ERP system, and, if available, additional
information obtained from previously and currently
implemented role concepts can be exploited. In or-
der to make the methods compatible with real trace
data, it is essential to understand the structure of an
ERP system. Hence a broad description and analy-
sis of the different data types and sources provided by
ERP systems is given. Since SAP is the world leading
provider of enterprise software, the data model con-
sidered focuses on SAP ERP. Finally, the presented
methods are evaluated based on data taken from real-
world use cases.
2 ROLE MINING WITH
EVOLUTIONARY
ALGORITHMS
In this section, a definition of the Role Mining Prob-
lem (RMP) as binary matrix decomposition problem
is provided, based on (Vaidya et al., 2007). Further-
more, it is outlined, how evolutionary algorithms can
be applied as solution strategy for the RMP.
2.1 The Basic Role Mining Problem
For a given a set of users U = {u
1
,u
2
,...,u
M
}, a set
of permissions P = {p
1
, p
2
,..., p
N
} and a permission-
to-user assignment matrix UPA ∈ {0,1}
M×N
, where
UPA
i j
= 1 implies that permission p
j
is assigned to
user u
i
, search for a set of roles R = {r
1
,r
2
,..., r
K
}
a corresponding role-to-user assignment matrix UA ∈
{0,1}
M×K
and a permission-to-role assignment ma-
trix PA ∈ {0,1}
K×N
, such that each user has exactly
the set of permissions granted by UPA, while mini-
mizing the number of roles:
(
min |R|
s.t., UPA = UA ⊗ PA,
(1)
where the Boolean Matrix Multiplication operator ⊗
is defined as:
(UA ⊗ PA)
i j
=
K
_
l=1
(UA
il
∧ PA
l j
).
A role concept π :=
h
R
π
,UA
π
,PA
π
i
, consisting of
a set of roles R
π
, a role-to-user assignment UA
π
and
a permission-to-role assignment PA
π
denotes a possi-
ble solution to a given Basic RMP. If the constraint in
Equation (1) is satisfied, the corresponding role con-
cept is denoted 0-consistent.
2.2 Evolutionary Algorithms for the
Role Mining Problem
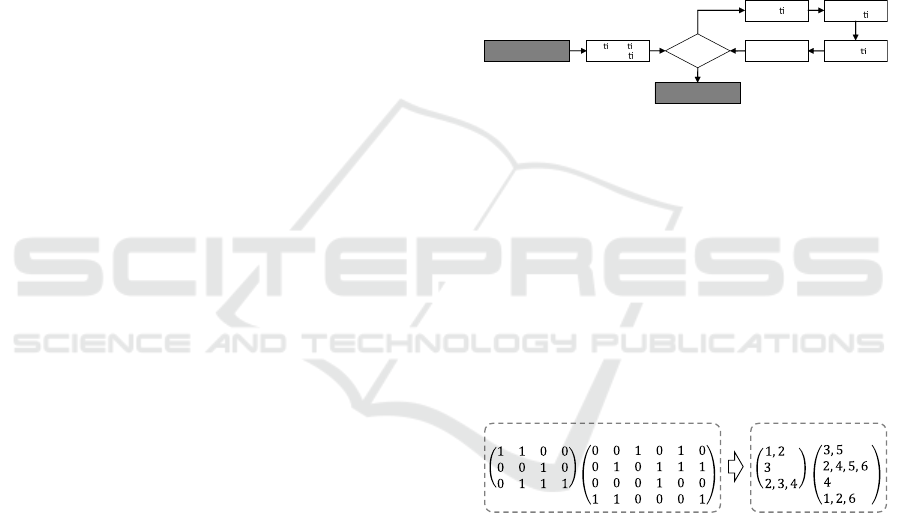
In recent years, evolutionary algorithms (EAs) have
demonstrated to be a promising solution strategy for
the RMP. A top-level description of a general evolu-
tionary algorithm is given in Figure 1. A more de-
tailed introduction to EAs is provided, for example,
in (Eiben et al., 2003).
Terminate?
Ini aliza on
& Evalua on
END
Selec on
Crossover
& Muta
on
Replacement Evalua on
Yes
No
START
Figure 1: Operating principle of evolutionary algorithm.
Analogous to the definition of a role concept in
Section 2.1, the chromosome of an individual com-
prises a UA and a PA matrix. The set of roles R can
be obtained from the rows of PA. At this, the num-
ber of columns in UA and the number of rows in PA
vary from individual to individual as both correspond
to the number of roles in an individual. Since U PA,
UA and PA are rather sparsely populated in practice,
binary sparse matrices can be used to represent UA
and PA in the chromosome of an individual in order
to save memory space, see Figure 2.
Individual Individual (sparse)
sparse
UA
UA
PA PA
sparse
Figure 2: Encoding of an exemplary individual.
An important differentiation criterion for EAs in
the context of role mining is compliance with the 0-
consistency constraint. The number of roles is to be
minimized, while every user should be assigned ex-
actly the permissions specified by UPA (Basic RMP).
In (Saenko and Kotenko, 2011), where EAs are used
as solution strategy for role mining for the first time,
standard crossover and mutation methods, such as
one-point crossover and bit-flip mutation, are applied
to the individuals. However, in most cases, this re-
sults in deviations between the targeted U PA matrix
and the actual assignment of permissions to users en-
coded in an individual. Also in (Du and Chang, 2014),
where one-point crossover and bit-flip mutation are
ECTA 2022 - 14th International Conference on Evolutionary Computation Theory and Applications
122

used as well, the 0-consistency constraint is violated,
such that this approach does not comply with the Ba-
sic RMP. A different approach is used in (Anderer
et al., 2020). Here, crossover is conducted by the ex-
change of roles between individuals. For mutation,
a new role is added to the individuals in each step
of the evolutionary loop. A special feature of their
so called addRole-EA is that new roles can always be
assigned to at least one user without causing for de-
viations. By the subsequent deletion of roles, which
are no longer needed, the total number of roles of an
individual can be gradually minimized. Because of
its compliance with the 0-consistency constraint, this
approach is well-suited for the Basic RMP.
In addition to evolutionary algorithms, there are
further solution strategies for the RMP. A broad
overview on these is provided in (Mitra et al., 2016).
3 RELEVANCE OF UPA
PRE-PROCESSING
It is natural that the quality of role concepts ob-
tained from the application of evolutionary algorithms
strongly depends on the quality of the input data, i.e.
in particular on the quality of the considered UPA ma-
trix. On the one hand, users are usually assigned far
more permissions by the role concept than needed,
resulting in so-called Type I errors (false positives;
users are assigned unneeded permissions). On the
other hand, if a user is not assigned a needed permis-
sion by UPA, he or she will not be assigned this per-
mission by any of the role concepts after the role min-
ing process is completed, resulting in Type II errors
(false negatives: users lack needed permissions). Fig-
ure 3 shows the relationship of permissions assigned
by the role concept, permissions needed and permis-
sions used. Evidently, the permissions used are a sub-
set of the permissions assigned. However, there are
also permissions used which are not needed. These
can result, for example, from individual approaches
to the same task by different users.
Permissions assigned (by role concept)
Permissions needed
Permissions used
Type I Errors (false posi ves)
Type II Errors (false nega ves)
Figure 3: Permissions assigned, needed and used.
One approach to tackle Type I and Type II errors
consists of relaxing the 0-consistency constraint to al-
low for deviations between the targeted UPA matrix
and the actual assignment of permissions to users ob-
tained from a role concept, such that users might be
assigned permissions, which are needed but not as-
signed by UPA, automatically. Solution approaches
for such variants of the RMP are for example pre-
sented in (Vaidya et al., 2007; Lu et al., 2008; Vaidya
et al., 2010). However, relaxing the 0-consistency
constraint, it is equally possible that users are as-
signed additional permissions, which are not needed
(Type I errors), whereas needed permissions remain
uncovered (Type II errors). Therefore, an alternative
approach, which does not necessarily exclude the tol-
erance of deviations, is to improve the quality of UPA
prior to role mining. For this purpose, the concept
of RBAC Applicability Noise, which states that only
around 80% of all assignments in U PA need to be
covered by roles, whereas 20% are exceptions, which
do not correspond to errors, but still may not be con-
sidered in the role mining process is introduced in
(Molloy et al., 2010). At this, matrix decomposition
approaches are applied to handle noisy data and im-
prove its quality. In (Frank et al., 2008) and (Frank
et al., 2009) the usage of stochastic models as well as
the inclusion of business attributes is proposed to deal
with noise in role mining.
An advantage of ERP systems, which has not yet
been explored in literature, is the availability of trace
data. Since trace data describes the behavior of users
in the ERP system, it seems natural to include it into
the process of improving U PA quality. Thus, in the
following, different ERP data types and sources rel-
evant in this context are described. Based on this,
different methods to improve the quality of U PA are
presented and evaluated.
4 AUTHORIZATION
MANAGEMENT IN ERP
SYSTEMS
In this section, the main elements of authorization
management in SAP ERP, relevant to role mining,
are introduced. The information presented originates
primarily from (Lehnert et al., 2016), which pro-
vides a very detailed overview of SAP’s access con-
trol model. In order to work with the SAP ERP sys-
tem, a user is provided a user account with unique
user ID and password, with which he or she must first
log on to the system. The logon information as well as
other user-specific information, such as company as-
signment or job title, are maintained in the user mas-
ter record. The uniquely identifiable user ID is essen-
tial for the security and regularity of the system, since
all recordings of system accesses (so-called traces) as
On using Authorization Traces to Support Role Mining with Evolutionary Algorithms
123

well as all change documents refer to it. In order to be
able to perform actions in the system, a user requires
permissions, which are assigned to him or her via
roles. A special feature of SAP’s ERP is that it pro-
vides two levels of roles: so-called single roles, which
represent rather small job functions in an organiza-
tion, and composite roles, which correspond to large
job functions or business processes. The two-level
structure of role concepts for SAP ERP, of course, has
an impact on the role mining process. However, this
does not affect the initial creation of permission-to-
user assignments, such that it will not be discussed in
more detail. An analysis of the impact of the consid-
eration of two-level role concepts for role mining and
the corresponding adaption of EAs for two-level role
mining can be found in (Anderer et al., 2022).
4.1 Objects and Permissions
As it is common in access control, a permission in
SAP ERP corresponds to the authorization to perform
an operation on an object. However, the operations
to be applied to an object are specified in more de-
tail in SAP ERP. To describe an operation in SAP
ERP, a two-level structure is used, which comprises
fields and corresponding field values. A permission
can contain up to 10 fields, each of which can contain
one or more field values. The general structure of a
permission in SAP ERP is illustrated in Figure 4.
OBJ
N1 N2 N3
V1 V2
V3
Permission
Field
Name
Field
Value
Object
Figure 4: Specification of permissions in SAP ERP.
The fields of an object can be divided into functional
and organizational fields. Organizational fields con-
tain for example information on cost centers and com-
pany codes, which constitute the smallest units of a
company and are used for reporting purposes. Func-
tional fields, on the other hand, have a more opera-
tional character, which is reflected in the correspond-
ing field values such as add/create, change, delete,
etc. Figure 5 shows an exemplary permission based
on the object F BKPF BUK, which supports the def-
inition of company code-related permissions in ac-
counting documents.
It contains a functional field ACTVT (activity)
and an organizational field BUKRS (company
code). The field values of this permission spec-
ify that members of the company code 1000
F_BKPF_BUK|ACTVT:[01]|BUKRS:[1000]
Permission
Object
F_BKPF_BUK|ACTVT|BUKRS
Dimension
Figure 5: Exemplary permission F BKPF BUK.
(BUKRS:[1000]) are allowed to create accounting
documents (ACTVT:[01]). One approach, which will
be revisited in Section 6, consists in disregarding the
values of fields in permissions. The resulting combi-
nation of an object and its fields (without field values)
will be referred to as dimension of a permission as
illustrated in Figure 5.
The values of a field can either be single val-
ues, contain ranges or wildcards or a combination of
those. In particular, wildcards are a suitable means
of assigning permissions to users, whose associated
field values are not known in advance. An example
of this is the object S DATASET. It provides permis-
sions to access specific files and includes, among oth-
ers, the fields FILENAME for the file to be opened
(including the associated filepath) and ACTVT spec-
ifying the permitted activities like display, change or
delete. Since filenames and paths are very variable,
the field FILENAME mostly contains a wildcard. Ta-
ble 1 shows the different possibilities to define values
or value ranges.
Table 1: Different variants to define field values.
Value Interpretation
V 1 One single value: V 1
V 2...V 3 Range: all values beteeen V 2 and V 3.
∗ Wildcard: any value.
V 4...∗ Combination: any value greater or equal V 4.
4.2 Transactions
In SAP ERP, a business activity is performed by ex-
ecuting so-called transactions. This means that busi-
ness processes can be mapped to a series of transac-
tions within the ERP system. In literature, transac-
tions are often referred to as functions of SAP ERP,
which can be executed by users. They are uniquely
referenced using a transaction code (TCD) and are as-
signed to the specific components of SAP ERP, like
Materials Management, Financial Accounting or Per-
sonnel Management. Transactions are characterized
by the object S TCODE with exactly one associated
field TCD. Transactions therefore represent a subset
of permissions.
The value of the TCD field determines whether a user
can call a specific transaction. The transaction in Fig-
ECTA 2022 - 14th International Conference on Evolutionary Computation Theory and Applications
124

S_TCODE|TCD:[FB02]
Transac on Code
Object
Figure 6: Transaction (Example).
ure 6 contains transaction code FB02 that belongs
to the Financial Accounting component. The value
FB02 in the TCD field refers to Change Document.
Therefore, in order to change a document, a user re-
quires exactly this transaction. If this is not the case,
the user is not granted access to the requested func-
tion call. Transaction codes thus play a key role in
determining the range of functions available to users
in SAP ERP. However, they do not determine the ex-
tent to which a function can be used. This is deter-
mined by subsequently requested permissions. Due
to their relationship to SAP components, transactions
have special status in SAP ERP. This is exploited in
Section 6 to evaluate the similarity of users.
4.3 Authority Checks and Traces
To determine the legitimacy of a user to perform an
operation on an object, it is verified whether he or
she is assigned the corresponding permission. In SAP
ERP, this process is called authority check. In case of
verification, the user may proceed. In case the author-
ity check results negative, access is denied.
In Section 4.1, permissions were introduced the
way they are assigned to users via roles, possibly con-
taining ranges or wildcards. In the case of an author-
ity check, permissions with single values are queried.
The authority check thus compares two types of per-
missions: on the one hand, the permission assigned to
the user via roles, which can contain ranges and wild-
cards, and on the other hand, the permission that is to
be authenticated, which contains only single values.
The authority check proceeds as follows: For a given
permission requested by a user p
req
, it is checked,
whether this user is assigned a permission p
asg
con-
taining the same object and also the same fields by
the implemented role concept. If this is the case, the
field values of the individual fields are compared se-
quentially. Figure 7, shows an example of an author-
ity check.
Field
Name
Field
Value
Object
OBJ
N1 N2 N3
V1 V2
V3
OBJ
N1 N2 N3
V1
V2…V3
*
Field
Name
Field
Value
Object
Requested Permission
Assigned Permission
g
Figure 7: Example of a successful authority check.
In this example, p
req
and p
asg
refer to the same per-
mission object OBJ. Furthermore, both check for the
same fields N1-N3. Thus, the values of the fields of
p
req
and p
asg
can be compared sequentially. The value
V 1 in the first field N1 matches on both sides. In the
second field N2 of p
req
, the value V 2 is requested,
which is included in the range contained in N2 of p
asg
.
Since N3 contains a wildcard in p
asg
, the value in N3
of p
req
does not matter. The required fields and values
of p
req
are therefore all covered by p
asg
, such that the
authority check is successful and access is granted.
In SAP ERP, there is a possibility to document
the authority checks performed, the so-called trace-
function. At this, a trace contains information on
which user triggered which authority check (includ-
ing information on object, fields and values) at what
time. Furthermore, it contains a return code RC,
which indicates if the authority check was successful.
The standard trace documentation fully documents all
authority checks and creates a separate entry for each
access date, which quickly leads to a need for large
amounts of memory space. The duplicate-free trace
documentation on the contrary, overwrites an existing
trace if the same authority check (same user and per-
mission) was already performed before. In this case,
the date of the trace is updated with the last access
date, saving a considerable amount of memory space.
In practice, the trace function is, for example, used
by consultants, who optimize existing role concepts
according to the principle of least privilege. The anal-
ysis of trace data reveals which permissions are actu-
ally used. Unnecessary permissions can be revoked
from the users or the corresponding roles. It is natu-
ral that users also access functions in SAP ERP that
they do not need to perform their work as long as they
are assigned the corresponding permissions. This is
also recorded in trace data, resulting in Type I errors.
However, this paper aims at presenting methods that
intend to assign needed but missing permissions to
users in order to counteract Type II errors, such that
this effect is disregarded and trace data is used as basis
for creating a permission-to-user-assignment U PA.
5 USE CASE DATA
Within the research project AutoBer
1
, role mining in
ERP systems using evolutionary algorithms is inves-
tigated. An important finding here is that around 90%
of all users in ERP systems are assigned too many
permissions by the implemented role concept. This
results in a large number of Type I errors, which
clearly contradicts the principle of least privilege.
1
Supported by the German Ministry of Education and
Research under grant number 16KIS1000.
On using Authorization Traces to Support Role Mining with Evolutionary Algorithms
125

Thus, ideally, permissions would only be assigned to
users, if they are actually needed. On the other hand,
since the permission-to-user assignment UPA repre-
sents the starting point of role mining, it is necessary,
that UPA completely covers the permissions needed
by users, in order to avoid Type II errors in the role
concepts resulting from role mining. If UPA does not
fully cover the permission needs of the users, the sub-
sequently calculated role concept will not fully cover
those needs either, which leads to the necessity of
readjusting the created roles and thus additional effort
and unnecessary costs.
5.1 Trace Data
To investigate the quality of user-permission assign-
ments, real data sets of two companies were used. The
data sets include the duplicate-free trace documenta-
tion as well as the role concept used by the respective
company. First, the trace data is presented in more de-
tail. The most important key figures are displayed in
Table 2. At this, traces
+
is defined as the set of traces
resulting from successful authority checks.
Table 2: Key figures of trace data sets.
Comp. A Comp. B
Number of users 824 6,289
Number of traces 633,102 34,176,166
Number of traces
+
427,973 30,911,178
Percentage share 67.60% 90.44%
It is important to note that the data sets differ consid-
erably in size which is due to the big difference con-
sidering the duration of the trace documentation pe-
riods. For Company A traces were documented only
a few days (2016/11/23 and 2019/12/06-2020/01/16),
whereas for Company B, traces were documented for
more than 3 years (2015/08/06-2019/11/23). One
question that needs to be answered, therefore, is the
role of the duration of the trace documentation period.
In addition, in Company A, the number of users, for
which traces were documented, was limited by 824,
since trace documentation was only activated for a
few departments. In Company B, traces were docu-
mented for all 6,289 users of the company.
Based on the available trace data, a permission-
to-user assignment matrix, which will be denoted
UPA
T
+
, can be obtained in a straight forward fashion.
Each user, for whom traces were documented, corre-
sponds to a row of UPA
T
+
. The columns of UPA
T
+
result from all successfully checked permissions of
the ERP system of the respective company. If, within
the trace documentation period, a successful authority
check for user u
i
and permission p
j
was performed,
the corresponding matrix element (UPA
T
+
)
i j
is set to
1, else (UPA
T
+
)
i j
= 0. Even if there is no role con-
cept implemented at a company, traces can be docu-
mented. In this case, users are given all permissions
for a limited period of time. In SAP ERP, this could
potentially be achieved by temporarily assigning the
SAP ALL profile to the users. Under the premise that
users only use permissions related to the tasks of their
work, it is possible to record meaningful traces, which
serve as important source of information to generate
an initial role concept.
By using the time stamps in the trace data, an em-
pirical distribution function can be determined. Fig-
ure 8 shows the progression of successful authority
checks over time grouped by day for Company A.
There is a longer period of time in which there are
almost no traces, which means that users hardly used
any new permissions. On closer examination, it be-
comes evident that this period coincides with the time
between Christmas 2019 and the beginning of the new
year 2020, where normally not much work is done.
The smaller periods of inactivity can be explained by
the fact that they coincide with weekends.
0
10000
20000
30000
40000
2019-12-06
2019-12-11
2019-12-16
2019-12-21
2019-12-26
2019-12-31
2020-01-05
2020-01-10
2020-01-15
Figure 8: Progression of successful authority checks over
time for Company A.
Figure 9 shows the progression over time of the
traces for Company B. Since the trace documentation
period was considerably longer, traces are grouped by
month. Even though a user uses around 3 new permis-
sions per day averaged over the entire trace documen-
tation period, Figure 9 shows that the access to new
permissions is not equally distributed.
Jan
2016
Jan
2017
Jan
2018
Jan
2019
10
6
2 ⋅ 10
6
0
Figure 9: Progression of successful authority checks over
time for Company B.
If the field values are disregarded and only the per-
mission dimensions accessed by the users and the cor-
responding fields are considered, this becomes even
ECTA 2022 - 14th International Conference on Evolutionary Computation Theory and Applications
126

more apparent. In particular, it can be seen that the
majority of new permissions were recorded within the
last months of the trace documentation period.
To gain a deeper understanding of the trace data,
the distribution of traces across different objects was
examined for Company B. It turned out that more
than 90% of the generated traces are allocated to only
a few objects (K ORDER, K CCA, K USER AGR,
K REPO CCA, K PCA, K DATASET, K ORGIN,
K S DEVELOP, K USER PRO, K TRAVL). One ex-
planation for this is that all of these objects include a
field containing a wildcard in the role concept, such
that a new entry is created in the trace data each time
an authority check is performed including an hitherto
unchecked field value in this field. Since these objects
constitute a large part of the trace data, it is examined
if it is worthwhile to consider these traces indepen-
dently of the remaining trace data in Section 7.
5.2 Role Concept Data
In addition to trace data, Company A and Company B
also provided data on the implemented role concept.
In order to make information on the permission-to-
user assignment embedded in the role concept U PA
RC
available, the underlying role structure was dissolved.
Based on that, Table 3 shows basic key figures of the
role concepts of both companies, where kU PA
RC
k
1
denotes the number of permission-to-user assign-
ments included in UPA
RC
.
Table 3: Key figures of role concepts.
Comp. A Comp. B
Number of users 4,261 6,241
kUPA
RC
k
1
41,434,811 162,418,710
Permissions per user 519 4,915
Table 3 suggests that the average number of permis-
sions per user is significantly lower at Company A
than at Company B. However, this does not necessar-
ily mean that an average user of Company A is actu-
ally assigned fewer permissions than a user of Com-
pany B. This is due to the fact that the field value en-
tries of permissions may contain ranges or wildcards
in the role concept. The determination of all possible
discrete field values within a range can be carried out
with the help of SAP tables in the respective SAP sys-
tem of the company under investigation. The transfor-
mation of a wildcard into discrete values is not always
trivial. An example of this are filenames and -paths of
files. This theoretically infinite set is not known in
advance. Hence, an a priori resolution into discrete
permissions is not possible, which is why a wildcard
is an elegant solution to address this. The values in
Table 3 therefore only represent a lower bound for the
number of permissions assigned to a user, but still al-
low for further analysis. For this purpose, at first the
intersection U
T
+
∩U of the set of users U
T
+
in trace
data and the set of users U in role concept data must
be determined, due to the duration of the trace docu-
mentation period. Table 4 shows the remaining data
after intersection at user level. As the number of users
is reduced, the size of trace data also decreases. This
is reflected in |traces
+
int
|, which represents the number
of traces recorded for the users in U
T
+
∩U. The same
is valid for the number of permissions |UPA
RC,int
| as-
signed to U
T
+
∩U by the role concept.
Table 4: Key figures of data after intersection.
Comp. A Comp. B
|U
T
+
∩U | 814 4,191
|traces
+
int
| 424,150 24,589,087
|UPA
RC,int
| 36,116,695 149,339,751
On the one hand, it is possible that users have left
the company during the trace documentation period.
In this case, there is trace data associated to users,
which are no longer part of the role concept data. On
the other hand, assignments of permissions to users
in the role concept may also have changed in the
course of the trace documentation period. Therefore,
in some cases, trace data may suggest that a user has
accessed objects, for which the corresponding permis-
sion was later taken from the user. It becomes ev-
ident that users only use a fraction of their permis-
sions assigned. The number of permission-to user as-
signments obtained from the role concept is about 6
times greater than the number of successful traces for
Company B and more than 80 times greater for Com-
pany A. This is again due to the shorter duration of the
trace documentation period for Company A. If it was
possible to transform all permissions, which are rep-
resented with the help of ranges and wildcards, into
discrete values, a new comparison would lead to an
even higher discrepancy. This underlines the fact that
most users only use a small part of the assigned per-
missions as previously indicated. Hence, it follows
that the optimal assignment of permissions to users
is somewhere between U PA
T
+
and UPA
RC
. In some
companies, e.g. in the case of the introduction of
new ERP software, no role concept is available. In
such cases, different methods to enhance trace data
are needed to obtain an initial permission-to-user as-
signment for role concept creation, see Section 6.
On using Authorization Traces to Support Role Mining with Evolutionary Algorithms
127

5.3 Compliance Data
Whenever additional permissions are assigned to
users by editing UPA to obtain a higher-quality as-
signment of permissions to users, security risks can
emerge. A user may obtain permission combina-
tions that allow him or her to intentionally or uninten-
tionally cause harm. Such combinations are referred
to as SoD-conflicts. A formal model of such SoD-
conflicts is given in (Anderer et al., 2021). For a set
of L SoD-conflicts, an additional compliance matrix
C ∈ {0,1}
L×N
is introduced, where each row repre-
sents an SoD-conflict and C
l j
= 1 implies, that the l-
th SoD-conflict contains permission p
j
. Furthermore,
a weight vector w ∈ R
L
is introduced to assess the
severity of SoD-conflicts. The SoD-conflicts of the
users, embedded in a role concept π, can then be ag-
gregated in a matrix δ(π) ∈ {0,1}
M×L
, which is de-
fined as follows:
δ
il
(π) :=
(
1,if
∑
n
j=1
DU PA(π)
i j
·C
l j
=
∑
n
j=1
C
l j
0,else,
where, the i-th row of δ(π) represents the SoD-
conflicts of user u
i
. Based on this, the so-called
compliance score CS(π) of a role concept π can be
calculated by weighting and accumulating the SoD-
conflicts of all users: CS(π) := (δ(π)·w)
T
·1I
L
, where
1I
L
:= (1, ...,1)
T
is the L-dimensional all-ones vector.
One of the partners involved in the AutoBer
project, SIVIS GmbH (https://www.sivis.com/), is
highly specialized in compliance related problems
and was able to provide a comprehensive set of SoD-
conflicts. These are used to assess the security of their
customers’ ERP systems and are available as com-
pliance matrix C, containing around 850,000 rows,
each representing an SoD-conflict. In addition, each
conflict is assigned a weight representing its severity,
such that a weight vector w can easily be derived. At
this, each SoD-conflict includes up to 10 objects and
associated field values. A large part of the conflicts
in C (more than 95%) comprises between 5 and 8 ob-
jects. In rare cases, individual objects can also cause
for an SoD-conflict. For example, if a user is assigned
the STCODE object containing a wildcard in the TCD
field, he or she can call all transactions and thus ac-
cess all functions of the ERP system.
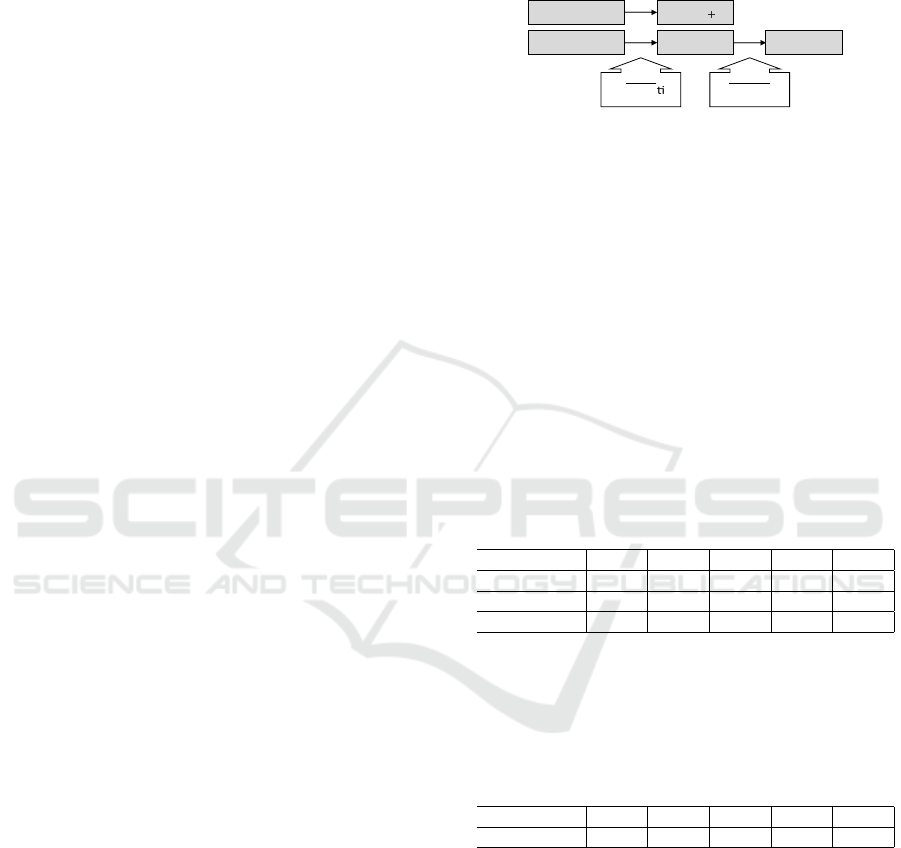
6 TRACE CONVERSION
PROCEDURE
In order to convert trace data into useful permission-
to-user assignments for role concept creation, a three-
step procedure is applied as shown in Figure 10.
In step 1, trace data is transformed into an initial
permission-to-user-assignment UPA
T
+
as described
in Section 5.1. The optimal set of permissions for
a user ranges between the permissions obtained di-
rectly from trace data and the permissions assigned
to the user by the role concept (if available). Hence,
apart from the permissions obtained from UPA
T
+
, the
user must be assigned further permissions, to reduce
Type II errors in UPA
T
+
. For this purpose, users with
similar trace data, which indicates similar user be-
havior and thus similar tasks and responsibilities, are
grouped into clusters in step 2. As a result, a clustered
permission-to-user assignment UPA
C
is obtained. In
step 3, permissions are exchanged among the users of
a cluster. In order to prevent the possible emergence
of new SoD-conflicts from the assignment of addi-
tional permissions to users, compliance data or data
based on an existing role concept, if available, will be
consulted, which can provide additional value.
Step 3
Exchange of
Permissions
Trace Data
Step 1
Transforma on
of Trace Data
Step 2
Clustering of
Users
∗
Figure 10: Trace conversion procedure.
The final output is a suitable permission-to-user as-
signment U PA
∗
which can serve as basis for role con-
cept creation using evolutionary algorithms. The inte-
gration of the trace conversion procedure into an evo-
lutionary algorithm is shown in Figure 11.
Terminate?
Ini aliza on
& Evalua on
Trace Conversion
Procedure
Trace Data UPA*
END
Selec on
Crossover
& Muta
on
Replacement Evalua on
Yes
No
START
Figure 11: Integration of trace conversion procedure into an
evolutionary algorithm.
6.1 Clustering of Users
In this section, two well-known approaches are pre-
sented to group users into clusters: Agglomerative
Clustering and Basic Mean Shift Clustering. The ad-
vantage of both methods is that the number of clusters
does not have to be known a priori, which corresponds
to the requirements of the role mining use case. While
Basic Mean Shift Clustering exploits the direct re-
lationship between transactions and components in
SAP ERP and therefore only works at TCD level,
Agglomerative Clustering can be applied at permis-
sion and permission dimension level as well. Since its
methodology can be transferred in a straight-forward
ECTA 2022 - 14th International Conference on Evolutionary Computation Theory and Applications
128

fashion, it is explained at permission level only:
6.1.1 Agglomerative Clustering (C1)
In Agglomerative Clustering, users are clustered
based on their distance. The distance of two users
u
i
and u
j
can be defined as d(u
i
,u
j
) := 1 − J(u
i
,u
j
),
where J(u
i
,u
j
) denotes the Jaccard-coefficient (Jac-
card, 1901) and is obtained from the rows of UPA
T
+
corresponding to users u
i
and u
j
:
J(u
i
,u
j
) :=
∑
N
l=1
(U PA
T
+
)
il
· (UPA
T
+
)
jl
∑
N
l=1
max
(U PA
T
+
)
il
,(UPA
T
+
)
jl
.
The distance between two clusters
ˆ
C and
ˇ
C is now
defined by the maximum/complete linkage criterion
as the maximum distance between two users from the
respective clusters:
d(
ˆ
C,
ˇ
C) := max
ˆu∈
ˆ
C, ˇu∈
ˇ
C
{
d( ˆu, ˇu)
}
.
Based on this, the clustering algorithm proceeds as
follows: Initially, each user forms a separate clus-
ter. Now, iteratively the clusters are merged, which
have the smallest distance. To prevent all original
clusters from merging into a single cluster, an addi-
tional threshold d
max
needs to be specified. Clusters
that have a distance higher than the threshold are not
merged. If there are no more pairs of clusters whose
distance is smaller or equal d
max
, the algorithm termi-
nates. A more detailed introduction to agglomerative
clustering is provided in (Landau et al., 2011).
6.1.2 Basic Mean-shift Clustering (C2)
As described in Section 4.2, each transaction code can
be assigned to one of the around 25 components of
SAP ERP. Due to the different structures and busi-
ness areas, companies usually only use an individu-
ally adapted subset of these components. For a com-
pany, whose SAP ERP system comprises n compo-
nents, it is possible to calculate the distribution of
activities among the individual components for each
user, such that a user can be represented by a point
in [0,1]
n
, using the T-codes documented in trace data.
The coordinates of the point result from the percent-
age shares corresponding to the distribution of his ac-
tivities among the different components, as illustrated
exemplarily in Figure 12.
Based on this, users can now be clustered us-
ing Basic-Mean Shift Clustering (Fukunaga and
Hostetler, 1975). For this purpose, each point is ini-
tially defined as center of a circular cluster based on a
predetermined radius r
max
∈ (0,1). If one of the ini-
tial clusters contains another point, the corresponding
User u User u
Materials Management
Financial Accoun
ng
Personnel Management
User u : (0.8, 0.2, 0)
User u : (0.1, 0.4, 0.5)
i
j
j
i
Figure 12: Examplary distribution of activities among SAP
components for two users.
clusters are replaced by a new circular cluster with the
same radius r
max
, where the center of the new clus-
ter is defined by the mean of all points contained. If
thereafter, the new cluster contains new points, this
step is repeated. If this is not the case, the cluster can-
not be shifted further, which means that the algorithm
is terminated for this cluster.
6.2 Exchange of Permissions
After the users have been distributed to different clus-
ters, this information can now be used to assign ad-
ditional permissions. It is assumed that all users in
a cluster have similar tasks and therefore need simi-
lar permissions. For the exchange of permissions, a
distinction is made between two different cases:
6.2.1 No Role Concept Data Available -
Permission Exchange (E1)
In this case, no additional information can be obtained
from a role concept. Therefore, the exchange of per-
missions is based on information included in trace
data and the user clusters that were obtained from
the presented clustering approaches. Another data
source that requires consideration for permission ex-
change is compliance data. If additional permissions
are assigned to users during permission exchange,
this should not result in any additional SoD-conflicts.
Based on this, the exchange in (E1) is performed in
three steps: At first, each user is assigned the permis-
sions, which are assigned to him or her by UPA
T
+
.
In the second step for each cluster C
i
, the union P
i
of
permissions, which are assigned to at least one of the
users of C
i
, is formed. Subsequently, for each conflict
in the compliance matrix, it is checked whether it is
included in P
i
. If this is the case, the corresponding
permissions are removed from P
i
. In the third step,
the resulting set P
i
, free of SoD-conflicts, is assigned
to all users of cluster C
i
. On the one hand, this ensures
that each user is assigned the needed permissions ac-
cording to his or her trace data. On the other hand, re-
moving the problematic permissions from P
i
ensures
that no new SoD-conflicts emerge.
On using Authorization Traces to Support Role Mining with Evolutionary Algorithms
129
6.2.2 Role Concept Data Available - Transaction
and Dimension Exchange (E2)
In this approach, it is assumed that a role concept is al-
ready available. The basic idea is again to assign simi-
lar permissions to all users of one cluster. Due to their
special role in SAP ERP, transactions are considered
first. A user is assigned each transaction contained in
the union of transactions of all users of the same clus-
ter C
i
. Subsequently, all transactions, which are not
assigned to the considered user in the role concept, are
revoked. In this way, the user is only assigned those
transactions, which are assigned to at least one of the
users of C
i
, but which are covered by the role con-
cept at the same time. This automatically prevents the
user from receiving additional SoD-conflicts, which
makes a SoD-validation using the compliance matrix
unnecessary. In a second step, the same procedure is
now repeated for each further permission dimension,
where all dimensions, that are assigned to at least one
user in C
i
, are assigned to the user. Subsequently, all
dimensions, which are not assigned to the user in the
role concept, are revoked. Finally, the field values of
the remaining dimensions are obtained from the field
values of the users’ permission-to-user assignments in
the role concept. This step converts dimensions back
to permissions and provides the advantage that ranges
and wildcards can also be taken into account. Again,
new SoD-conflicts cannot emerge, due to the consid-
eration of the role concept data.
7 EVALUATION
In this section, the presented methods are evaluated.
Since the data provided by company A only covers
a very short trace documentation period, the evalu-
ation is performed on the trace data of company B.
For this purpose, the existing traces are divided into
two groups. Traces data recorded in the last three
months (3M) of the trace documentation period (Nov
2018, Dec 2018, and Jan 2019) are used to derive a
permission-to-user assignment UPA
3M
T
+
, which is used
as a basis to group users applying the presented clus-
ter algorithms (C1-2) and to exchange permissions
within clusters (E1-2) resulting in UPA
∗
. This is then
compared with the set of trace data recorded from Feb
2018 to Jan 2019 and the corresponding permission-
to-user assignment UPA
12M
T
+
over 12 months (12M) to
examine how many of a user’s permissions used dur-
ing this time could be covered by the methods pre-
sented. It can be assumed that a user performs a large
part of his work activities at least once a year, in par-
ticular tasks that only occur infrequently, like the an-
nual financial statement, such that the corresponding
recorded trace data covers most of his or her activi-
ties in SAP ERP. The creation of the matrices used
for evaluation is shown in Figure 13.
Trace Data (3M)
Trace Data (12M)
Step 1
Transforma on
of Trace Data
Step 2+3
Clustering &
Exchange
12M
+
3M
∗
Figure 13: Creation of matrices for evaluation.
Since, to the best of our knowledge, no other methods
are known for this purpose in literature, the presented
methods are compared solely among each other.
Of originally 6,289 users (see Table 2), traces
were recorded for 3,006 in the considered last three
months of the trace documentation period. Therefore,
this number serves as a reference for the number of
clusters that emerge using (C1-2) with different val-
ues for the different threshold parameters. In Ag-
glomerative Clustering (C1), different values for the
Jaccard distance were selected. Setting the threshold
value d
max
= 0.01, for example, means that all users
of a cluster have Jaccard similarity of at least 99%.
The number of clusters created for different values of
d
max
is shown in Table 5.
Table 5: Number of clusters for (C1).
d
max
0.5 0.3 0.1 0.05 0.01
Permission 2166 2494 2562 2575 2593
Dimension 1237 1826 2387 2428 2434
Transaction 1586 2041 2321 2340 2341
In Mean Shift Clustering (C2), the size of the max-
imum radius of a cluster r
max
, was specified. As
stated, this clustering technique method operates at
the transaction level only.
Table 6: Number of clusters for (C2).
r
max
0.2 0.15 0.1 0.05 0.01
Transaction 129 302 779 2011 2197
It can be observed that (C1), which operates on all
three levels, form significantly more clusters on per-
mission level than on the other two levels. As ex-
pected, the number of clusters increases considerably
with decreasing value of the threshold. It is interest-
ing to see that (C2), which operates only at transaction
level, produces fewer clusters than (C1) at this level.
In order to evaluate the different combinations
of clustering methods (C1-2) and exchange meth-
ods (E1-2), three different cases were examined: In
Case 1, permission exchange (E1) was applied to the
ECTA 2022 - 14th International Conference on Evolutionary Computation Theory and Applications
130
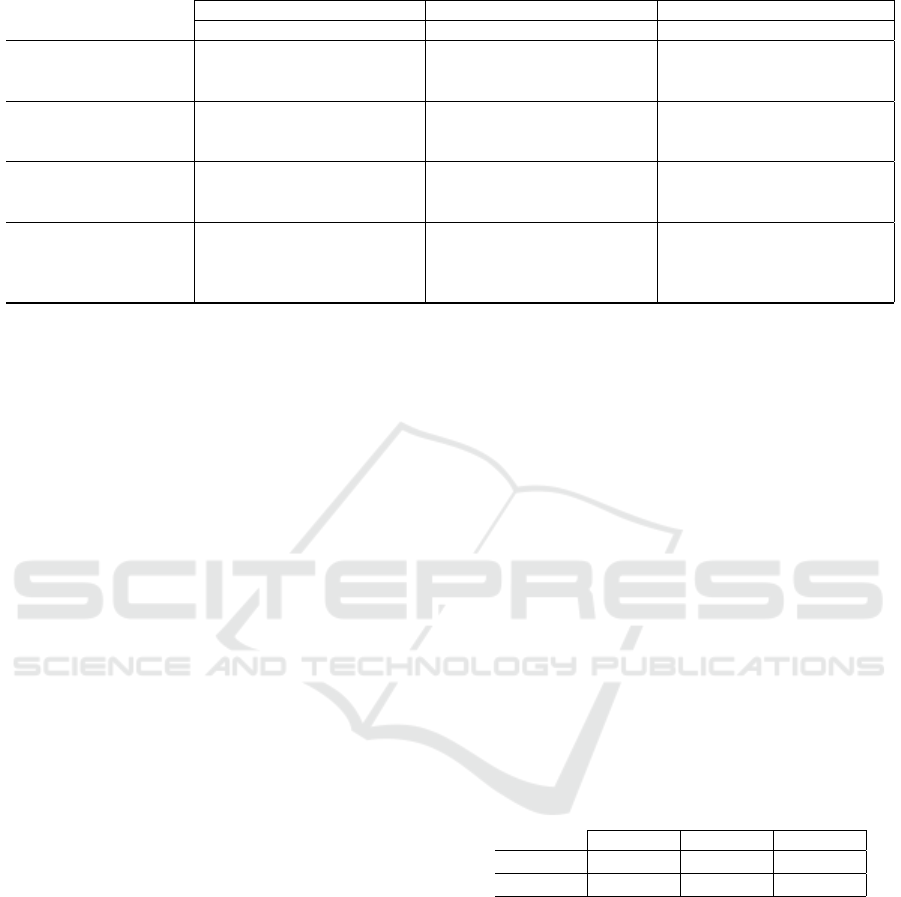
Table 7: Coverage and false positive rate after clustering and exchange methods.
Case 1 (E1) Case 2 (E1) reduced Case 3 (E2)
CR ∆ FPR CR ∆ FPR CR ∆ FPR
(C1) Permission 0.50 46.30% 0.65% 42.99% 56.41% 1.90% 32.52% 82.24% 3.56% 13.24%
(C1) Permission 0.30 45.91% 0.27% 42.46% 55.52% 1.01% 26.38% 81.13% 2.44% 10.33%
(C1) Permission 0.10 45.96% 0.32% 41.94% 55.45% 0.94% 25.34% 80.94% 2.26% 9.85%
(C1) Dimension 0.50 46.90% 1.26% 55.26% 59.78% 5.27% 53.15% 86.60% 7.92% 26.58%
(C1) Dimension 0.30 46.21% 0.57% 44.54% 57.05% 2.54% 36.68% 83.42% 4.74% 16.45%
(C1) Dimension 0.10 46.54% 0.89% 39.93% 55.51% 1.00% 27.43% 81.21% 2.53% 10.74%
(C1) Transaction 0.50 46.88% 1.24% 46.03% 57.92% 3.41% 41.71% 85.01% 6.33% 19.38%
(C1) Transaction 0.30 46.08% 0.44% 44.82% 56.23% 1.72% 32.14% 82.43% 3.75% 13.54%
(C1) Transaction 0.10 46.04% 0.40% 42.34% 55.50% 0.99% 27.43% 81.34% 2.66% 11.23%
(C2) Transaction 0.20 72.59% 26.95% 97.70% 86.07% 31.56% 95.41% 97.26% 18.57% 60.58%
(C2) Transaction 0.15 66.10% 20.46% 95.75% 80.49% 25.98% 92.69% 95.46% 16.78% 54.14%
(C2) Transaction 0.10 50.65% 5.01% 84.49% 68.04% 13.53% 78.81% 90.49% 11.81% 36.72%
(C2) Transaction 0.05 46.23% 0.58% 66.67% 56.52% 2.01% 46.25% 81.76% 3.08% 13.96%
entire set of trace data obtained from the three months
(3M) under consideration. Case 2 investigates the in-
fluence of traces associated to permissions that typi-
cally include wildcards in role concepts. These per-
missions are removed from the trace data before the
application of permission exchange (E1). In the fol-
lowing, this approach is referred to as (E1) reduced.
In Case 3, exchange method (E2) is applied to the en-
tire set of trace data obtained from the three months
(3M). Here, reducing trace data is not needed, since
(E2) operates on dimension level, where wildcards are
not relevant. For each case, two key indicators are cal-
culated. For this purpose, the structure of the matrix
UPA
∗
, resulting from the application of the cluster-
ing and exchange methods, must first be examined
in more detail. If permission p
j
is assigned to user
u
i
by UPA
∗
, i.e. (UPA
∗
)
i j
= 1, it is possible that u
i
has used p
j
within the 12 months under considera-
tion, such that (UPA
12M
T
+
)
i j
= 1, but it is equally possi-
ble that p
j
has not been used by u
i
during this period,
i.e. (UPA
12M
T
+
)
i j
= 0. Based on this, two matrices can
be derived: The matrix UPA
∗
⊕
, where (U PA
∗
⊕
)
i j
:=
(U PA
∗
)
i j
·(UPA
12M
T
+
)
i j
, represents all permissions that
were assigned to users by the proposed methods and
that were actually used in the considered 12 months.
The matrix U PA
∗
:= U PA
∗
−UPA
∗
⊕
thus represents
all permissions that were assigned to users by the
clustering and exchange methods but were not used.
The first key indicators to assess the quality of the
resulting UPA
∗
, the so-called coverage rate CR
∗
:=
kU PA
∗
⊕
k
1
/kU PA
12M
T
+
k
1
, is now calculated as the per-
centage of permissions in UPA
12M
T
+
that are covered
by UPA
∗
. The percentage of permissions in UPA
∗
which have not been used, the so-called false positive
rate FPR
∗
:= kUPA
∗
k
1
/kU PA
∗
k
1
, serves as second
key indicator. Table 7 shows the resulting values for
CR
∗
and FPR
∗
. Since the number of clusters does not
change much after a certain point by further decreas-
ing the thresholds of the different clustering methods,
only results for selected threshold values are shown.
The value of ∆ := CR
∗
− CR
3M
indicates the differ-
ence of the resulting coverage rate CR
∗
and the cover-
age rate before the application of the proposed meth-
ods CR
3M
. As shown in Section 5, the implemented
role concept of Company B assigns significantly more
permissions to users than actually needed, such that a
false positive rate FPR
RC
can be calculated for the
role concept of Company B and used as a additional
reference value. Since the role concept contains wild-
cards, only a lower bound for FPR
RC
can be calcu-
lated in Case 1 and Case 2. On permission dimension
level (Case 3), an exact calculation of FPR
RC
is pos-
sible. Although the values for CR
3M
and FPR
RC
are
independent of the selected clustering and exchange
methods in the three cases, they differ due to the dif-
ferent data sets used, where trace data was reduced in
Case 2 and permission dimensions are considered in
Case 3. The different values for CR
3M
and (the lower
bounds of) FPR
RC
are shown in Table 8:
Table 8: Coverage and false positive rate.
Case 1 Case 2 Case 3
CR
3M
45.64% 54.51% 78.68%
FPR
RC
91.15% 98.03% 70.93%
It turns out that the exchange of permissions in Case
1 hardly leads to better results using (C1), whereas
the coverage rate could be improved significantly us-
ing exchange method (E1) in combination with Mean
Shift Clustering (C2). However, this results in a large
number of permissions, which are assigned to users,
but have not been used in the 12 months under con-
sideration, reflected in large values of FPR. Delet-
ing permissions from the traces data, which typically
contain wildcards, before the application of cluster-
ing and permission exchange (Case 2), improves the
values for both CR and FPR in almost all test setups.
In Case 3, where permission dimensions are consid-
On using Authorization Traces to Support Role Mining with Evolutionary Algorithms
131

ered, it is shown that using (C2) coverage rates of over
95% can be achieved while the false positive rate is
significantly reduced compared to the FPR
RC
of the
role concept. These methods could therefore be used,
for example, by consultants when optimizing existing
role concepts and permission-to-user assignments.
8 CONCLUSION AND FUTURE
WORKS
In this paper, different methods were presented, which
aim at enhancing the assignment of permissions to
users based on trace data available in enterprise re-
source planning systems. These are based on the clus-
tering of users and the subsequent exchange of per-
missions within the users of the resulting clusters.
A special feature of the presented methods is that,
even though additional permissions are assigned to
users, the emergence of SoD conflicts can be avoided.
In order to be able to use the presented methods in
the framework of SAP ERP, the corresponding au-
thorization management data model was explained
in detail. Furthermore, trace and role concept data
derived from real-world use cases were analyzed as
basis for the evaluation of the presented methods.
The strengths and weaknesses of the various methods
could be shown and the potential of trace data for the
enhancement of permission-to-user assignment could
be demonstrated. In addition, it was shown that ex-
ploiting the knowledge about the relationship between
transactions and components or the pre-processing of
trace data, significantly improved the results of the
methods. Due to permission exchange, the structure
of the UPA is changed as users become more simi-
lar. It seems plausible that this facilitates the process
of finding good role concepts using EAs and needs to
be investigated in more detail in the future. Another
promising approach which could further improve the
quality of the presented methods could be the integra-
tion of user attributes into the clustering procedures.
REFERENCES
Anderer, S., Kreppein, D., Scheuermann, B., and
Mostaghim, S. (2020). The addRole-EA: A new
evolutionary algorithm for the role mining prob-
lem. In Proceedings of IJCCI 2020, pages 155–166.
SCITEPRESS.
Anderer, S., Scheuermann, B., Mostaghim, S., Bauerle, P.,
and Beil, M. (2021). RMPlib: A library of bench-
marks for the role mining problem. In Proceedings of
SACMAT ’21, page 3–13, New York, NY, USA. Asso-
ciation for Computing Machinery.
Anderer, S., Schrader, F., Scheuermann, B., and
Mostaghim, S. (2022). Evolutionary algorithms for
the constrained two-level role mining problem. In
Proceedings of EvoCOP 2022, page 79–94, Berlin,
Heidelberg. Springer-Verlag.
Du, X. and Chang, X. (2014). Performance of AI algo-
rithms for mining meaningful roles. In 2014 IEEE
Congress on Evolutionary Computation (CEC), pages
2070–2076. IEEE.
Eiben, A. E., Smith, J. E., et al. (2003). Introduction to
evolutionary computing, volume 53. Springer.
Frank, M., Basin, D., and Buhmann, J. M. (2008). A class
of probabilistic models for role engineering. In Pro-
ceedings of ACM CSS ’08, pages 299–310.
Frank, M., Buhmann, J. M., and Basin, D. (2010). On the
definition of role mining. In Proceedings of SACMAT
’10, page 35–44, New York, NY, USA. Association
for Computing Machinery.
Frank, M., Streich, A. P., Basin, D., and Buhmann, J. M.
(2009). A probabilistic approach to hybrid role min-
ing. In Proceedings of ACM CSS ’09, pages 101–111.
Fukunaga, K. and Hostetler, L. (1975). The estimation of
the gradient of a density function, with applications in
pattern recognition. IEEE Transactions on informa-
tion theory, 21(1):32–40.
Jaccard, P. (1901).
´
Etude comparative de la distribution flo-
rale dans une portion des alpes et des jura. Bull Soc
Vaudoise Sci Nat, 37:547–579.
Landau, S., Leese, M., Stahl, D., and Everitt, B. S. (2011).
Cluster analysis. John Wiley & Sons.
Lehnert, V., Stelzner, K., John, P., and Otto, A. (2016). SAP-
Berechtigungswesen: Konzeption und Realisierung.
Rheinwerk Publishing.
Lu, H., Vaidya, J., and Atluri, V. (2008). Optimal boolean
matrix decomposition: Application to role engineer-
ing. In 2008 IEEE 24th International Conference on
Data Engineering, pages 297–306. IEEE.
Mitra, B., Sural, S., Vaidya, J., and Atluri, V. (2016). A
survey of role mining. ACM Computing Surveys,
48(4):1–37.
Molloy, I., Li, N., Qi, Y., Lobo, J., and Dickens, L. (2010).
Mining roles with noisy data. In Proceedings of SAC-
MAT ’10, pages 45–54.
Roeckle, H., Schimpf, G., and Weidinger, R. (2000).
Process-oriented approach for role-finding to imple-
ment role-based security administration in a large in-
dustrial organization. In Proceedings of RBAC ’00,
pages 103–110, New York, USA. ACM Press.
Saenko, I. and Kotenko, I. (2011). Genetic algorithms
for role mining problem. In Proceedings of PDP’11,
pages 646–650. IEEE.
Vaidya, J., Atluri, V., and Guo, Q. (2007). The role mining
problem. In Proceedings of SACMAT ’07, pages 175–
184, New York, New York, USA. ACM Press.
Vaidya, J., Atluri, V., Guo, Q., and Lu, H. (2010). Role
mining in the presence of noise. In Proceedings of
DBSEC 2010, pages 97–112. Springer.
Verizon (2019). Data breach investigations report 2019.
Computer Fraud & Security, 2019(6):4.
ECTA 2022 - 14th International Conference on Evolutionary Computation Theory and Applications
132
