
The Elusive Features of Success in Soccer Passes: A Machine Learning
Perspective
Hugo Muacho
1 a
and Ricardo Ribeiro
1,2 b
and Rui J. Lopes
1,3 c
1
Iscte - Instituto Universit
´
ario de Lisboa, Portugal
2
INESC-ID Lisboa, Portugal
3
Instituto de Telecomunicac¸
˜
oes, Lisboa, Portugal
Keywords:
Machine Learning, Decision Trees, Soccer, Performance Analysis, Pass Success.
Abstract:
Machine learning has in recent years been increasingly used in the soccer realm. This paper focuses on inves-
tigating the factors influencing pass success, a chief element in team performance. Decision tree techniques
are used aiming to identify which features are the most important in pass success. This process is applied to
a data set of 13 matches of the men’s French “Ligue 1”. Two experiments are conducted using different fea-
ture sets: one containing the positional data and Voronoi area off all players, the second considering only the
ball carrier and closest teammates and opponents. The results obtained with the first feature set indicate that
the relative importance of features is match dependent and somehow related to teams’ formation and players’
tactical mission. The second feature set, being more directly related to the passing process, provided a more
consistent ranking of features. Features related to the interaction with the opponent standout. Low precision
and recall values show that the features and factors leading to pass success are in fact elusive.
1 INTRODUCTION
We currently live in the Digital Age (Techopedia,
2017), where new technologies emerge and take their
place in society. Artificial Intelligence (AI) is part of
this contribution to the society and became one of the
biggest trends in the world today. The recent popu-
larity of AI can be attributed to the following three
factors: the growth of Big Data, easy access to com-
puting power, and the development of new AI tech-
niques (Obschonka and Audretsch, 2020).
In sports, soccer being no exception, AI has been
applied in several areas. Examples of its use are the
evaluation of player performance, team coordination
and prediction of the expected goals (estimating the
quantity and quality of goal opportunities a team has
created in a match). With the introduction of AI in
soccer, teams are able to discover new potentials and
achieve new and ambitious goals, especially in in-
creasing team competitiveness, decision making, and
performance assessment. Albeit this interest and po-
tential, the technology is still immature and needs im-
a
https://orcid.org/0000-0001-9343-7073
b
https://orcid.org/0000-0002-2058-693X
c
https://orcid.org/0000-0002-8943-0415
provement (Ks, 2020).
In the game of soccer, team’s performance is
strongly related to the way the ball carrier interacts
with his teammates via passes. There is a multiplicity
of indicators of passing performance that have been
identified, notably: the zone of the field, the trajec-
tory of the receiver, and the space where the ball is
received (Cordon et al., 2020).
This paper aims to contribute to this enquiry on
the indicators of pass success using AI techniques.
Notably, it uses a computational approach based on
AI techniques (decision tree) that processes real data
in order to quantitatively assess the importance of fea-
tures (e.g., location of players, available area) for pass
success. The novelty on the paper is that the focus
is not on investigating techniques for a better predic-
tion of pass success but rather to understand, using ex-
isting techniques, what are the factors that contribute
more strongly for pass success.
This paper is structured as follows: next section
describes related work on AI and soccer match anno-
tation; Section 3 presents the data sources used; Sec-
tion 4 addresses the methods used to process the data
and compute the importance of features; the results
obtained are presented in Section 5; Final Remarks
and Future Work close the paper.
110
Muacho, H., Ribeiro, R. and Lopes, R.
The Elusive Features of Success in Soccer Passes: A Machine Learning Perspective.
DOI: 10.5220/0011541700003321
In Proceedings of the 10th International Conference on Sport Sciences Research and Technology Support (icSPORTS 2022), pages 110-116
ISBN: 978-989-758-610-1; ISSN: 2184-3201
Copyright
c
2022 by SCITEPRESS – Science and Technology Publications, Lda. All rights reserved

2 LITERATURE REVIEW
Soccer analytic companies have only recently started
to analyse so-called big data (e.g., high-resolution
video, tracking player movement and possession in-
formation). At the same time, only recently have
major advances been made in machine learning, pro-
ducing techniques that can handle these new high-
dimensional data sets. The amount of data available in
soccer has increased with different techniques to col-
lect a large amount of data such as sensors, GPS, and
computer vision algorithms. This helps the use of ma-
chine learning in soccer in its various areas such as in
recruiting and analysing the performance of players,
in selling tickets bringing fans closer to their club, and
also in helping decision making that affects an entire
area of a club.
2.1 Machine Learning in Soccer
Machine learning is the field of study that focus on
how computers learn to perform a task without be-
ing explicitly programmed to do it. It can be defined
as a set of methods that can automatically detect pat-
terns in data to predict future data or to perform other
types of decision making (Murphy, 2012). Machine
learning is beginning to play an essential role within
the following branches of computing: data migra-
tion, hard-to-program applications, and custom soft-
ware applications (Mitchell, 1997). Machine learn-
ing algorithms generally fall into two paradigms: su-
pervised learning and unsupervised learning (Stimp-
son and Cummings, 2014). In supervised learning a
“teacher” is assumed to be present, where the correct
answers are provided for each situation. Supervised
learning techniques build predictive models that learn
from a large number of training examples, where each
training example has a label that indicates its truth
output (Zhou, 2017) – a pair consisting of the input
object and an output label value that belongs to a class
or is a continuous value.
Machine learning, and AI in general, have been
more and more used in the world of soccer not only in
performance or tactical analysis, but also in the med-
ical and marketing departments.
One such example outside the tactical field is in-
jury prevention. For example, the study conducted by
Rommers et al. (Rommers et al., 2020) who during
one season tried to predict the injuries of 734 players
aged between 10 and 15 years old from seven Bel-
gian academies. At the beginning of the season a bat-
tery of tests were performed to evaluate motor coor-
dination and physical fitness and characteristics (e.g.,
height, weight, strength, and flexibility). Based on
these characteristics, the machine learning algorithm
was able to predict injuries and distinguish between
serious and light injuries with high accuracy. The ap-
plication of this type of algorithms also helps coaches
in decision making during the game, such as knowing
the physical condition of a player and whether or not
he should be substituted.
Another example of the application of machine
learning in soccer is in analysing player performance.
Jamil et al. (Jamil et al., 2021) applied several ma-
chine learning algorithms (Logistic Regression, Gra-
dient Boosting, and Random Forest) to classify the
performance of professional goalkeepers aiming to
distinguish an elite goalkeeper from a sub-elite goal-
keeper. The conclusions drawn in this study where
that all elite goalkeepers shared the same common
characteristics: short distribution, successfully pass-
ing and receiving the ball, and not conceding goals.
This study suggested that it is the goalkeeper’s skill
with his feet that distinguishes elite goalkeepers from
the sub-elite.
Another example in the area of performance anal-
ysis is the work of Pappalardo et al. (Pappalardo et al.,
2019) through a simulator recommendation. The
work implemented PlayeRank, a data-driven frame-
work that offers a principled multi-dimensional and
role-aware evaluation of the performance of soccer
players.
2.2 Match Data and Annotation
Annotations in soccer are an important tool to obtain
data from a match. The analysis of soccer matches re-
lies on the annotation of both individual player’s ac-
tions (e.g., passes and shoots), athletic performance
and team events (e.g., substitutions). Consequently,
annotating soccer events at a fine-grained level is an
expensive and error-prone task (Barra et al., 2021).
On the other hand, positional data is usually ob-
tained using automated or semi-automated tools that
rely on devices such as GPS receivers, cameras and
computer vision. One of the more interesting oppor-
tunities provided by the availability of position track-
ing data in soccer is the analysis of tactical behaviour.
Tactical behaviour is an important determinant of per-
formance in team sports like soccer, and refers to how
a team manages its spatial positioning over time to
achieve a shared goal.
3 MATERIALS
The material used in this paper is a database cor-
responding to annotation and positional data of 13
The Elusive Features of Success in Soccer Passes: A Machine Learning Perspective
111

matches in the French Premier League (Ligue 1).
This database contains 563 067 entries and 11 vari-
ables. Each entry corresponds to a technical action
performed in the match; the variables correspond to
player’s positioning and other attributes describing
the technical action (e.g., a pass). These include the
following:
Match (integer): unique game identifier;
Period (1,2): first (1) or second part (2) of the match
Time (decimal, seconds): match time
Team (f, o): team identifier, (f)ocus or (o)pponent
Tactical Mission (class): player’s tactical mission
(e.g., GK - Goal Keeper, LB - Left back)
x, y (decimal): player’s longitudinal (x) and lateral
(y) position on the pitch (in meters). The centre
of the pitch corresponds to coordinate (0,0)
Voronoi Area (decimal, m
2
): player’s Voronoi cell
area
Event (class): technical action performed (e.g., Pass,
Shot)
Distance (decimal): distance from the player hold-
ing the ball to the opponent’s goal (in meters)
Ball Zone (O, I): if the ball zone is in an (O)utside or
(I)nside area
Continuation (0, 1): the ball remains in the team’s
possession (0) or changes to the opponent (1)
Angle (decimal): angle to offensive goal
In addition to the information pertaining to each
event, other annotation information was also used, no-
tably the predominant tactical formation adopted by
each team (in Figure 1 a 3-5-2 for the focus team, red,
and 4-4-1-1 for the opponent team, blue).
Using these features two experiments were per-
formed. In both experiments all passes (10 332) made
in the first half of the 13 games were considered. Of
these, only 1 405 (13.6%) were unsuccessful (this
unbalanced data represents a challenge for machine
learning techniques).
4 METHODS
This section presents the methods used in the experi-
ments: a decision tree to model the outcome of a pass;
how the importance of the different features for that
outcome is estimated; the use of Voronoi cells as fea-
tures; the use of cosine similarity to compare matches.
4.1 Decision Tree
Decision tree is a supervised learning method used in
classification and regression tasks. The goal is to cre-
ate a model that predicts the value of a target variable,
the output, by learning simple decision rules inferred
from data, the features (Pedregosa et al., 2011). Since
the decision tree follows a supervised approach, the
algorithm is fed a collection of pre-processed data that
is used to train the algorithm.
In a decision tree, the top level is called the root,
the root gives rise to links to other elements called
nodes. A node that has no link is called an end node,
otherwise is a decision node (see Figure 3). Decision
nodes in the tree correspond to questions that are pre-
sented to the data (if a feature variable is larger or
smaller than a threshold value). Each edge of the tree
corresponds to an outcome of the question and lead
to another decision node or to an end node represent-
ing a class distribution (i.e., a value of the output).
This method is based on algorithms that divide the
initial data set into more homogeneous subsets which
in turn can be divided into even more homogeneous
subsets (de Ville, 2006). The decision tree algorithm
works through several aligned if-else statements in
which successive conditions are checked unless the
model reaches a conclusion on the output or a prede-
fined depth of the tree is reached.the cases in the tree
concern passes made by players. The Gini impurity
metric indicates how well a tree splits the data.
4.2 Importance of Features
The chief assumption in the paper is that the impor-
tance of a feature (e.g., x coordinate) can be quantified
by its importance in the decision tree. Feature im-
portance is calculated as the decrease in node impu-
rity weighted by the probability of reaching that node
(the number of samples that reach the node, divided
by the total number of samples). The importance for
each feature in a decision tree is then calculated using
Eq. 1 (Stacey, 2018).
σ
j
= w
j
C
j
− w
left( j)
C
left( j)
− w
right( j)
C
right( j)
(1)
σ
j
the importance of node j
w
j
probability of reaching node j
C
j
the impurity value of node j
left( j) child node from left split on node j
right( j) child node from right split on node j
4.3 Voronoi Area
A Voronoi diagram is a partition of a plane into re-
gions close to each of a given set of objects. In the
icSPORTS 2022 - 10th International Conference on Sport Sciences Research and Technology Support
112

Figure 1: Players’ Voronoi diagram.
simplest case, these objects are points in the plane
(called seeds, sites, or generators). For each object
corresponds one region defined by the points in the
plane that closer to that object than to any other.
In invasion sports, the spatial distribution of play-
ers on the field is determined by the interaction behav-
ior established at both player and team levels (Fon-
seca et al., 2013) making Voronoi diagrams a useful
tool to analyze matches. In this context, Voronoi di-
agrams are computed using players’ position in the
pitch (see Figure 1). Voronoi diagrams may help
coaches to see how well the players use space, find
new spaces in which to attack, and identify areas
in defense that the team leaves open. In this paper
player’s Voronoi cell area will be used as a feature
influencing the success of the pass.
4.4 Comparing Matches
Passes occur within a context: a match. As our
study involves different matches, it is thus important
to assess quantitatively how (di)similar two matches
are. Cosine similarity is a well know method that
can be used for this. In order to assess how similar
two matches are each match is described by a vec-
tor of attributes (say a and b) and the similarity value
sim
cos
(a, b) computed using Equation 2.
sim
cos
(a, b) =
a · b
kakkbk
=
∑
n
i=1
a
i
b
i
q
∑
n
i=1
a
2
i
q
∑
n
i=1
b
2
i
(2)
In this paper, three different types of attribute vec-
tors are used to characterise each match:
• Team formation: a match is described by the typ-
ical formation adopted by each team. The match
from Figure 1 is described by vector
[3, 5, 2, 0,
| {z }
Focus
4, 4, 1, 1]
| {z }
Opponent
.
• Tactical mission: a match is described by the tac-
tical mission (e.g., GK, ST) of the players in the
pitch
[GK, LB, LCB, . . . , ST, SS,
| {z }
Focus
GK, LB, LCB, . . . , ST, SS]
| {z }
Opponent
Value 1 is used if a player with that tactical mis-
sion is on the pitch, 0 otherwise. The match from
Figure 1 is described by vector
[1, 0, 0, . . . , 0, 0,
| {z }
Focus
1, 1, 0, . . . , 1, 1]
| {z }
Opponent
• Features importance: a match is described by the
importance value, σ
i
computed for feature i of the
decision tree.
[σ
1
, σ
2
, σ
3
, . . . , σ
N
]
| {z }
N f eatures
5 EXPERIMENTAL RESULTS
5.1 Match Similarity: Team Formation
and Tactical Mission
The similarity of pair of matches according to the
teams’ formation (tactical mission of the teams’ line-
up) was computed for all possible pairs of matches
as represented in Figure 2. As expected, similarity is
typically higher in teams’ formation than in tactical
mission of the teams’ line-up. Tactical mission of the
teams’ line-up similarity presents a higher variability.
For both criteria, matches 101 and 102 present a high
similarity between them but low similarity to all other
matches. Considering the more discriminatory crite-
ria based on players’ line-up tactical mission one finds
as the most similar the following pairs of matches:
(101, 102); (103 − 102); (104 − 109); (106 − 108);
(106 − 111) and (108 − 111).
5.2 Experiment with Features from All
Players
In order to pinpoint the more relevant features for pass
success a first experiment was conducted using fea-
tures (x, y, and Voronoi Area) of all 22 players on
the field (66 features in total) and as output value the
pass outcome (success or not, Continuation in Sec-
tion 3). Two decision trees were created, one with 6
levels (represented in Figure 3) another with 20 levels.
The Elusive Features of Success in Soccer Passes: A Machine Learning Perspective
113

(a) Teams’ Formation. (b) Teams’ Player Line-up Tactical Mission.
Figure 2: Cosine similarity between matches.
Figure 3: Decision Tree with 6 levels.
Table 1: 1
st
experiment cross validation results.
Tree Accuracy Precision Recall
6 levels 0.82 0.158 0.083
20 levels 0.79 0.235 0.500
Table 1 presents the cross validation assessment
values for the two trees.
Analyzing the results we can see that although the
decision tree with 6 levels has a higher accuracy the
other parameters are very low.
Using the method described in Section 4.2, the im-
portance of each feature in the 13 matches was com-
puted. Features were ordered according to their im-
portance, using maximum and average values across
matches in which it was present. Table 2 presents the
top 5 features on both criteria. Figure 4 shows the im-
portance of the 66 features on each match, ordered by
their average.
Figure 4: Features’ importance across matches (by avg.).
Table 2: Top 5 features.
Top features by max. Top features by avg.
Feature Value Feature Value Matches
f GK x 0.29 o CM2 area 0.11 2
o RCB x 0.27 f RM x 0.09 1
f RB x 0.24 f CAM x 0.06 4
o LCB x 0.23 f CAM y 0.06 4
o CAM y 0.21 f LM y 0.06 1
Analysing the ranking by average, in the first
places appear features that do not appear in many
games (between 1 and 4). These values are also low,
which may indicate that there is no common feature
that stands out in all matches. Notably, none of the
different classes of features, x, y, and Voronoi Area
can be considered as dominant. On the other hand,
all top 5 features are associated to mid-field tactical
missions (4 belonging to the focus team).
Considering the maximum value for the impor-
tance of features none of them has a very high value.
icSPORTS 2022 - 10th International Conference on Sport Sciences Research and Technology Support
114
This indicates that the importance of features in all
games is very disperse among the features and teams
(2 focus, 3 opponent). Nonetheless, the x feature class
stands out as well as defensive tactical missions.
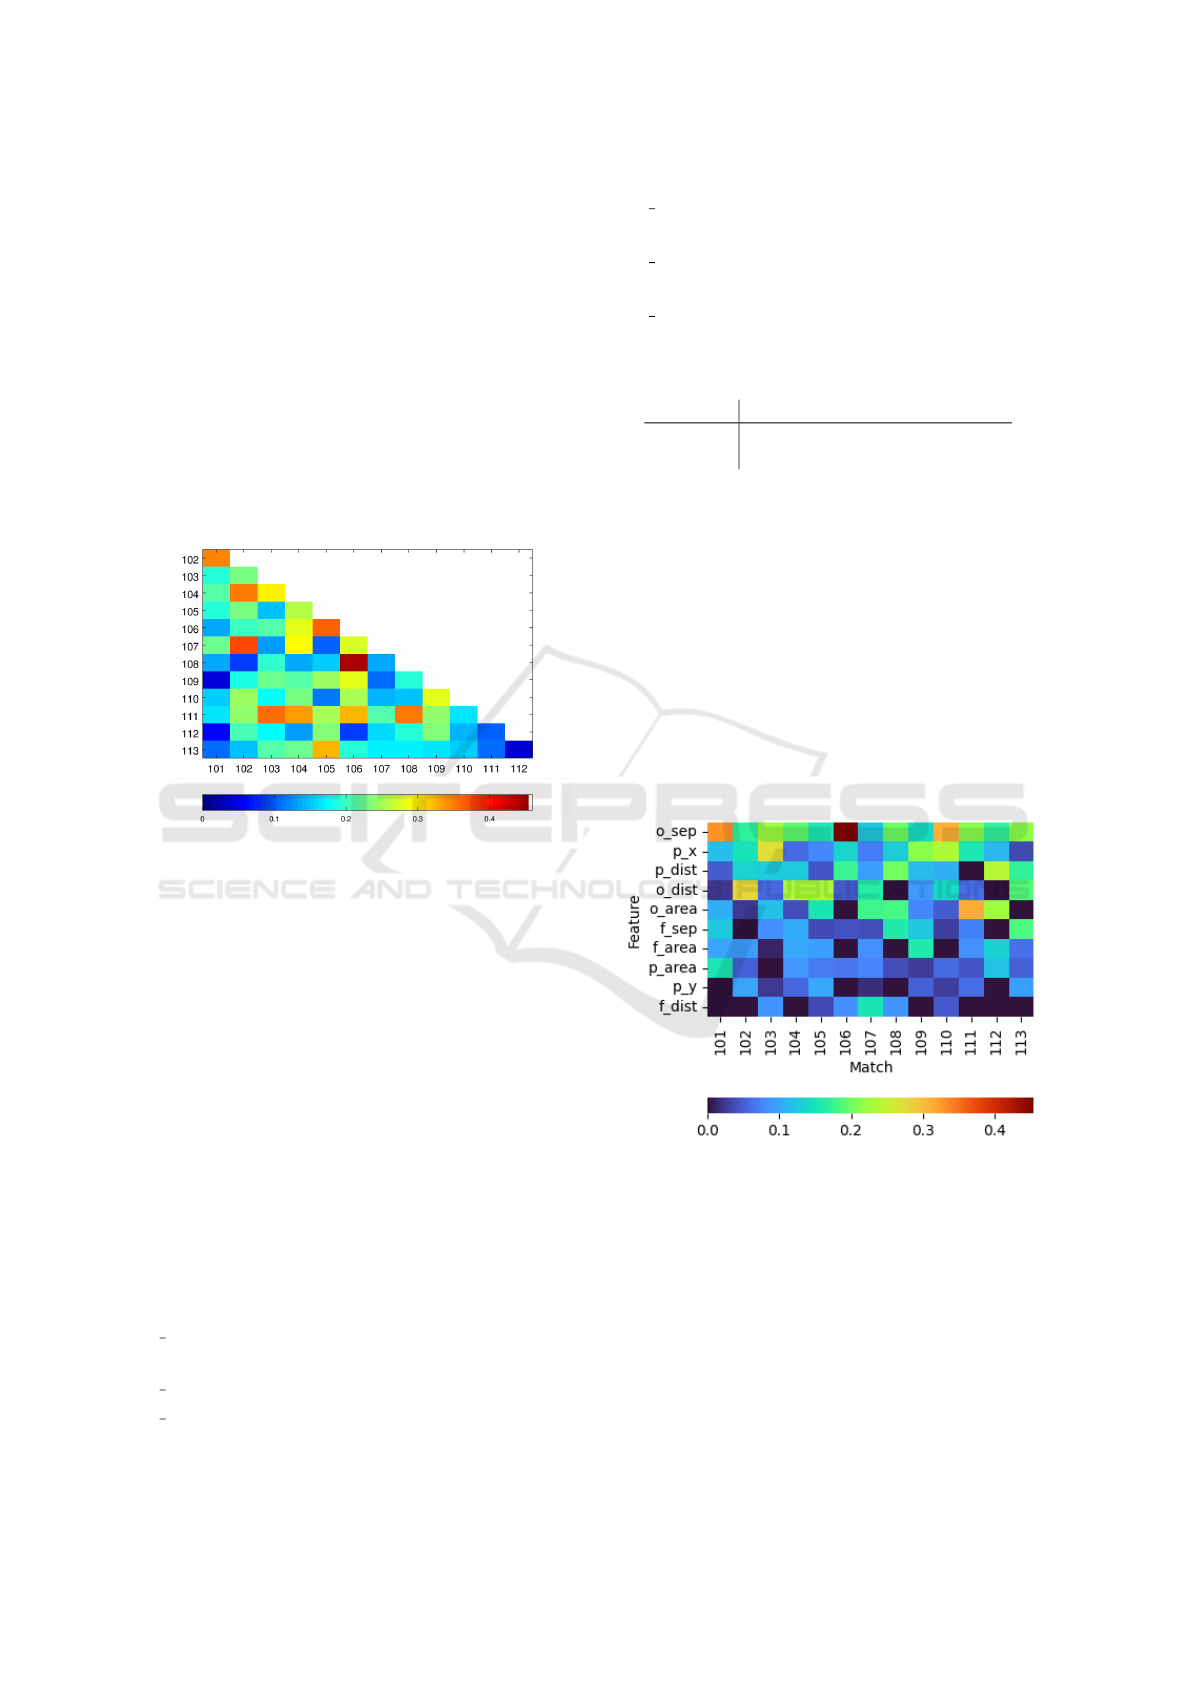
Figure 4 confirms this dispersion of importance
across the different features and matches. Disper-
sion across matches was investigated by computing
the similarity between the importance of features for
all matches pairs using the cosine similarity metric
(as in Section 4.4). The values represented in Fig-
ure 5 indicate a low similarity between all pairs of
matches. However, it is of note that most pairs pre-
senting higher similarity (e.g., 106 − 108, 101 − 102
and 108 − 111) correspond to matches that have also
high tactical mission similarity.
Figure 5: Features’ importance Cosine Similarity.
Albeit the interesting relation between features’
importance and players’ tactical mission, this experi-
ment does not identify a consistent set of features to
be considered as the most relevant across matches for
deciding pass outcomes. This was somehow to be ex-
pected as the features considered where not strongly
associated to the process under observation: passing.
5.3 Experiment with Ball Carrier and
Closest Players
In order to overcome the limitations of the previ-
ous experiment we used features of the player per-
forming the pass (ball carrier) combined with fea-
tures of the closest player from the same and oppo-
nent teams. In addition to the longitudinal and lat-
eral coordinates, features related to ”available” space
(Voronoi area) and ”support/pressure” (distance to
teammate/opponent), were considered:
p x(y) (decimal): longitudinal (lateral) position of
ball carrier.
p area (decimal): Voronoi cell area of ball carrier.
p dist (decimal): distance to opponent’s goal from
ball carrier.
f(o) sep (decimal): distance between ball carrier and
closest teammate/opponent (f/o).
f(o) area (decimal): Voronoi cell area of closest
teammate/opponent (f/o).
f(o) dist (decimal): distance to goal from closest
teammate/opponent (f/o).
Table 3: 2
st
experiment cross validation results.
Tree Accuracy Precision Recall
6 levels 0.82 0.1 0.15
20 levels 0.78 0.31 0.32
Analysing the Table 3 we can see that although the
6-level decision tree has a higher accuracy the other
parameters are lower.
Figure 6 shows the importance of each feature
sorted by increasing average value. The most impor-
tant feature is the distance between ball carrier and
closest opponent. This makes sense, as the opponent
is applying pressure, the difficulty of a successful pass
increases. Actually, all three opponent related fea-
tures are found in the Top 5, reinforcing the hypoth-
esis that the interaction with the closest opponent is
of chief importance on pass success. Conversely, fea-
tures concerning the teammate are amongst the least
important, especially distance to goal.
Figure 6: Ball carrier, Teammate and Opponent features’.
6 CONCLUSIONS AND FUTURE
RESEARCH
From this exploratory work the following main con-
clusion can be obtained: identifying and quantifying
the factors of passing success is in fact a difficult task.
This is confirmed by the fact that, albeit the high ac-
curacy, precision and recall scores are low in all ex-
periments. Additional, more detailed, conclusions are
The Elusive Features of Success in Soccer Passes: A Machine Learning Perspective
115

the following:
• The pass success/insuccess imbalance impairs the
assessment of the decision mechanism.
• The relative importance of features is somehow
related to the match teams’ formation and players’
tactical missions.
• Using more features does not guarantee an in-
crease on accuracy;
• Having a set of features that are more directly re-
lated to the process (passing) enabled a more con-
sistent ranking of features across matches.
• Interaction with the closest opponent appears to
be of key importance for pass success.
Concerning future work, we suggest:
• Explore techniques to mitigate data imbalance.
• Inquire other features related with the interaction
with opponents.
• Investigate why Voronoi areas are not as relevant
as expected. An hint is that the complete Voronoi
area may not be considered as “usefull”.
Albeit its limitations, notably low precision and
recall, the results of the paper may be useful to prac-
titioners. For example, they may help designing con-
strained pass practice tasks (e.g., with representative
distances to opponent and team mates).
ACKNOWLEDGEMENTS
Rui J. Lopes was partly supported by the Fundac¸
˜
ao
para a Ci
ˆ
encia e Tecnologia, under Grant Num-
ber UIDB/50008/2020 attributed to Instituto de
Telecomunicac¸
˜
oes. Ricardo Ribeiro was partly sup-
ported by national funds through Fundac¸
˜
ao para
a Ci
ˆ
encia e a Tecnologia (FCT) with reference
UIDB/50021/2020. The authors would like to thank
N
´
elson Caldeira for his valuable comments and sug-
gestions.
REFERENCES
Barra, S., Carta, S. M., Giuliani, A., Pisu, A., Podda,
A. S., and Riboni, D. (2021). Footapp: an ai-
powered system for football match annotation. CoRR,
abs/2103.02938.
Cordon, A., Garcia, A., Marquina Nieto, M., Calvo, J.,
Mon, D., and Rom
´
an, I. (2020). What is the rele-
vance in the passing action between the passer and the
receiver in soccer? Int. Journal of Environmental Re-
search and Public Health, 17.
de Ville, B. (2006). Decision Trees for Business Intelligence
and Data Mining: Using SAS Enterprise Miner. SAS
Institute.
Fonseca, S., Milho, J., Travassos, B., Araujo, D., and
Lopes, A. (2013). Measuring spatial interaction be-
havior in team sports using superimposed Voronoi di-
agrams. International Journal of Performance Analy-
sis in Sport, 13:179–189.
Jamil, M., Phatak, A., Mehta, S., Beato, M., Memmert,
D., and Connor, M. (2021). Using multiple machine
learning algorithms to classify elite and sub-elite goal-
keepers in professional men’s football. Scientific Re-
ports, 11(1):22703.
Ks, M. (2020). Applications of artificial intelligence in the
game of football: The global perspective. Journal of
Arts Science & Commerce, 11:18–29.
Mitchell, T. M. (1997). Does machine learning really work?
AI Magazine, 18(3):11.
Murphy, K. P. (2012). Machine learning: a probabilistic
perspective. MIT press.
Obschonka, M. and Audretsch, D. (2020). Artificial
Intelligence and Big Data in entrepreneurship: A
new era has begun. Small Business Economics,
55(3):529–539.
Pappalardo, L. et al. (2019). PlayeRank: Data-Driven Per-
formance Evaluation and Player Ranking in Soccer
via a Machine Learning Approach. ACM Trans. In-
tell. Syst. Technol., 10(5).
Pedregosa, F. et al. (2011). Scikit-learn: Machine learning
in Python. Journal of Machine Learning Research,
12:2825–2830.
Rommers, N. et al. (2020). A Machine Learning Approach
to Assess Injury Risk in Elite Youth Football Players.
Medicine & Science in Sports & Exercise, 52:1745–
1751.
Stacey, R. (2018). Towards Data Science: The
Mathematics of Decision Trees, Random Forest
and Feature Importance in Scikit-learn and Spark.
https://tinyurl.com/3kca6xp8. Accessed: 2022-06-01.
Stimpson, A. J. and Cummings, M. L. (2014). Assessing in-
tervention timing in computer-based education using
machine learning algorithms. IEEE Access, 2:78–87.
Techopedia (2017). What does digital revolution mean?
tinyurl.com/4xkk4mkr. Accessed: 2021-12-22.
Zhou, Z.-H. (2017). A brief introduction to weakly super-
vised learning. National Science Review, 5(1):44–53.
icSPORTS 2022 - 10th International Conference on Sport Sciences Research and Technology Support
116
