
Between the Buttons: Stress Assessment in Video Games using Players’
Behavioural Data
Susanna Brambilla
a
, Giuseppe Boccignone
b
, N. Alberto Borghese
c
and Laura A. Ripamonti
d
Department of Computer Science, University of Milan, Via Celoria 18, Milan, Italy
Keywords:
Affective Computing, Video Game Design, Human-Computer Interaction, Stress, Physiological Data,
Behavioural Data, Virtual Reality, Machine Learning.
Abstract:
Flow lies at the heart of the interaction between players and video games. It is usually regarded as the op-
timal experience blooming in the fragile equilibrium that floats between boredom and anxiety. Under such
circumstances, stress assessment can be a crucial experiential marker. In this preliminary study, we propose
a computational approach to characterise the stress level of video game players, suitable to be exploited in
the development of adaptive video games while enhancing players’ experience. To such purpose, a Virtual
Reality (VR)-based video game has been created to gather data from participants. The information collected
includes both physiological data and motion behavioural data (from game controllers), as well as the subjects’
self-reports of perceived stress. Behavioural data are specifically considered in the work presented here. We
characterize the stress level evolution in terms of state-space dynamics, which is suitable for either discrete
(classification) and continuous stress level assessment. Different experiments have been performed and results
so far obtained are encouraging. In particular, along the stress vs. no-stress classification test, an accuracy of
up to 84.4% is achieved by using VR-based data.
1 INTRODUCTION
The creation of player-centered technologies, putting
players and their objectives at the center of the de-
sign and development process, is heavily emphasized
in the current video game research realm. Due to their
interactive nature, games have a significant potential
to elicit in players a variety of cognitive, affective, and
behavioral reactions. In such perspective, entertain-
ment and engagement play an essential role and are
often related to the Csikszentmihalyi’s ‘Flow theory’
(Csikszentmihalyi and Csikzentmihaly, 1990). Flow
is a state of elevated concentration and enjoyment, in
which a person is neither anxious nor bored, but com-
pletely absorbed in the game.
As such, flow is related to the stress level experi-
enced by the player. Indeed, according to flow theory,
a lack of stress can lead to boredom and loss of mo-
tivation, while too much stress can cause the player
a
https://orcid.org/0000-0002-7975-8724
b
https://orcid.org/0000-0002-5572-0924
c
https://orcid.org/0000-0002-0925-3448
d
https://orcid.org/0000-0001-8167-7870
to suffer from anxiety. Both of them can kill the en-
joyment of the gaming experience. It is worth not-
ing that video games do not generate stress per se;
rather, it is the player’s own interaction with the game
that results in a more or less stressful personal expe-
rience, depending on the challenge level of the game,
the skill level of the player and game genre prefer-
ences (Fullerton, 2014; Schell, 2008).
On the other hand, the expectancy of the players
and its fulfillment or failure not only are ingredients
triggering a stress response, but also contribute to the
players’ affective state (Lebois et al., 2016). Play-
ers are constantly demanding more immersive expe-
riences, and players’ emotional involvement can be
seen as a sign of a high level of immersion in the
game. Affective-based interaction can increase player
engagement, and the emotion-driven game adaptation
helps with the personalization of the playing expe-
rience, allowing for the fulfillment of each player’s
unique demands (Yannakakis and Togelius, 2018).
Eventually, stress response and emotional involve-
ment dynamics together contribute in modulating be-
havioural and physiological response along the gam-
ing session. Yet, there are few examples of how emo-
Brambilla, S., Boccignone, G., Borghese, N. and Ripamonti, L.
Between the Buttons: Stress Assessment in Video Games using Players’ Behavioural Data.
DOI: 10.5220/0011546400003323
In Proceedings of the 6th International Conference on Computer-Human Interaction Research and Applications (CHIRA 2022), pages 59-69
ISBN: 978-989-758-609-5; ISSN: 2184-3244
Copyright
c
2022 by SCITEPRESS – Science and Technology Publications, Lda. All rights reserved
59

tion recognition systems can be used in video games.
The hypothesis that the players’ arousal is corre-
lated with the pressure applied to the buttons of the
game pad has been investigated by Sykes and Brown
(2003). With this aim, they created a video game
similar to the classic arcade game Space Invaders,
with three difficulty levels (easy, medium, hard). The
pressure used by players during a game session was
recorded and compared across the three levels. Ac-
cording to the study’s findings, players push the game
pad buttons far harder as the difficulty level rises.
Hiramon (Frommel et al., 2018) is another good
example of technique for players’ emotional state de-
tection involving their input on game controllers. Hi-
ramon is a serious game which aims at teaching play-
ers to write Japanese hiragana characters. Players
are first shown how characters are written and are re-
quired to replicate them (learning period). Then, play-
ers are challenged by enemies to write specific char-
acters randomly chosen from those that they have al-
ready learned (fight period). During the game, input
parameters on a graphic tablet and in-game perfor-
mance are collected. Self-reports of emotions were
also gathered via a questionnaire after each fight of
the game, in order to train an ML model to predict
levels of valence, arousal, and dominance for a clas-
sification problem, with an accuracy of up to 74%.
We aim at overcoming the limitations of the pre-
sented works by exploiting new technologies, which
provide more opportunities for interaction, and by
considering the evolution of the stress level in terms
of state-space dynamics.
The main goal of the work presented here is to
develop a method for improving the game-play ex-
perience by exploiting a computational approach to
seamlessly assess players’ level of stress while play-
ing, the latter being inferred from motion behavioural
data collected from game controllers.
To this purpose, the game used for the experiment
has been developed for a Virtual Reality (VR) envi-
ronment, due to its high level of immersion and re-
alism. Immersive technologies like VR can help to
arouse a sense of presence in the game, enhancing
players’ fun and involvement and eliciting stronger
emotional reactions (Pallavicini et al., 2018b; Mar
´
ın-
Morales et al., 2020).
The paper is organized as follows. Section 2 de-
scribes the methods with a focus on the design of the
game and its elements. Section 3 details the experi-
mental setting used to collect the users’ data. Section
4 illustrates the analyses carried out using the col-
lected data, Section 5 focuses on the learning mod-
els used to build the stress assessment system. Sec-
tion 6, presents and discusses the results achieved so
far; eventually, in Section 7, some preliminary con-
clusions are drawn.
2 METHODS
Input data from controllers, coupled with players’
self-assessment, are used to infer the stress level.
Self-assessment annotations correspond to their per-
ceived stress, used as labels of the generated dataset.
For some subjects, self-reported valence and arousal
levels were also collected. The survey of Klein-
smith and Bianchi-Berthouze (2012) and of Karg
et al. (2013) are significant reviews concerning the
affective body expression perception and recognition.
They showed that the body is a valid modality for rec-
ognizing affect. Body movements were analyzed and
used to identify emotion-specific features in order to
recognize basic emotions (Ahmed et al., 2019)
The motion behavioural data were taken from the
Oculus Quest 2
1
devices; jointly, physiological sig-
nals were recorded via the Empatica E4
2
wristband,
to be exploited in future analyses.
2.1 Game Design
The video game
3
, developed in Unity Engine
2020.3.19.f1, is a first-person horror survival game
for a VR environment (Figure 1). The game is set
on an abandoned space station and the players’ goal
is to escape from the station, facing enemies in a
hostile environment, surviving with few resources.
The horror survival sub-genre was chosen because it
has been proven excellent at evoking players’ intense
emotions, particularly stress (Vachiratamporn et al.,
2013).
Some stressors, such as the presence of monstrous
enemies, scary sounds and disturbing music, the lack
of visibility due to the poor lighting, and the scarcity
of resources, were accurately created to enhance a
stressful affective state in the players. Lebois et al.
(2016) argue that when typical features of stressful
situations are present, people categorize events and
situations as stressful. Under such circumstances, the
most typical features associated with a situation per-
ceived as stressful are: (a) the situation violates per-
sonal expectations, there is a discrepancy between the
1
https://store.facebook.com/it/quest/products/quest-2/
2
http://www.empatica.com/research/e4/
3
A demonstration of the recorded gameplay
can be found at https://drive.google.com/file/d/
1K-DNeWl4NNvwgorEw9AEHh 0EnwJIS50/view?
usp=sharing
CHIRA 2022 - 6th International Conference on Computer-Human Interaction Research and Applications
60
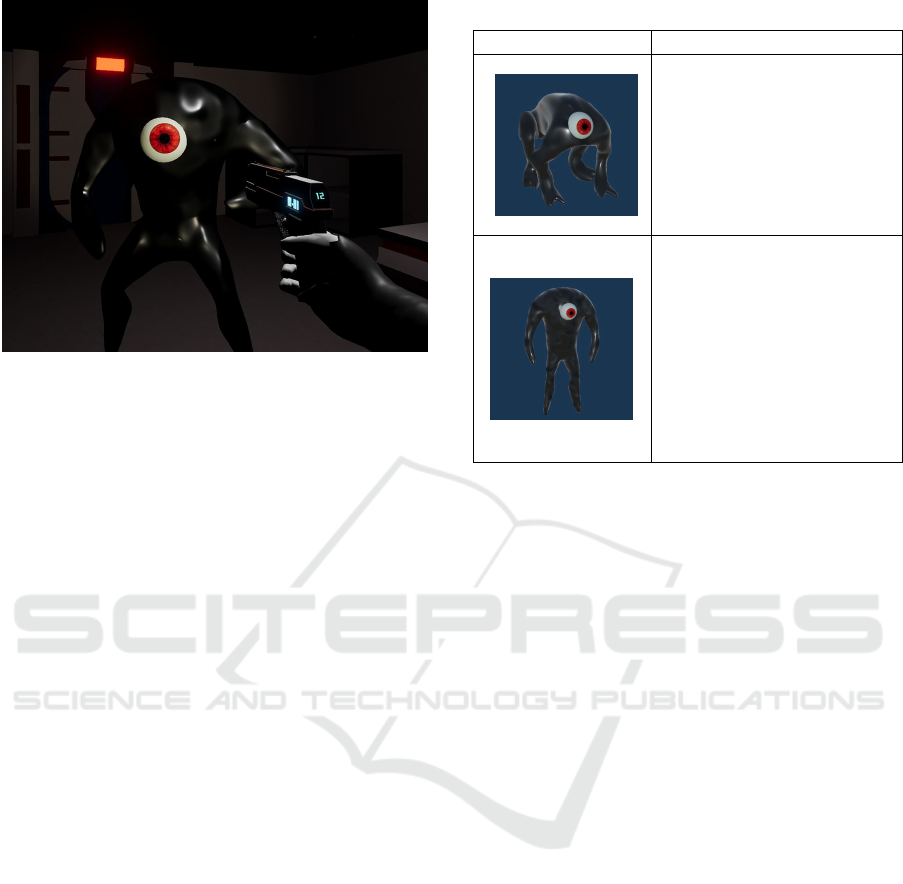
Figure 1: Screen of the video game developed for the ex-
periment.
individual’s expectation and the actual situation (Hig-
gins, 1989); (b) the situation or event threatens the
well-being of self (Lazarus, 1993); (c) the subject’s
personal resources available for coping with the sit-
uation are not sufficient (Lazarus, 1993). When the
core stress conditions are met, they produce different
responses of negative emotions and physiological re-
actions. An individual may experience anxiety, fear,
sadness, danger, or even a combination of these cate-
gorical emotions during a stressful situation. Subse-
quently, physiological changes occur in the cardiovas-
cular, endocrine, respiratory, and autonomic systems.
Stress perception is thus the result of assigning a situ-
ation to the category of a stressful experience.
The two types of enemies designed for the game
are described in Table 1. Both of them have a body
composed by black slime and a big red eye.
All the designed elements were placed on the
game map to create different phases, each one with
the aim of inducing a different stressful experience.
The structure of the map is linear: six rooms were de-
signed and divided into four stress phases (baseline,
low stress, medium stress, and high stress), arranged
so that the amount of generated stress gradually in-
creases from the first phase to the last one. The stress
phases are organized as follows.
• Baseline Phase: a little room with a terminal intro-
ducing the players to the game world. The players
are asked to put their right hand on a panel and re-
main still for 15 seconds. This expedient is used
to collect baseline data from users.
• Low Stress Phase: the astronaut’s room where the
players are safe. The oxygen does not drop and no
enemy can be sound. The light allows the players
to see quite everything, and some far noises can
be heard. All the items necessary to advance in
Table 1: The two types of enemies with their description.
DESCRIPTION
Creatures similar to a frog
with a big eye at the cen-
ter of the head. They move
quickly and attack jumping
towards the player, but they
are not really strong.
Humanoid-shaped creatures
with an eye protruding from
their torso. They are not
very agile and hit the player
by waving their arms. If
stabbed in the eye, they re-
main stunned for a few sec-
onds and stop moving.
the game (a gun, a knife, and ammunition) can be
found here.
• Medium Stress Phase: composed of two rooms
and two corridors, here the enemies are intro-
duced. The light starts to lower, and many scary
sounds come from everywhere.
• High Stress Phase: the last two rooms with a to-
tal of five enemies scattered around the areas, in
the rooms and corridors that connect them. Ap-
proaching the first room, an alarm starts to bother
the players. The oxygen runs out, and the charac-
ter begins to gasp quickly. Here, it is practically
impossible to see without using a flashlight. The
final room is the one in which there is the great-
est concentration of enemies, and it is where the
players find the escape pod.
The game session of the test is brief, lasting approx-
imately 5-10 minutes, during which all the game el-
ements and events are presented in the same way to
all players, making the experiment more controllable.
This also allows a comparison between the data ac-
quired from each different subject.
3 EXPERIMENTAL SETTING
This section covers the experimental process, provid-
ing details on the subjects, the data acquisition during
the game session, and the self-reports.
Before starting the experiment, a pilot test phase
was conducted. This was necessary to understand if
there was something to modify in order to accomplish
Between the Buttons: Stress Assessment in Video Games using Players’ Behavioural Data
61
the research goal, to check the validity of the collected
data in relation to both the temporal duration of the
game session and designed stress phases in the game.
It was especially useful to adjust the baseline phase.
The experiment lasted, at most, 30 minutes for the
participants who just annotated the stress values: 5-10
minutes for the early questionnaires, 5-10 minutes for
the game session, and 5-10 minutes for the labeling
phase (see Section 3.3, for details). For the partici-
pants who also self-assessed valence and arousal val-
ues, the experiment had a total duration of about 50
minutes.
3.1 Participants
A total of 16 volunteer students participated in the ex-
periment. Volunteers did not receive any payment or
credit for their collaboration. All of them reported
having no anxiety disorders and no neurological al-
terations. Prior to the study, participants read and
signed a consent form because biometric and demo-
graphic, personal data were handled. Before starting
the game session, participants were required to com-
plete two questionnaires: the Perceived Stress Scale
(PSS) questionnaire (Cohen et al., 1983) and a demo-
graphic questionnaire.
The first one is a standard psychological instru-
ment for measuring perceived stress and refers to feel-
ings and thoughts during the last month. From the
PSS, it resulted that all the participants felt moder-
ately stressed in their life before starting the experi-
ment.
The second questionnaire, which was designed
specifically for this work, refers to demographic and
static data about the participants. The answers indi-
cate that 15 males and 1 female in the range of 22
and 29 years, with a mean age of 24.68, took part in
the experiment. The majority of the subjects claimed
to spend, on average, around 11-20 hours per week
playing video games; two participants only declared
they never play video games. The most popular game
genres were action and adventure. Only two partici-
pants reported they like horror games. Finally, half of
the participants reported that they had never experi-
enced VR environments before the test, whilst, three
participants declared they often play VR games.
3.2 Data Acquisition
After completing the two questionnaires, each partic-
ipant was equipped with the sensors. First, they wore
the E4 on their non-dominant hand, to minimize the
movement artifacts. Then, they put on the headset
and its controllers, and instructions about the buttons
needed to play were given. During the game session,
participants were standing and could rotate freely on
themselves.
Once this preparation phase was completed, the
game, during which all the data were collected, was
started. When the participants reached the end of the
game, all the devices were removed. A problem that
can arise when using VR devices is the motion sick-
ness, which is a feeling of disorientation or nausea.
All of them, even the novices, declared that they did
not suffer from motion sickness.
3.3 Self-assessment
In order to validate the experimental protocol and to
label the data, self-reports of each participant were
collected. Indeed, asking the participants directly
about their perceived experience is the most direct
way to record their inner state.
Self-reports were collected by exploiting DANTE
4
(Dimensional ANnotation Tool for Emotions).
DANTE is a web-based annotation tool helpful for
studying affective responses in presence of a stimulus
(Boccignone et al., 2017). It provides an interactive
version of the Self-Assessment Manikin (SAM)
questionnaire (Bradley and Lang, 1994), and allows
for continuous annotation of valence and arousal by
moving a slider on a scale with values ranging from
-1 to 1 and a step of 0.001.
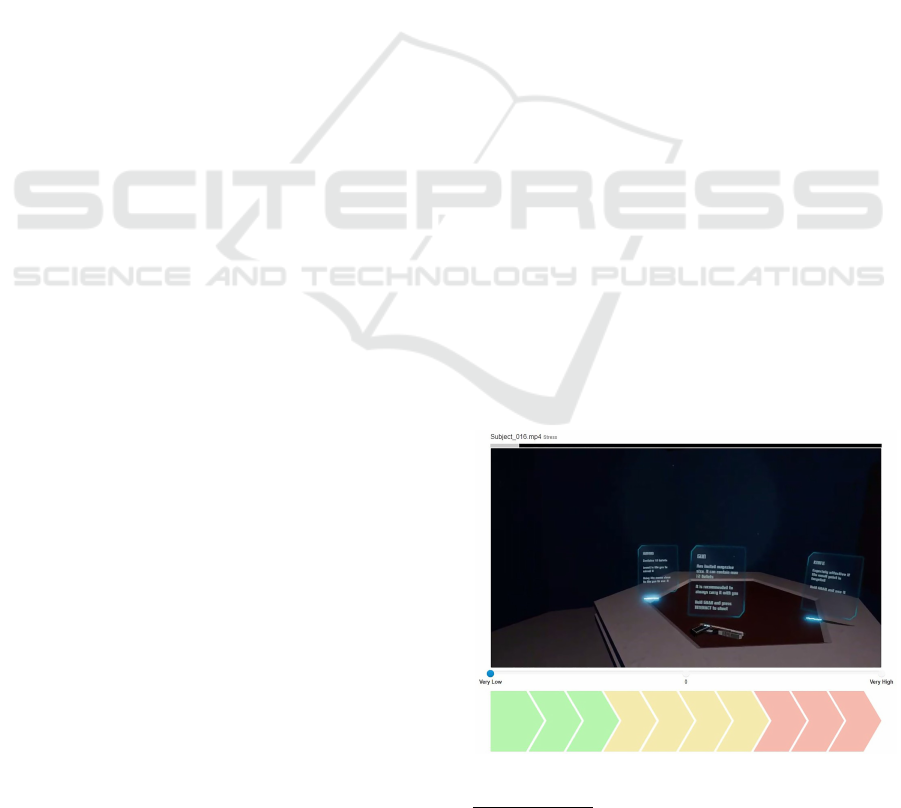
Specifically for this work, DANTE was extended
by adding a stress slider in order to allow participants
for the annotation of their own perceived stress level.
Such slider represents the continuous extension of a
perceived stress Likert scale (visualised in the form
of a color bar, cfr. Figure. 2), spanning a range from
low (-1) to high (1) stress level.
Figure 2: Self-assessment of stress using DANTE.
4
https://github.com/phuselab/DANTE
CHIRA 2022 - 6th International Conference on Computer-Human Interaction Research and Applications
62

The gameplay of each participant was recorded
during the game session and the stress label sequence
or targets over time {l
t
}
T
t=1
were collected from all
participants, while seeing their own gameplay video.
Seven participants were also asked to evaluate in
real-time their subjective emotional experiences in the
2-dimensional affective space, defined by valence and
arousal dimensions, In our context, the valence di-
mension indicates how pleasurable the gaming ex-
perience was and (negative to positive), while the
arousal dimension denotes how arousing the gaming
experience was (low to high).
4 DATA ANALYSIS
The acquired data had to be carefully scrutinized be-
fore confronting with the stress level assessment pro-
cess. Pre-processing, feature extraction, data analysis,
and feature selection are the traditional steps consid-
ered in the following.
In this paper, we focus on the data related to the
Quest 2 headset and controllers, since, in the pilot test
phase, they proved to be particularly significant for
the achievement of the initial purpose. The Quest 2
data concern movement and behavioral information.
They represent both the players’ action in the video
game (which keys are pressed and how hard) as well
as the players’ movements (basically, their rotation
with velocities and accelerations) in the real world.
The data were sampled at 64 Hz.
4.1 Preprocessing
The raw data were pre-processed in order to check
missing values, noisy data, and other inconsistencies.
The Quest 2 data and the self-assessed stress la-
bels were first synchronized using the start and end
timestamps of the experiment. The timestamps were
also saved after each stress phase to make it possible
to separate the data related to different stress levels.
Then, the data were standardized using the base-
line signal, with the Z-score (or standard score)
method, first participant-wise and then using the
whole subjects’ data. Using the baseline to standard-
ize data provides a common reference for further pro-
cessing of each feature.
4.2 Feature Extraction
All signals were segmented using a sliding window
with a size of 6 seconds and a shift of 1 second. Since
the system was designed to be used in real-time dur-
ing the game session and require a fast response to
identify stress, a small window size was chosen.
There is a limited literature on the feature extrac-
tion process for the data gathered from Quest 2. Thus,
we selected the most significant statistical features for
all the data obtained from head and left/right hands:
mean, standard deviation, minimum and maximum
values are used, as well as the average number of
times the buttons were pressed within the designated
time period. The features extracted for each category
of data are shown in Table 2.
Table 2: List of the features extracted from the data col-
lected from Quest 2. Abbreviations: h = head, lh = left
hand, rh = right hand, vel = velocity, acc = acceleration, ang
= angular, press = pressure, pos = position, std = standard
deviation, # = number.
Data Feature Description
h vel
h ang vel
h acc
h ang acc
lh/rh vel
lh/rh ang vel
lh/rh acc
lh/rh ang acc
lh/rh grip press
lh/rh trigger press
lh/rh thumbstick pos x
lh/rh thumbstick pos y
µ
σ
min
max
mean
std
min value
max value
lh/rh grip pressed
lh/rh trigger pressed
µ#press mean of the
# of times
the button
is pressed
After the extraction step, the features were nor-
malized by scaling and translating them in the range
between 0 and 1.
4.3 Statistical Analysis
A preliminar statistical analysis was conducted on
the features that were extracted. This task was com-
pleted using Autorank
5
(Herbold, 2020). Autorank
is a Python package used to automatically compare
paired populations. The package analyzes the distri-
bution of the data and automatically decides which
tests to perform. The first populations compared co-
incide with the stress phases. The means of all the
extracted features from the Quest 2 data were used.
Each subject’s data was first analyzed individually,
and all the subjects’ data were then combined to per-
form the analysis. This analysis produced no useful
5
https://github.com/sherbold/autorank
Between the Buttons: Stress Assessment in Video Games using Players’ Behavioural Data
63

findings. We surmise that this outcome might be due
to the fact that the stress experienced during a certain
game phase is not continuous throughout it. So, when
comparing the complete temporal sequence of one
phase with another, no relevant differences are likely
to emerge. Then, samples were drawn from subjects
with different VR-experience level (experienced and
non-experienced). This value was extracted from the
demographic questionnaire. To carry out the compar-
ison, an analysis for each stress level was carried out.
Even in this case, no statistically significant differ-
ences emerged, most likely because of the gap be-
tween more experienced and less experienced sub-
jects is not very great.
Subsequently, data were analyzed by comparing
their correlations. Pearson correlation was used. Cor-
relation matrices were computed first for every sin-
gle subject, and then combining the subjects’ data to-
gether, first dividing the stress phases and then us-
ing them together. According to the analyses car-
ried out by differentiating the four designed levels
of stress, it appears that, in general, all the features
correlate better with the perceived stress level in the
baseline phase and the high stress phase. Even using
the stress phases together, a good level of correlation
emerged with some of the features. In the last study,
participants who assessed their emotional state using
valence and arousal in addition to stress were used.
Their data were separated from those of the other par-
ticipants to examine the correlation between valence
and arousal levels and self-reported stress level. In
all cases, the arousal level correlates positively with
the stress level. By contrast, the correlation between
valence and stress level can be either positive or neg-
ative, depending on whether the subject enjoys or not
the horror games. A good degree of correlation re-
sults between the features and the valence level and,
even more markedly, between the features and arousal
level, which raises the possibility of further analyses.
4.4 Feature Selection
The final step in processing the extracted features in-
volved selecting the most relevant ones. In this work,
a filter approach was used. Since the relationship (i.e.
the correlation) between each numerical feature as in-
put and the target label (the stress level) had been cal-
culated, it could be used to select the most informative
subset of the original features. Univariate feature se-
lection was performed. The p-values and the F-scores
were computed. The features with a p-value less than
0.05 and the higher score were selected. In the Tab.3,
all the features selected to be used as the input of the
learning models are shown.
5 MODEL-BASED STRESS
ASSESSMENT
We assume a State Space Model (SSM) for stress
level dynamics. Namely, we use a partially observed
Markov model, in which the hidden state s
t
is a
random variable that evolves over time according to
a Markov process and each hidden state generates
some behavioural observations, the random vector y
t
at each time step (in what follows to avoid cumber-
some notation we do not distinguish, unless needed,
between a RV X and its realization X = x). In brief, a
general SSM defines the joint distribution
P(y
1:T
, s
1:T
) = P(s
1
)
T
∏
t=1
P(y
t
| s
t
)P(s
t
| s
t
1
), (1)
where P(s
t
| s
t
1
) is the state transition model and P(y
t
|
s
t
) is the behavioural observation model.
Here we are interested in exploiting the SSM to
perform posterior inference about the hidden states
or stress level state estimation. In particular, it can
be used either for online inference, by inferring the
probability of the hidden state s
t
at current time t < T
via the filtering posterior distribution P(s
t
|y
1:t
), or to
estimate s
t
, at any time t ∈ [1, T ], given the full se-
quence of observations, via the smoothing distribu-
tion P(s
t
|y
1:T
).
Further, the SSM is a suitable approach since it
allows characterising stress level s
t
either as a discrete
RV or a continuous RV. The former can be exploited
to segment/classify the behavioural observations into
a finite set of stress states; the latter can be used in the
service of continuously tracking stress level dynamics
over time.
For the simulations reported in the present work
we adopted the Hidden Markov Model (HMM, see
Bishop, 2006 for a review) and a variant of the
Kalman Filter (KF), the Discriminative Kalman Fil-
ter (DKF, Burkhart et al., 2020) as implementation
models of the discrete and the continuous SSM, re-
spectively.
It is worth noting, that, in principle, more complex
implementation models (e.g., resorting to deep neural
nets-based models, Girin et al., 2021) could be used,
provided that, different from here, a sufficiently large
dataset is available.
5.1 Simulation Details
5.1.1 Discrete Characterization of Stress
Dynamics
HMM is an extensively used technique to model tem-
poral information (Bishop, 2006), in particular for
CHIRA 2022 - 6th International Conference on Computer-Human Interaction Research and Applications
64

Table 3: List of the features. The ones selected to be given as input to the learning models are checked with a ✗. Abbreviations:
vel = velocity, acc = acceleration, ang = angular, press = pressure, pos = position, # = number.
TYPE DATA FEATURE
µ σ min max µ#press
head
vel ✗ ✗ ✗ ✗
ang vel ✗ ✗ ✗ ✗
acc ✗ ✗ ✗ ✗
ang acc ✗ ✗ ✗ ✗
left
hand
vel ✗ ✗ ✗ ✗
ang vel ✗ ✗
acc ✗ ✗ ✗ ✗
ang acc ✗ ✗ ✗ ✗
grip press ✗ ✗ ✗ ✗
trigger press ✗ ✗ ✗
thumbstick pos x ✗ ✗ ✗ ✗
thumbstick pos y ✗ ✗ ✗ ✗
grip pressed ✗
trigger pressed ✗
right
hand
velocity ✗ ✗ ✗ ✗
ang vel ✗ ✗ ✗ ✗
acc ✗ ✗ ✗ ✗
ang acc ✗ ✗ ✗ ✗
grip press ✗ ✗ ✗
trigger press ✗ ✗ ✗ ✗
thumbstick pos x ✗
thumbstick pos y
grip pressed ✗
trigger pressed ✗
speech recognition or facial expressions recognition
applications, and it has been used before in video
games by Mishra and Ratnaparkhi (2018) for real-
time recognition of players’ emotions.
Here, we exploited the HMM implementation pro-
vided by the hmmlearn
6
library; the behavioural ob-
servation distribution was assumed to be continuous
and Gaussian, P(y
t
| s
t
= j) = N (y
t
| µ
j
, Σ
j
), µ
j
, Σ
j
being the mean and covariance, respectively, of the
observation y
t
conditioned on the j-th state.
In the discrete setting, the stress assessment via
HMM can be conceived in broad terms as that of solv-
ing a classification problem.
To this end, experiments were conducted with dif-
ferent number of discrete states (classes). First, a bi-
nary stress vs no-stress classification was performed.
Next, three classes, i.e. no-stress vs low stress vs high
stress, were used. Finally, a multiclass problem was
solved, with the classes identifying the stress phases
of the game partition.
In order to employ the HMM for classification
purposes, label values where discretized into different
levels and a separate model was built for each class
and trained on the class samples, separating each sub-
6
https://github.com/hmmlearn/hmmlearn
ject’s sequence of observation to preserve the tempo-
ral information.
Leave-One-Out Cross-Validation (LOOCV) was
applied. The learning was performed once for each
subject, using the selected subject as a test set and all
the others as a training set. Then, the estimate of the
performance of each model was computed by averag-
ing the scores over all the trials.
The training process was repeated as many times
as the number of subjects. Each model was trained us-
ing the forward-backward algorithm. The parameters
were initialized randomly.
After training, each test sequence was scored in
relation to each model. The log-likelihood of the
sequence given as input was returned with respect
to the model in use. The test set was then classified
in the class of the model returning the highest
log-likelihood result. The overall accuracy was then
calculated by comparing the predicted stress labels to
the actual stress labels. This accuracy was given as
the average of the accuracy of all the models trained
across all LOOCV iterations.
Between the Buttons: Stress Assessment in Video Games using Players’ Behavioural Data
65

5.1.2 Continuous Characterization of Stress
Dynamics
The DKF is a novel filtering method that provides
a fast, analytic approximation for models with lin-
ear, gaussian dynamics but nonlinear, nongaussian
observations. For continuous SSMs, the conditional
distribution P(s
t
| y
1:t
) can be expressed recursively
using Bayes’ rule, P(s
t
| y
1:t
) =
P(y
t
|s
t
)P(s
t
|y
1:t−1
)
P(y
t
|y
1:t−1
)
,
together with the Chapman-Kolmogorov equation,
P(s
t
| y
1:t−1
) =
R
P(s
t
| s
t−1
)P(s
t−1
| y
1:t−1
)ds
t−1
. The
standard KF models the densities P(s
t
| s
t−1
) and
P(y
t
| s
t
) as linear and gaussian so that the poste-
rior P(s
t
| y
1:t
) is also Gaussian and efficiently com-
putable. The DKF is based on the key approximation
for the likelihood
P(y
t
| s
t
) = P(y
t
)
P(s
t
| y
t
)
P(s
t
)
≈ k(y
t
)
N (s
t
| f (y
t
), Q(y
t
))
N (s
t
| 0, S)
(2)
where k(·) is a normalizing constant, f (·), Q(·)
the conditional mean and covariance of s
t
, respec-
tively. The advantage of such approximation is that
f (·), Q(·), and S are easier to learn from training data
than the full conditional density (see Burkhart et al.,
2020 for details). In particular, the conditional mean
f can be learned using a number of regression meth-
ods; here we adopted a neural network regression
(Burkhart et al., 2020).
Before DKF training, the signals were smoothed
by applying the Savitzky-Golay filter (Savitzky and
Golay, 1964). To evaluate the performance of the
model, the normalized Root Mean Squared Error
(nRMSE) was calculated. DKF was trained as many
times as the number of LOOCV iterations, and the
average of all the computed nRMSE values for each
iteration was used to determine the overall nRMSE
value.
6 RESULTS AND DISCUSSION
Results of the evaluation of the models are presented
in this section, along with a discussion on the impor-
tance of each individual device. Only the stress labels
were taken into account for the evaluation, and differ-
ent tests were run for each model.
6.1 Discrete SSM Performance
In order to evaluate the results of in terms of clas-
sification, confusion matrices and accuracy scores
were reported. Based on the affective states designed
for the different game phases, different classification
tasks were distinguished:
1. using baseline, low stress, medium stress, and
high stress as classes, a four-class problem was
defined;
2. using baseline, low stress, and high stress as
classes, a three-class problem was defined;
3. using the baseline condition acting as the no-stress
class and the other states acting as the stress class,
a binary problem was defined.
Each setup defined by the classification prob-
lem was run sixteen times (the number of folds in
LOOCV), and the accuracy measures are averaged
over all runs of the repeated LOOCV.
As it can be seen in Figure 3a, the first classifi-
cation task revealed that the collected VR-based data
perform better for the high stress condition. The
features have difficulties, in fact, in distinguishing
between different stress levels, particularly the low
stress state.
Figure 3b shows the results of the second classi-
fication problem. The model proved to be valid at
recognizing the data in the high stress class and quite
good at recognizing the baseline data. In this case, a
great deal of the low stress data is incorrectly classi-
fied as high stress.
The third classification task is the one that led to
the best results, which are shown in the confusion ma-
trix illustrated in Figure 3c. The algorithm proves to
be able to discriminate between the two classes, the
best score is achieved with the baseline class.
In Table 4, the accuracy scores for all the de-
scribed classification tasks are reported.
The binary problem was the one in which the
model performed better, reaching the accuracy of
84.4%. Overall, results provided evidence that dis-
crete SSMs were good at distinguishing between a
state of stress and a state of baseline, but they could
hardly classify different stress levels.
Table 4: Accuracy scores of the model for all the classifica-
tion tasks.
Accuracy score
Four-class Three-class Two-class
50.0 56.2 84.4
6.2 Continuous SSM Performance
As a preliminary qualitative evaluation, the actual
label curve {l
t
}
T
t=1
, defining the self-assessed stress
level, and the predicted stress curve were also plot-
ted and compared with the purpose of visualizing and
scrutinizing the results.
The two curves were plotted for each fold of
LOOCV procedure, hence for each test subject. Fig-
CHIRA 2022 - 6th International Conference on Computer-Human Interaction Research and Applications
66
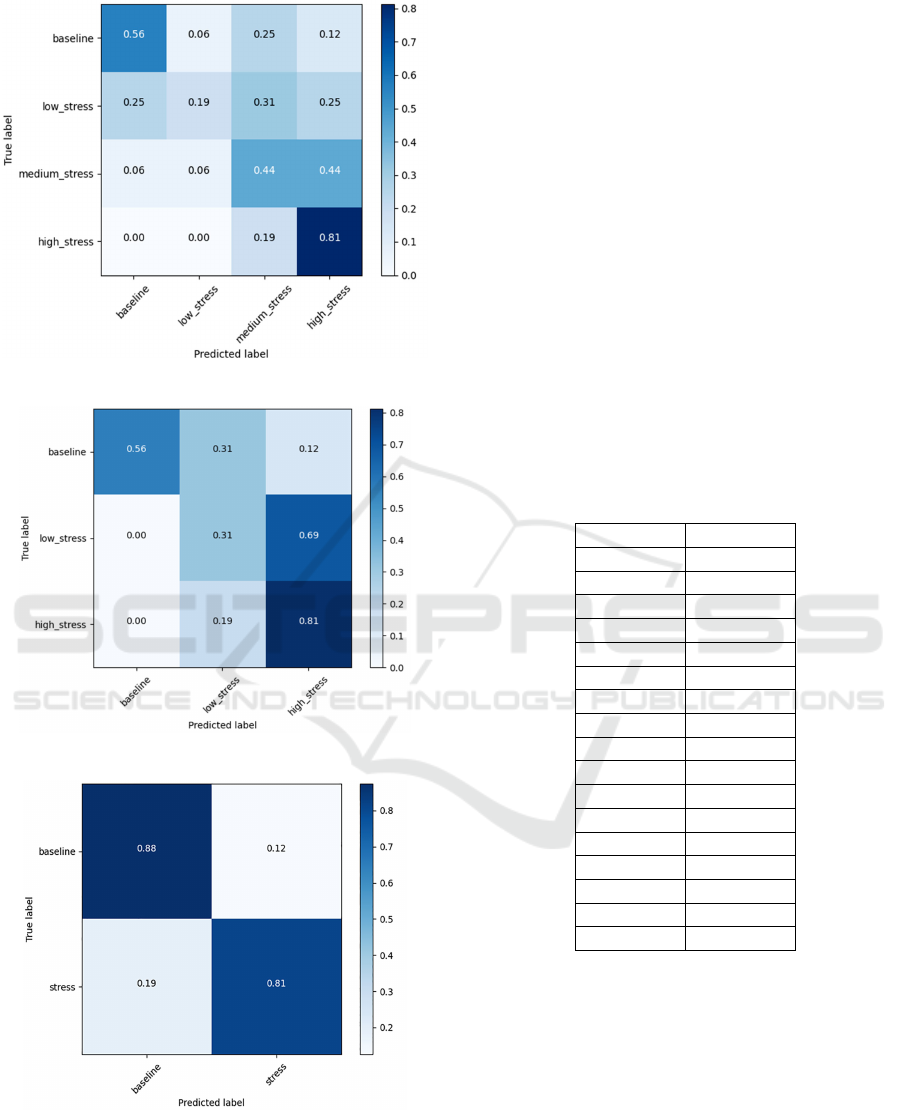
(a) Confusion matrix of the four-class problem.
(b) Confusion matrix of the three-class problem.
(c) Confusion matrix of the two-class problem.
Figure 3: Confusion matrices of all the classification tasks
using VR-based features.
ure 4 shows one typical example of the inferred latent
stress level dynamics, which refers to the trial involv-
ing subject 13 as the test and all the other subjects as
training set. The red line indicates the inferred stress
curve, whilst the blue line represents the actual label
curve {l
t
}
T
t=1
. Even though the model was able to
identify the general trend of the stress level dynam-
ics, these results suggest that the continuous SSM is
not accurate enough, at least in the current experimen-
tal setting, to make the model fully reliable for game
control purposes.
A quantitative evaluation was thus performed in
terms of the nRMSE values obtained by comparing
the target (self-assessment) and estimated perceived
stress curves. The computed nRMSE values are re-
ported in Table 5. The three different input types are
compared, nRMSE was calculated for each iteration
of LOOCV process using each subject as test set in
turn, and then the nRMSE average with respect to all
the iterations was computed.
Table 5: The nRMSE values computed for each trial in
which the DKF model was run. Subject column indicates
the subject who was left out during LOOCV iteration, and
AVG is the average value across all trials.
subject nRMSE
01 0.44
02 0.39
03 0.59
04 0.42
05 0.61
06 0.49
07 0.89
08 0.57
09 0.60
10 0.73
11 0.50
12 0.45
13 0.43
14 0.44
15 1.0
16 0.80
AVG 0.57
6.3 Discussion
The VR-based data provide quite generalizable mea-
sures: behavioral and movement data, such as con-
trollers and head velocities, which keys are pressed
and at what pressure level, are indicative of the users’
emotional states. Information gathered from Quest 2
devices proved to be useful to identify the perceived
stress level of the players. This suggests that, in the
context of video games, the VR-based features can
offer a rich understanding of the affective states. The
Between the Buttons: Stress Assessment in Video Games using Players’ Behavioural Data
67
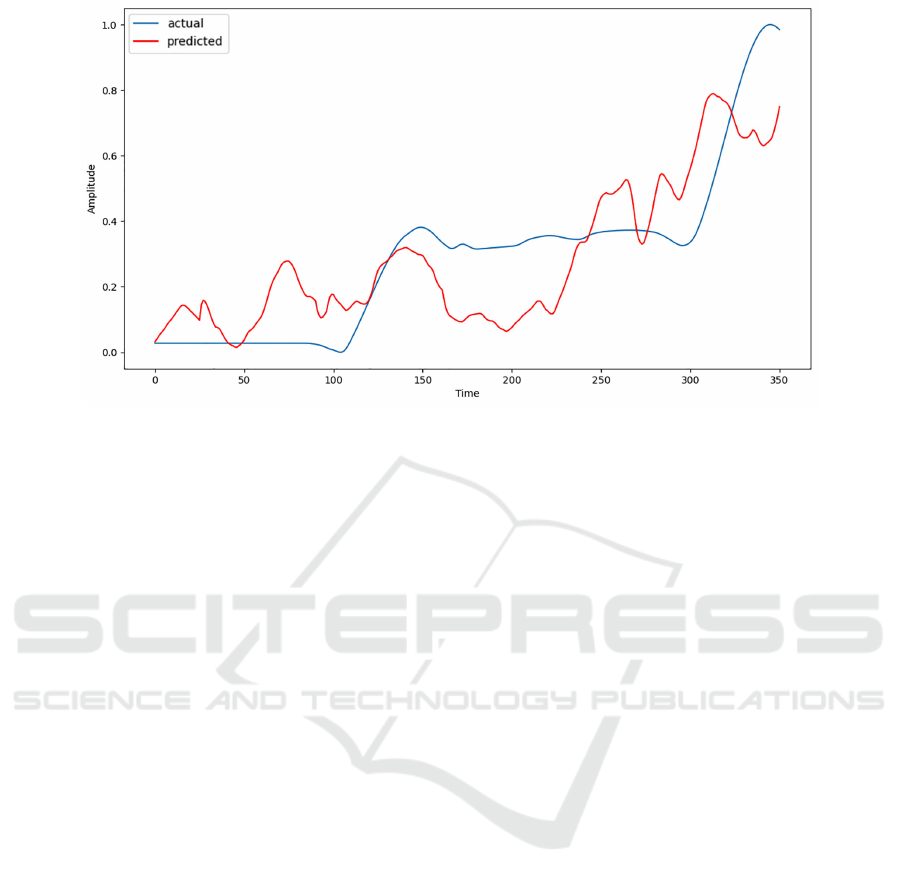
Figure 4: Curves of the actual stress labels and the stress labels predicted by DKF for the VR-based features, using subject 13
as test set.
analyzed context, in fact, differs from any other real
context, and players’ mental states are strongly re-
lated to game events and actions they can do.
7 CONCLUSION
The present work aimed at a preliminary investiga-
tion concerning the assessment of players’ perceived
stress level in VR-based video games. The developed
systems can in principle be applied to video games of
the same genre, with the same structure and elements
as the one developed in this project: a survival hor-
ror video game with a baseline phase for calibration
and stress elements established on the features of per-
ceived stress defined by Lebois et al. (2016).
When comparing how the utilized algorithms per-
formed on the various tasks, it becomes apparent that
the binary state discrete model produced the highest
accuracy scores. The achieved classification accura-
cies are up to 84.4% using the VR-based data.
In conclusion, the results obtained are encourag-
ing and this preliminary study can be useful as a start-
ing point for future research. Further work is required
to gather more data from a major number of subjects,
and to take the questionnaires into account. Question-
naire answers were not included in the development
of the presented model. Training the models using
different classes of players who have the same pro-
file (Yannakakis and Togelius, 2018) would result in
a more personalized experience.
The potential benefits of the explored approach
are twofold: a system incorporating a stress-
dependent control can adapt the content of the game
in response to the players’ experiential state; stress
level modelling/inference can help in developing new
game mechanics relying on such index to provide a
customized experience for players.
Video games are increasingly being used in the
field of mental health (Colder Carras et al., 2018;
Pallavicini et al., 2018a). The enjoyment and intrinsic
motivation often associated with video games make
them a powerful and attractive tool to provide psycho-
logical support to people. According to studies, video
games can help individuals cope with their stressful
life experiences (Pallavicini et al., 2021; Maarsingh
et al., 2019). A stress-based serious game that incor-
porates biofeedback techniques into the game could
assist people with stress to handle their emotional and
physiological responses to stressors, improving their
abilities in everyday life and their mental health.
Ongoing research is focused on two aspects. The
first concerns the integration of physiological infor-
mation (electrodermal activity) with behavioural data
for stress level assessment. This aspect paves the
way to consider the relationship between the stress
response and the affective state of the user.
The second, more generally, relates to the use of
stress/affective assessment for the development of af-
fective feedback-based video games. In this perspec-
tive, feedback from players’ affective states (Bersak
et al., 2001) is incorporated into the development
of new game content and mechanics, manipulating
gameplay so to keep the players in the flow state.
CHIRA 2022 - 6th International Conference on Computer-Human Interaction Research and Applications
68

REFERENCES
Ahmed, F., Bari, A. H., and Gavrilova, M. L. (2019). Emo-
tion recognition from body movement. IEEE Access,
8:11761–11781.
Bersak, D., McDarby, G., Augenblick, N., McDarby,
P., McDonnell, D., McDonald, B., and Karkun, R.
(2001). Intelligent biofeedback using an immersive
competitive environment. In Paper at the designing
ubiquitous computing games workshop at UbiComp,
pages 1–6. Citeseer.
Bishop, C. M. (2006). Pattern Recognition and Ma-
chine Learning (Information Science and Statistics).
Springer-Verlag New York, Inc., Secaucus, NJ, USA.
Boccignone, G., Conte, D., Cuculo, V., and Lanzarotti, R.
(2017). Amhuse: a multimodal dataset for humour
sensing. In Proceedings of the 19th ACM Interna-
tional Conference on Multimodal Interaction, pages
438–445.
Bradley, M. M. and Lang, P. J. (1994). Measuring emotion:
the self-assessment manikin and the semantic differ-
ential. Journal of behavior therapy and experimental
psychiatry, 25(1):49–59.
Burkhart, M. C., Brandman, D. M., Franco, B., Hochberg,
L. R., and Harrison, M. T. (2020). The discrimina-
tive kalman filter for bayesian filtering with nonlinear
and nongaussian observation models. Neural compu-
tation, 32(5):969–1017.
Cohen, S., Kamarck, T., and Mermelstein, R. (1983). A
global measure of perceived stress. Journal of health
and social behavior, pages 385–396.
Colder Carras, M., Van Rooij, A. J., Spruijt-Metz, D.,
Kvedar, J., Griffiths, M. D., Carabas, Y., and Labrique,
A. (2018). Commercial video games as therapy:
A new research agenda to unlock the potential of a
global pastime. Frontiers in psychiatry, 8:300.
Csikszentmihalyi, M. and Csikzentmihaly, M. (1990).
Flow: The psychology of optimal experience, volume
1990. Harper & Row New York.
Frommel, J., Schrader, C., and Weber, M. (2018). Towards
emotion-based adaptive games: Emotion recognition
via input and performance features. In Proceedings
of the 2018 Annual Symposium on Computer-Human
Interaction in Play, pages 173–185.
Fullerton, T. (2014). Game design workshop: a playcentric
approach to creating innovative games. CRC press.
Girin, L., Leglaive, S., Bie, X., Diard, J., Hueber, T., and
Alameda-Pineda, X. (2021). Dynamical variational
autoencoders: A comprehensive review. Foundations
and Trends in Machine Learning, 15(1-2):1–175.
Herbold, S. (2020). Autorank: A python package for auto-
mated ranking of classifiers. Journal of Open Source
Software, 5(48):2173.
Higgins, E. T. (1989). Self-discrepancy theory: What pat-
terns of self-beliefs cause people to suffer? In Ad-
vances in experimental social psychology, volume 22,
pages 93–136. Elsevier.
Karg, M., Samadani, A.-A., Gorbet, R., K
¨
uhnlenz, K.,
Hoey, J., and Kuli
´
c, D. (2013). Body movements for
affective expression: A survey of automatic recogni-
tion and generation. IEEE Transactions on Affective
Computing, 4(4):341–359.
Kleinsmith, A. and Bianchi-Berthouze, N. (2012). Affec-
tive body expression perception and recognition: A
survey. IEEE Transactions on Affective Computing,
4(1):15–33.
Lazarus, R. S. (1993). From psychological stress to the
emotions: A history of changing outlooks. Annual
review of psychology, 44(1):1–22.
Lebois, L. A., Hertzog, C., Slavich, G. M., Barrett, L. F.,
and Barsalou, L. W. (2016). Establishing the situated
features associated with perceived stress. Acta Psy-
chologica, 169:119–132.
Maarsingh, B. M., Bos, J., Van Tuijn, C. F., and Renard,
S. B. (2019). Changing stress mindset through stress-
jam: a virtual reality game using biofeedback. Games
for health journal, 8(5):326–331.
Mar
´
ın-Morales, J., Llinares, C., Guixeres, J., and Alca
˜
niz,
M. (2020). Emotion recognition in immersive virtual
reality: From statistics to affective computing. Sen-
sors, 20(18):5163.
Mishra, P. and Ratnaparkhi, S. (2018). Hmm based emotion
detection in games. In 2018 3rd International Con-
ference for Convergence in Technology (I2CT), pages
1–4. IEEE.
Pallavicini, F., Ferrari, A., and Mantovani, F. (2018a).
Video games for well-being: A systematic review on
the application of computer games for cognitive and
emotional training in the adult population. Frontiers
in psychology, 9:2127.
Pallavicini, F., Ferrari, A., Pepe, A., Garcea, G., Zanacchi,
A., and Mantovani, F. (2018b). Effectiveness of vir-
tual reality survival horror games for the emotional
elicitation: Preliminary insights using resident evil 7:
Biohazard. In International Conference on Universal
Access in Human-Computer Interaction, pages 87–
101. Springer.
Pallavicini, F., Pepe, A., Mantovani, F., et al. (2021). Com-
mercial off-the-shelf video games for reducing stress
and anxiety: systematic review. JMIR mental health,
8(8):e28150.
Savitzky, A. and Golay, M. J. (1964). Smoothing and dif-
ferentiation of data by simplified least squares proce-
dures. Analytical chemistry, 36(8):1627–1639.
Schell, J. (2008). The Art of Game Design: A book of lenses.
CRC press.
Sykes, J. and Brown, S. (2003). Affective gaming: mea-
suring emotion through the gamepad. In CHI’03 ex-
tended abstracts on Human factors in computing sys-
tems, pages 732–733.
Vachiratamporn, V., Legaspi, R., Moriyama, K., and Nu-
mao, M. (2013). Towards the design of affective sur-
vival horror games: An investigation on player af-
fect. In 2013 Humaine Association Conference on Af-
fective Computing and Intelligent Interaction, pages
576–581. IEEE.
Yannakakis, G. N. and Togelius, J. (2018). Artificial intelli-
gence and games, volume 2. Springer.
Between the Buttons: Stress Assessment in Video Games using Players’ Behavioural Data
69
