
Condition based Maintenance on Data Streams in Industry 4.0
Nadeem Iftikhar
a
and Adrian Mihai Dohot
Department of Computer Science, University College of Northern Denmark, Sofiendalsvej 60, Aalborg, Denmark
Keywords:
Predictive Maintenance, Condition Monitoring, Smart Manufacturing, Sensor Data, Unlabeled Data,
Unsupervised Machine Learning.
Abstract:
An asset failure is costly for the manufacturing industry as it causes unplanned downtime. Unplanned down-
time halts production lines, and can lead to productivity loss. One of the widely used methods to reduce
downtime is to make use of condition based maintenance. The goal of condition based maintenance is to mon-
itor as well as detect present and/or upcoming asset failures and thus reduce unplanned downtime. A newly
emerged phenomena is to monitor the asset condition at real-time. Thus, this paper presents the techniques
to process data-in-motion in order to monitor the health and condition of industrial assets in real-time. The
techniques presented in this paper require no historical and/or labeled data and work well on streaming data.
1 INTRODUCTION
The most common cause of unplanned downtime is
a breakdown of an asset. Asset failures cost around
$1 trillion USD per year, globally. Further, accord-
ing to Alexander Hill, chief global strategist at Sens-
eye
1
“unplanned downtime is the curse of the in-
dustrial sector.”
2
In order to minimize unplanned
downtime and unscheduled maintenance, many large
enterprises set condition based maintenance as their
strategic objective. On the other hand, small and
medium sized enterprises (SMEs) are lagging be-
hind. SMEs lagged behind due to lack of manage-
ment commitment, shortfall of skills and financial re-
sources, restraint from adopting Industry 4.0 and so
on. Hence, manageable and feasible approaches to
condition based maintenance are required for SMEs.
In order to monitor the health and condition of
an asset the following four terms/strategies are com-
monly used: (1) condition monitoring (CM); (2) con-
dition based monitoring (CBM); (3) predictive main-
tenance (PdM); and (4) condition based maintenance
(CbM). These terms are often used interchangeably
and without clarity. CM and CBM are identical and
focus on real-time/current health and condition of an
asset, while PdM focuses on predicting the upcom-
ing defects, such as remaining useful life (RUL) or
a
https://orcid.org/0000-0003-4872-8546
1
https://www.senseye.io
2
https://www.assemblymag.com/articles/96518-
equipment-failure-is-costly-for-manufacturers
time-to-failure (TTF) of an asset. CbM is the um-
brella term. CbM could be CM/CBM-based or PdM-
based. CbM may use CM-based thresholds to avoid
immediate (current) asset failures and/or PdM-based
predictions to avoid upcoming (future) asset failures.
Traditional machine learning (ML) based predic-
tive maintenance techniques require historical and/or
labeled data for training purposes in order to identify
patterns to forecast upcoming machine failures. In
spite of that, new streaming ML approaches that do
not need historical and/or labeled data for PdM are
emerging, instead they can use streaming data for on-
line model training and predictions. The online model
will be trained/retrained in real-time after adequate
data has been collected. This will constantly refine
predictions as the data volume grows. Moreover, due
to the lack of historical and/or labeled data, CM/CBM
also seems a feasible solution that allows monitoring
and diagnostics of assets, consequently diverting un-
planned shutdowns.
To summarize, the main contributions in this pa-
per are as follows: (1) presenting a scalable and
streaming data pipeline to handle ingestion; process-
ing and analysis; (2) presenting monitoring tech-
niques to focus on the real-time condition of assets
to avoid costly production line disruptions; and (3)
building predictive capabilities for early detection of
asset failures solely using streaming and unlabeled
data.
The paper is structured as follows. Section 2
presents the related work. Section 3 presents the
Iftikhar, N. and Dohot, A.
Condition based Maintenance on Data Streams in Industry 4.0.
DOI: 10.5220/0011553500003329
In Proceedings of the 3rd International Conference on Innovative Intelligent Industrial Production and Logistics (IN4PL 2022), pages 137-144
ISBN: 978-989-758-612-5; ISSN: 2184-9285
Copyright
c
2022 by SCITEPRESS – Science and Technology Publications, Lda. All rights reserved
137

streaming data pipeline architecture. Section 4
presents the condition based maintenance techniques.
Section 5 concludes the paper and points out the fu-
ture research directions.
2 RELATED WORK
This section mainly concentrates on the previous
work done in relation to CbM, CM and PdM in In-
dustry 4.0. A comprehensive review by (Butler et al.,
2022) outlined the techniques that recent research
presents for CM, diagnostics and prognostics. A work
by (Dinardo et al., 2018) proposed a prognostic ap-
proach to detect faults in rotating machines. The
approach is based on continuous vibration monitor-
ing using statistical methods. Deep learning based
methods have been used for CM by (Serin et al.,
2020). ML architecture for PdM based on random
forest is proposed by (Paolanti et al., 2018). Simi-
larly, various supervised ML algorithms such as, lo-
gistic regression, neural networks, support vector ma-
chines, decision trees and k-nearest neighbors were
applied to predict costly production line disruptions
(Iftikhar et al., 2019). The accuracy of the proposed
ML models were tested on a real-world data set with
promising results. Further, supervised machine learn-
ing based anomaly detection is presented by (Pittino
et al., 2020). Outlier detection in sensor data us-
ing ensemble learning is presented by (Iftikhar et al.,
2020). An online anomaly detection using periodic
auto-regression model based on lambda architecture
is introduced by (Liu et al., 2016). (Boniol et al.,
2021) proposed a novel unsupervised online method
for sub-sequence anomaly detection in streaming se-
quences. The proposed method has the ability to iden-
tify single and recurrent anomalies without any prior
knowledge of the anomaly characteristics. An unsu-
pervised real-time anomaly detection algorithm con-
sisting of long short-term memory (LSTM) autoen-
coder is proposed by (Hsieh et al., 2019). Further, a
novel unsupervised approach for online outlier detec-
tion in streaming data is presented by (Guo and Shen,
2022). The approach performs well on real-time out-
lier detection with no need for historical/labeled data.
Furthermore, problems and future directions with
respect to CM in Industry 4.0 are highlighted by (Pi-
menov et al., 2022). The most significant issues pre-
sented in their work that needs further research and
attention are: small data-sets, unlabeled instances and
tuning of ML model without the assistance of experts
(in other words ML models should be easy-to-use
and easy-to-maintain). Similarly, a survey by (Chat-
terjee and Ahmed, 2022), pointed out that an online
anomaly detection approach that can achieve detec-
tion accuracy comparable to that of supervised ap-
proaches is desirable.
The focus of the previous works is on various
aspects and recent advancements of CbM, CM and
PdM. Most of these works focus on the use of CM
and PdM in medium and large enterprises as they
are somewhat difficult to implement and/or maintain.
On the other hand, the work presented in this paper
emphasises on the realistic, easy-to-use and easy-to-
maintain CM and PdM techniques in SMEs. In addi-
tion, this paper answers most of the challenges with
respect to unlabeled data, streaming data and lack of
historical data.
3 STREAMING DATA PIPELINE
ARCHITECTURE
This section provides insight into the approach taken
to build a complete scalable pipeline of relevant tools
and techniques to analyze and visualize streaming
data. In order to build a stream processing pipeline,
there are two well known architectures lambda archi-
tecture (Marz and Warren, 2015) and kappa architec-
ture (Lin, 2017). Lambda architecture has the abil-
ity to handle real-time and batch data processing re-
quirements. It consists of three layers speed, batch
and serving. Lambda architecture captures as well
as persists data before feeding it to the batch and
stream processing layers in parallel. In lambda archi-
tecture a copy of the raw input data is retained perma-
nently and unchanged (master storage). The main is-
sue with lambda architecture is maintenance. For the
reason that data processing and data transformation
logic and code are duplicated at two different layers
(speed and batch) and these layers normally use dif-
ferent tools/technologies. Kappa architecture on the
other hand, captures data (events in Kappa terminol-
ogy) into an unified log (scalable queue) and fed to the
stream processing layer only. The log is immutable
and append-only. There is no batch layer in kappa ar-
chitecture, hence only one layer has to be maintained,
which is responsible for both real-time and batch pro-
cessing with a single set of tools/technologies. In this
paper, kappa has been used as a scalable streaming
data pipeline architecture. The kappa architecture and
data flow is presented in Fig. 1. The architecture con-
sists of four main modules: (1) IoT sensor network;
(2) persistence and append only message bus for stor-
ing event streaming data for long periods of time; (3)
stream processing to process the latest streaming data
in real time and update the serving layer (analysis
ready data store); and (4) analysis ready data store
IN4PL 2022 - 3rd International Conference on Innovative Intelligent Industrial Production and Logistics
138
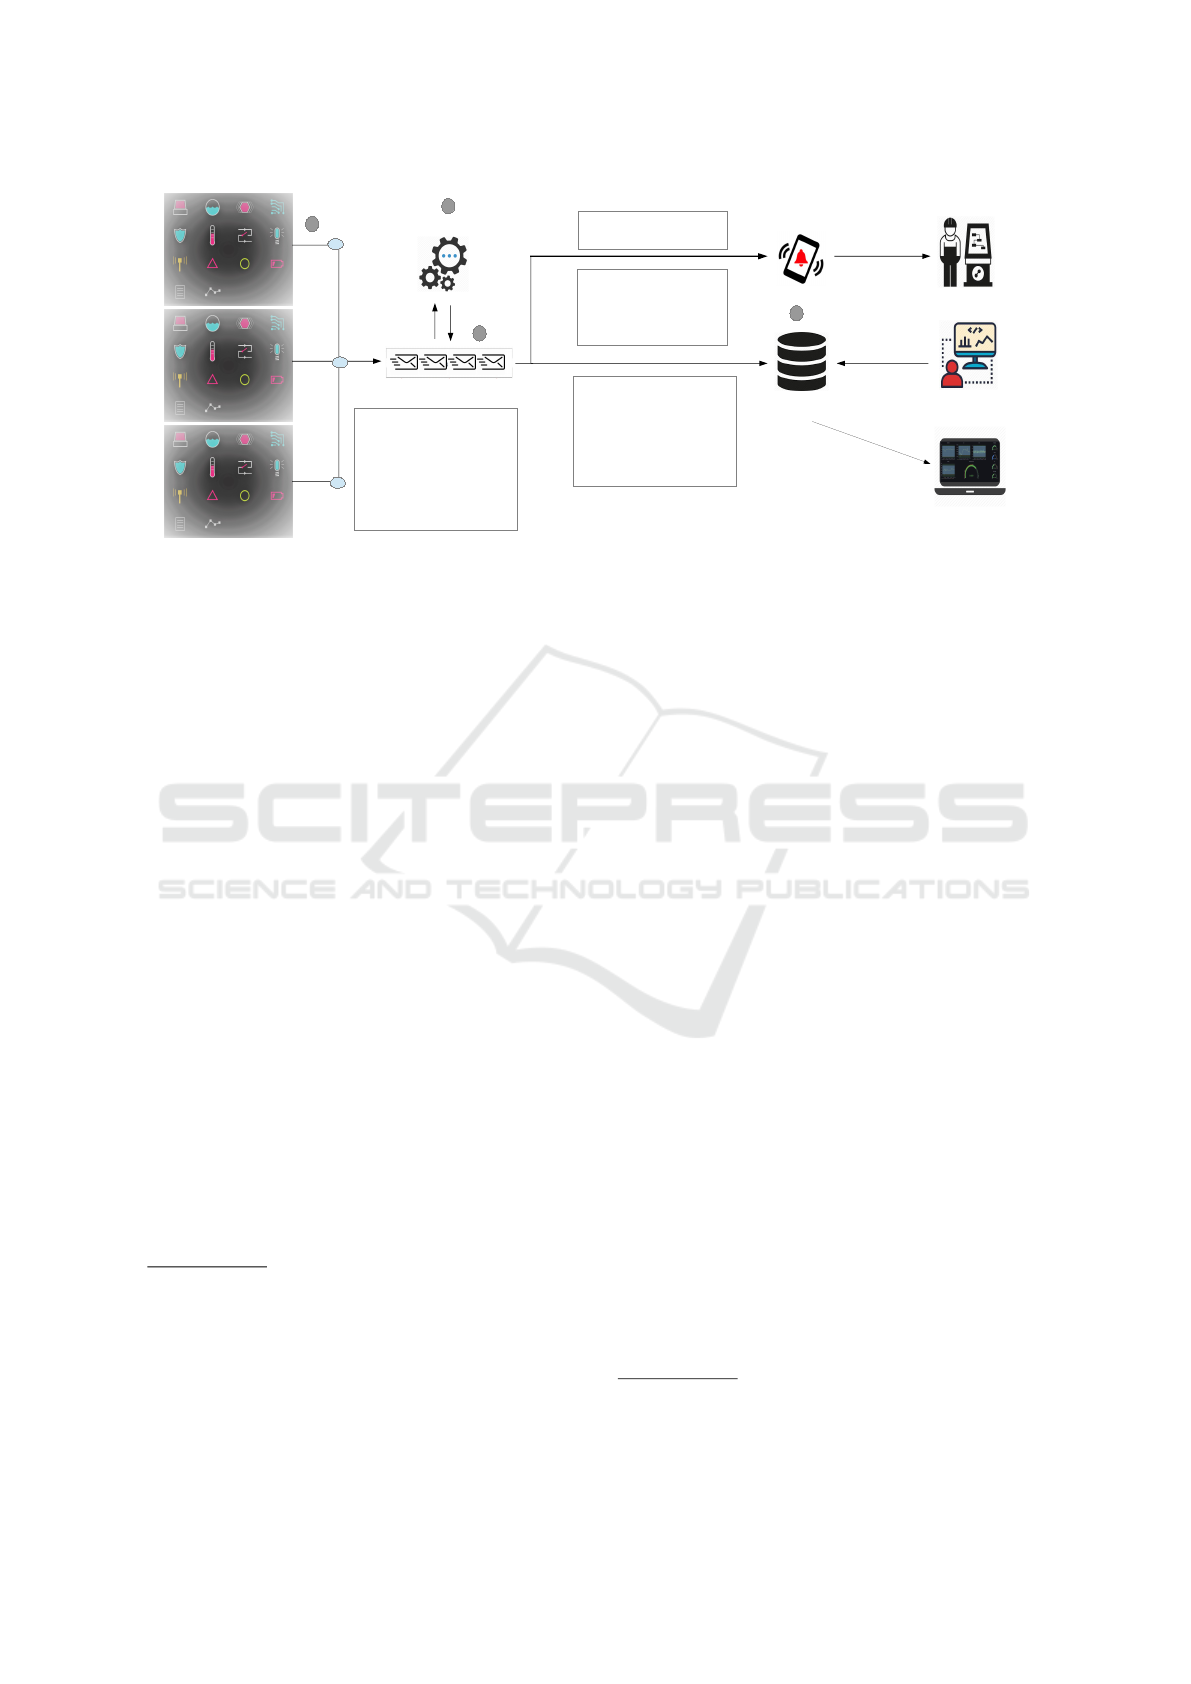
Stream Processing
Persistent Messaging Bus
Sensors
Real-time Operational
Dashboard
Stream Processing Jobs
All data is stored in the messaging
bus, which is immutable and
ordered. When reprocessing
of the data is required, a new
processing job can be initiated in
parallel that re-reads the entire
dataset or data of interest from the
messaging bus and stores the
processed data in the data store.
How Does it Work?
Sensors collect data which can then
be sent over the network to the
messaging bus for immutable,
append-only storage. Stream
processing jobs are run on the data,
while the data is still in motion. The
processed data is further sent to
a data store for visualization or
querying purposes and/or consumed
by other applications.
Analysis Ready Data
Store (ARDS)
Alert Notification
Analysis Ready Data
Store (ARDS)
Real-time and historical
insights are stored in ARDS to
broadcast to the operational
dashboard and to perform further
analysis.
Alert Notification
Alerts could be triggered for
critical anomalous conditions.
Sensors
Query
Notify to Operator
Machine
Operator
Business
Analytics
M
o
n
i
t
o
r
i
n
g
1
2
3
4
Figure 1: Overall scalable streaming data pipeline - kappa architecture.
(serving layer) to store the real-time and historical in-
sights. The kappa architecture is scalable and flexible
in the sense that it can accomplish a wide range of
processing tasks (both real-time and batch) in paral-
lel.
Moreover, a concrete kappa architecture with cho-
sen software platforms is presented in Fig. 2. The
sensor network consists of indoor climate meters (IC-
Meter)
3
deployed in class rooms/public buildings in
Denmark for demonstration purposes to measure in-
door climate data such as, temperature, humidity,
CO
2
and noise. IC-Meter has implemented a pub-
lic REST API
4
to retrieve data from the IC-Meter
server. Data transmitted by the IC-Meter REST API is
streamed into Kafka
5
(a light weight distributed data
stream processing framework) through Kafka Con-
nect. Kafka Connect is the data integration frame-
work for Kafka. It connects data sinks and sources to
Kafka Streams
6
. Kafka Streams is a library for build-
ing streaming applications. Other streaming frame-
works could also be used, such as Storm
7
, Spark
Streaming
8
, Flink
9
and so on. Deployment of an on-
line model in the streaming application for real-time
predictions is also possible. The processed streaming
data is then pushed into the Kafka Connect data sink
(PostgresSQL/TimescaleDB in the given case). The
processed streaming data can then be visualized in a
dashboard, for example Grafana
10
. In addition, an
alert notification may also be sent to the attached con-
3
https://www.ic-meter.com/dk
4
https://app.ic-meter.com/icm-mobile2
5
https://kafka.apache.org
6
https://kafka.apache.org/documentation/streams
7
https://storm.apache.org
8
https://spark.apache.org/streaming
9
https://flink.apache.org
10
https://grafana.co
sumer (mobile app) depending on the severity of the
alarm.
4 CONDITION BASED
MAINTENANCE
This section presents several practical CM and PdM
techniques. Some of these techniques are also demon-
strated by using the stream processing capabilities
of Kafka Streams. Due to its ease-of-use, KSQL
11
is used as a stream processing framework. KSQL
is built on Kafka Streams. In KSQL it is possible
to write real-time streaming applications by using a
SQL-like query language. First, a practical technique
using stateless CM is introduced. In stateless opera-
tions there is no need to keep the previous state and
each data-point in the stream is evaluated individu-
ally. Further, several easy-to-use, easy-to-maintain
and realistic stateful CM and PdM techniques are also
presented. In stateful operations, data-points from a
single/multiple streams are aggregated, correlated or
joined. Even though, indoor air quality has been cho-
sen as a case study for this paper, however the CM and
PdM techniques presented in this paper are generic.
As a matter of fact, poor indoor air quality in indus-
trial buildings is a serious concern. A team of engi-
neers at Purdue University in Indiana
12
have studied
the relationship between indoor climate and produc-
tivity and found out that poor indoor climate results
in lower productivity.
11
https://www.confluent.io/product/ksqldb
12
https://bgridsolutions.com/poor-indoor-climate-leads-
to-lower-productivity
Condition based Maintenance on Data Streams in Industry 4.0
139

K
a
f
k
a
C
o
n
s
u
m
e
r
Kafka Connect (Sink)
PostgreSQL/
Timescale DB
Garafana Dashboard
Real-time Monitoring
Mobile App
Stream processing
Real-time Insights
Kafka Connect
(Source)
Figure 2: Concrete kappa architecture with software platform.
4.1 Condition Monitoring
Condition monitoring is the process of monitoring an
asset’s (room’s in this paper) condition based on one
or several parameters and look for changing trends
or signs that reveals that an abnormal condition or a
fault is approaching. For example, if CO
2
levels are
the same as usual, the rooms indoor air quality most
probably is stable (under an acceptable level), and no
further actions are required. Whereas, if CO
2
levels
increase and exceed a certain threshold, the building
caretaker should intervene and inspect the ventilation
system in order to identify the root cause. If a prob-
lem is identified, in that case a technical person should
monitor the ventilation system more closely while a
repair is scheduled to avoid any further damage.
-----------------------
IC-Meter data snapshot:
-----------------------
{"indoor_Measurements_Toftevangschool":
[{"unit":4,
"time": "2022-07-23T15:00:00Z",
"temperature": 17.00,
"humidity": 29.82,
"co2": 1220.0,
"noise": 32.1},
{"unit":4,
"time": "2022-07-23T15:05:00Z",
"temperature": 18.87,
"humidity": 31.01,
"co2": 1050.0,
"noise": 31.9},
{"unit":4,
"time": "2022-07-23T15:10:00Z",
"temperature": 20.4,
"humidity": 33.01,
"co2": 700.0,
"noise": 31.5},...]}
The above mentioned IC-Meter data snapshot pro-
vides a quick overview of the sensor data that is being
used in the rest of the paper. The IC-Meter is used
for the measurement of indoor climate and ventilation
condition. The IC-Meter data (JSON format) contains
six attributes. The data has 5 minutes granularity. The
rows in the snapshot read as follows. Unit, represents
the room in the given building. Timestamp, represents
the date and time of the sensor data acquisition. In-
door temperature normal range is between 17-25
◦
C.
While, the normal range of humidity is 25-70 %. The
CO
2
and noise levels should be < 1000 ppm and 80
dB(A), respectively.
4.1.1 Threshold Events
It is a stateless CM technique, while the rest of the
techniques presented in this paper are stateful. First, a
topic and a new stream with the specified columns and
properties is created. Afterwards, Kafka Connect im-
ports streaming events into a Kafka topic. In KSQL,
streams can be created from topics as well as of query
results from other streams.
CREATE STREAM indoor_climate (
building VARCHAR, unit INT, timestamp
VARCHAR, temperature DOUBLE, humidity
DOUBLE, co2 DOUBLE, noise DOUBLE)
WITH (kafka_topic=’indoor_climate’,
TIMESTAMP=’timestamp’,
TIMESTAMP_FORMAT=’yyyy-MM-dd’’T’
’HH:mm:ssX’,
value_format=’json’, partitions=1);
The following stream processing logic continu-
ously monitors and processes CO
2
sensor data in real-
time. The CO
2
level in parts per million (ppm) is the
key indicator to decide when is the best time to venti-
late. The processing logic assigns a category (green,
yellow and red) to the individual events based on the
CO
2
range and forwards it to another Kafka topic
and/or data store. Any interested consumer/connector
can get this notification, for example, a dashboard to
display the events in real time based on the severity
levels.
IN4PL 2022 - 3rd International Conference on Innovative Intelligent Industrial Production and Logistics
140

CREATE STREAM indoor_air_quality_levels
AS SELECT *, CASE
WHEN co2 < 800 THEN ’GREEN’
WHEN (co2 >= 800 AND co2 <= 1000)
THEN ’YELLOW’
WHEN co2 > 1000 THEN ’RED
END AS indoor_air_quality_level
FROM indoor_climate
Further, only relevant events showing CO
2
spikes
over 1000 ppm are forwarded to another Kafka topic
for a batch report.
CREATE STREAM poor-indoor-air-quality WITH
(kafka_topic= poor-indoor-air-quality,
value_format=’json’, partitions=1);
AS
SELECT * FROM indoor_climate
WHERE (co2 > 1000);
4.1.2 Peak Detection
This idea of peak detection is completely based on the
work of (de Rizzio, 2021). The processing logic iden-
tifies the peaks that are above a certain threshold level
(1000 ppm in this example) and provides the details
with respect to time/duration (Fig. 3). Any consumer
that is interested in peaks that last more than a specific
amount of time (30 minutes in this example) can get
this notification, for instance, a real-time alerting app.
SELECT unit, TIMESTAMPTOSTRING(WINDOWSTART,
dd-MM-yyyy HH:mm:ss) AS start,
TIMESTAMPTOSTRING(WINDOWEND,
dd-MM-yyyy HH:mm:ss) AS end,
TIMESTAMPTOSTRING(WINDOWEND - WINDOWSTART,
mm) AS peak_width_in_mins,
COUNT(co2) AS num_data_points
FROM indoor_climate_data
WINDOW SESSION (15 MINUTES)
WHERE co2 > 1000
GROUP BY unit
HAVING peak_width_in_mins > 30
EMIT CHANGES;
15:00 15:05 15:10 15:15 15:20 15:25 15:30 15:35 15:40 15:45 15:50 15:55 16:00
1000 ppm
Peak duration
Pd = t2 - t1
Bad indoor air quality
t1
t2
Figure 3: Peak duration.
4.1.3 Outlier Detection using a Threshold
A 45-minutes sliding window continuously monitors
and aggregates CO
2
spikes over 1000 ppm. The pro-
cessing logic identifies the peaks that are above a cer-
tain threshold level (1000 ppm in this example) and
counts the number of peaks in a time-based sliding
window. A batch processing report analysed by do-
main experts may reveals that more than 6 CO
2
spikes
of over 1000 ppm in a 45-minutes period may result
in poor indoor air quality and could considerably in-
creases the risk of infection, hence a real-time notifi-
cation can be sent to an alerting app.
CREATE TABLE anomaly_detection_Tschool_4
AS
SELECT unit, count(*)
FROM indoor_climate_data
WINDOW HOPPING (SIZE 45 MINUTE,
ADVANCE BY 5 MINUTE)
WHERE co2 > 1000
GROUP BY unit
HAVING count(*) > 6
EMIT CHANGES;
4.1.4 Health Score
Another stateful condition monitoring technique is to
calculate the room’s health score (HS) as condition
estimator based on the current health status of the
room (Fig. 4). HS normally consists of a combination
of parameters, as presented in this paper. The ideas
of calculating normalized parameter value (x
n
) and
HS are entirely based on the work of (Weaver et al.,
2014).
x
n
=
x − min(x)
max (x) − min (x)
(1)
Equation 1, calculates the normalized value x
n
,
where x is the value of the parameter, for instance
CO
2
is the parameter and its value is 600 ppm, max(x)
and min(x) are maximum and minimum values of
x in a time-based window and x
n
is the normalized
value of x that will satisfy 0 < x
n
≤ 1. For exam-
ple, CO
2
value of 1050 ppm will be normalized to
(1050 − 700)/(1220 − 700) = 0.67, where 1050 ppm
is the current CO
2
value and 1220 ppm is the maxi-
mum value and 700 ppm is the minimum value in the
IC-Meter data snapshot (Section 4.1).
hs =
j
∏
i=1
(x
n
i
w
i
)
!
1
j
(2)
In Equation 2, health score hs is calculated, where
j is the number of parameters, and the hs is computed
Condition based Maintenance on Data Streams in Industry 4.0
141
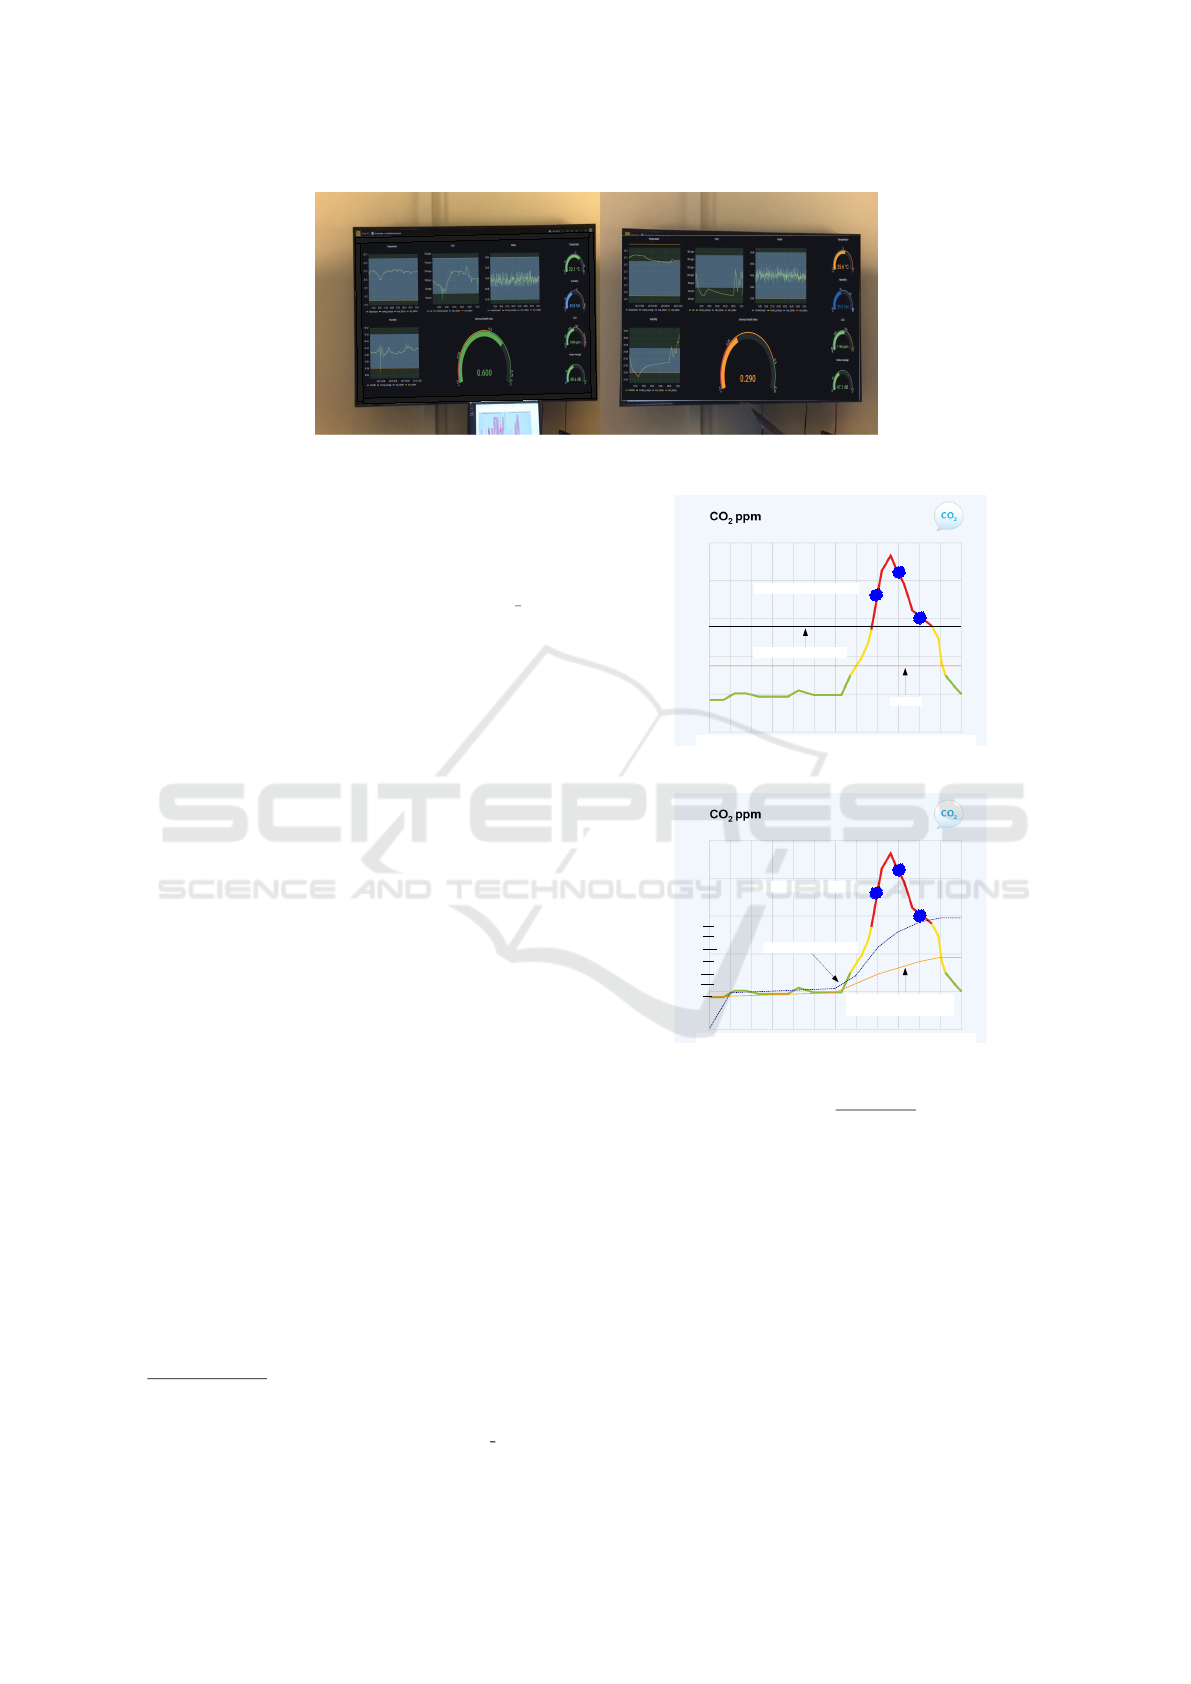
Health Score
Health Score
Figure 4: Real-time dashboard with room’s health score.
for a given time-based window by multiplying the val-
ues of x
n
for each normalized parameter with their as-
signed weights w and raising the product to the j
th
root.
hs = [(x
n
1
w
1
) ∗ (x
n
2
w
2
) ∗ (x
n
3
w
3
) ∗ (x
n
4
w
4
)]
1
4
(3)
Further, Equation 3 demonstrates how the hs is
calculated for a given IC-Meter data snapshot, where
x
n
1
represents temperature, x
n
2
stands for humidity, x
n
3
denotes CO
2
and x
n
4
represents noise. Similarly, w
1
to
w
4
represents their respective weights.
4.1.5 Outlier Detection using Statistical
Modeling
In order to identify outliers in Gaussian-like distri-
butions (Fig. 5), mean (M) and standard derivation
(STD) are the most common approaches. Neverthe-
less the classical M and STD models cannot be used
if the data is on-the-move as these models require that
all data-points to be known in advance, which is not
possible in the case of streaming data. In order to ob-
tain the STD of streaming data, an approximation of
STD value is required. Welford’s online algorithm
13
paves the way for computing moving average (MA)
and moving standard derivation (MSTD) of stream-
ing data (Fig. 6). In this paper, an adjusted version of
Welford’s method
14
has been used such that only the
value entering the window needs to be considered.
The following three equation are repeatedly ap-
plied to the streaming data to compute moving aver-
age ma and moving standard derivation mstd.
ma
c
= ma
c−1
+ (x
c
− ma
c−1
)/c (4)
s
c
= s
c−1
+ (x
c
− ma
c−1
) ∗ (x
c
− ma
c
) (5)
13
https://jonisalonen.com/2013/deriving-welfords-
method-for-computing-variance
14
https://github.com/nestedsoftware/iterative stats
15:00 15:05 15:10 15:15 15:20 15:25 15:30 15:35 15:40 15:45 15:50 15:55 16:00
Bad indoor air quality
Average
Standard Deviation
Figure 5: Classical mean and standard derivation.
15:00 15:05 15:10 15:15 15:20 15:25 15:30 15:35 15:40 15:45 15:50 15:55 16:00
Bad indoor air quality
Moving Average
Sliding Window Size: 45 minutes
Moving Standard Deviation
Figure 6: Moving average and moving standard derivation.
mstd
c
=
p
s
c
/(c − 1) (6)
In Equation 4, moving average ma
c
is calculated,
where x
c
is the value of the parameter, c is the count
of the values and ma
1
= x
1
. In addition, 2 ≤ c ≤ n,
where n represents the window size and it can be cal-
culated as follows. For example if the window length
is 45 minutes with a granularity of 5 minutes, then n
= 9. Further, in Equation 5 and Equation 6, moving
sum s
c
and moving standard derivation mstd
c
are cal-
culated, respectively. Whereas, mstd
1
= 0 and s
1
=
0. Furthermore, once the window is full, the follow-
ing two equations (Equation 7 and Equation 8) are
adjusted for window size, where value popped vp is
the leftmost value subtracted/popped from the current
IN4PL 2022 - 3rd International Conference on Innovative Intelligent Industrial Production and Logistics
142

window of size n.
ma
c
= ma
c−1
+ (x
c
− vp)/n (7)
s
c
= s
c−1
+ (x
c
− vp)∗ (x
c
− ma
c
+ vp − ma
c−1
) (8)
4.2 Predictive Maintenance
As mentioned earlier, CM and PdM are the two main
approaches of CbM. Hence, the goal of both these ap-
proaches is to reduce the likelihood of asset failure by
taking corrective measures before failure happens in
order to minimize manufacturing downtime and un-
scheduled maintenance. Nevertheless there are some
differences between these two approaches. PdM uses
advanced statistical/machine learning models to pre-
dict when a maintenance action should be performed
or in order words when an asset is going to fail, where
as CM can only give some insight based on a cer-
tain threshold that some corrective action needs to be
taken quickly in order to avoid asset failure. Further,
it can be seen in Fig. 7 that the focus of PdM-based
techniques is to detect a failure in its early stage, while
CM-based techniques tries to spot a failure at a late-
stage, though before it occurs.
Time
A
s
s
e
t
C
o
n
d
i
t
i
o
n
Acceptable Condition
Minimal Acceptable Condition
(Condition Indicator)
Failure Condition
Condition
Monitoring
Predictive
Maintenance
Figure 7: Condition monitoring vs predictive maintenance.
In general, PdM has three levels: anomaly detec-
tion, fault detection and diagnostic and prediction of
RUL/TTF. Anomaly detection is one of the most com-
mon use cases of predictive analytics in order to detect
anomalous patterns that deviate from normal behav-
ior. Anomalies are somewhat different from outliers,
an outlier is an unlikely event or a rare event given
the overall event distribution, where as an anomaly is
an event which is different from previous events or
patterns. Fault detection and diagnostic is the second
level, where predictive analytics is used in order to
detect specific faults that may occur and/or their root
causes, such as misalignment in rotating components.
Finally, RUL/TTF is the final level that uses advanced
analytics to predict asset reliability. In this paper, the
main focus is on anomaly detection, hence the rest of
the PdM techniques are not discussed further.
4.2.1 Anomaly Detection using Machine
Learning
Time series based anomaly detection techniques are
mainly based on stochastic models, statistical models
and ML models. In this paper, ML model based tech-
niques are used for detecting anomalies. ML-based
techniques usually need historical data for training
purposes, however a new approach for model train-
ing and predictions is emerging, which is known as
streaming ML. Streaming ML does not requires pre-
stored historical data to start with. Streaming ML
models use online model training/retraining, for ex-
ample a stream processing application based on Ten-
sorFlow
15
can take a collection of the recently con-
sumed events in order to train or retrain a ML model.
Thus, for streaming ML there is no master data stor-
age required.
CREATE STREAM indoor_health_score AS
SELECT unit,
INDOOR_ANOMALY_SCORE(INDOORCLIMATEDATA)
FROM indoor_climate_data_preprocessed;
The above-mentioned KSQL code is based on
the work of (Waehner, 2021). In this application
a ML model is embedded in the user-defined func-
tion (UDF) “INDOOR ANOMALY SCORE()”. It
is also possible to deploy the model to a dedicated
model server. The model uses a special type of neural
network known as autoencoder
16
(an unsupervised
learning algorithm for streaming data). An autoen-
coder is able to discover the structure within data
in order to develop a compressed representation of
the data. To start with, predictions generated by the
model are not accurate, however with online train-
ing/retraining the predictions will get better, still not
as good as a model trained with historical data.
CREATE STREAM anomaly AS
SELECT * FROM indoor_health_score
WHERE INDOOR_ANOMALY_SCORE > 2.0
Moreover, it can be seen in the above-mentioned
KSQL steaming application code, the UDF returns
an indoor health score of each event. Those events
that exceed the given threshold (2.0 in the given case)
will be considered to be anomalous.
15
https://www.tensorflow.org
16
https://www.tensorflow.org/tutorials/generative
Condition based Maintenance on Data Streams in Industry 4.0
143

5 CONCLUSIONS
In the manufacturing industry, production line break-
downs cost ∼ 50,000 US$ per hour, worldwide. Fur-
ther, maximum availability of machines and systems
must be preserved in order to meet the demands of
Industry 4.0. This paper presented a scalable data
pipeline along with several condition monitoring and
predictive maintenance techniques to detect anoma-
lous behaviour. The proposed techniques may help
manufacturing industry to reduce unplanned down-
time due to asset failures. These techniques are prac-
tical, easy-to-use and easy-to-maintain. In addition,
they work well in the case of streaming data, unla-
beled data and/or lack of historical data.
In the future, the proposed data pipeline as well
as condition monitoring and predictive maintenance
techniques presented in this paper should be deployed
to production in SMEs.
ACKNOWLEDGEMENTS
Special thanks to Kai Waehner
17
for his inspirational
tutorials, videos and GitHub repository especially in
relation to Kafka Streams and KSQL by Confluent
18
.
In addition, most of the CM and PdM techniques pre-
sented in this paper are based on the ideas suggested
by Kai Waehner.
REFERENCES
Boniol, P., Paparrizos, J., Palpanas, T., and Franklin,
M. J. (2021). Sand: streaming subsequence anomaly
detection. Proceedings of the VLDB Endowment,
14(10):1717–1729.
Butler, Q., Ziada, Y., Stephenson, D., and Gadsden, S. A.
(2022). Condition monitoring of machine tool feed
drives: A review. Journal of Manufacturing Science
and Engineering, 144(10):100802.
Chatterjee, A. and Ahmed, B. S. (2022). Iot anomaly detec-
tion methods and applications: A survey. Internet of
Things, page 100568.
de Rizzio, R. (2021). Apache kafka and time series.
Available online at: https://rogerio-rizzio.medium.
com/apache-kafka-and-time-series-7f1a9db47053.
Dinardo, G., Fabbiano, L., and Vacca, G. (2018). A smart
and intuitive machine condition monitoring in the in-
dustry 4.0 scenario. Measurement, 126:1–12.
Guo, J. and Shen, Y. (2022). Online anomaly detection of
industrial iot based on hybrid machine learning ar-
17
https://www.kai-waehner.de
18
https://www.confluent.io
chitecture. Computational Intelligence and Neuro-
science.
Hsieh, R. J., Chou, J., and Ho, C. H. (2019). Unsuper-
vised online anomaly detection on multivariate sens-
ing time series data for smart manufacturing. In 12th
Conference on Service-Oriented Computing and Ap-
plications. IEEE.
Iftikhar, N., Baattrup-Andersen, T., Nordbjerg, F. E., and
Jeppesen, K. (2020). Outlier detection in sensor data
using ensemble learning. Procedia Computer Science,
176:1160–1169.
Iftikhar, N., Nordbjerg, F. E., Baattrup-Andersen, T., and
Jeppesen, K. (2019). Industry 4.0: sensor data analy-
sis using machine learning. In International Confer-
ence on Data Management Technologies and Applica-
tion, pages 37–58. Springer.
Lin, J. (2017). The lambda and the kappa. IEEE Internet
Computing, 21(5):60–66.
Liu, X., Iftikhar, N., Nielsen, P. S., and Heller, A. (2016).
Online anomaly energy consumption detection using
lambda architecture. In International Conference on
Big Data Analytics and Knowledge Discovery, pages
193–209. Springer.
Marz, N. and Warren, J. (2015). Big Data: Principles and
Best Practices of Scalable Real-time Data Systems.
Manning Publications Co., New York.
Paolanti, M., Romeo, L., Felicetti, A., Mancini, A., Fron-
toni, E., and Loncarski, J. (2018). Machine learn-
ing approach for predictive maintenance in industry
4.0. In 14th IEEE/ASME International Conference
on Mechatronic and Embedded Systems and Applica-
tions. IEEE.
Pimenov, D. Y., Bustillo, A., Wojciechowski, S., Sharma,
V. S., Gupta, M. K., and Kunto
˘
glu, M. (2022). Artifi-
cial intelligence systems for tool condition monitoring
in machining: Analysis and critical review. Journal of
Intelligent Manufacturing, 109(3):1–43.
Pittino, F., Puggl, M., Moldaschl, T., and Hirschl, C. (2020).
Automatic anomaly detection on in-production manu-
facturing machines using statistical learning methods.
Sensors, 20(8):2344.
Serin, G., Sener, B., Ozbayoglu, A. M., and Unver, H. O.
(2020). Review of tool condition monitoring in ma-
chining and opportunities for deep learning. The In-
ternational Journal of Advanced Manufacturing Tech-
nology, 109(3):953–974.
Waehner, K. (2021). Condition monitoring and predictive
maintenance with apache kafka. https://www.kai-
waehner.de/blog/2021/10/25/apache-kafka-condition-
monitoring-predictive-maintenance-industrial-iot-
digital-twin.
Weaver, S., Dai, D., Stauber, C. E., and Luo, R. (2014). The
urban health index: a handbook for its calculation and
use.
IN4PL 2022 - 3rd International Conference on Innovative Intelligent Industrial Production and Logistics
144
