
Augmented Reality-based Visualization of the Reach of a Collaborative
Robot
Fabio Schwarz
1
, Maxim Feinleb
1
and Gerrit Meixner
2 a
1
Robotic Testing and System Engineering, Festo SE & Co. KG, Ruiter Straße 82, Esslingen, Germany
2
UniTyLab, Heilbronn University, Max-Planck-Str. 39, Heilbronn, Germany
Keywords:
Augmented Reality, Collaborative Robot, Unity3D, Robot, Cobot.
Abstract:
With increasing globalization and higher competition on the one hand, and the same high level of personnel
costs on the other, the pressure on companies to rely more on automation is growing. At the same time, with
increasing individualization and complexity of products, batch sizes are shrinking, making versatile production
machines with quick production changes and easy set-up processes necessary. In order to still cope with the
complexity and at the same time use the human worker only for responsible tasks, robots have to take over the
tedious tasks and work together with the human worker at the same time. To enable this working condition,
the collaborative robots need to be set up and installed at the human’s working place first. This increases the
safety requirements and leads to a large installation effort. To tackle these problems, improve the set-up and
to simplify the collaborative work of the robot and the human worker, an augmented reality application is
presented that helps by visualizing the reach of the robot. The proposed solution uses Unity3D to create an
augmented reality application which recognizes the robot with the help of ArUCO markers. Once recognized,
the reach of the robot is shown in the application in such way that the human worker is able to see the reach
of the robot.
1 INTRODUCTION
With the change of industry to an ”Industry 4.0”
and increasing globalization the ever-growing need
for collaborative robots increases (Galin and Meshch-
eryakov, 2019). These robots help to tackle the higher
competition in the market by automating production
steps. This will help workers in manufacturing prod-
ucts on mass or more individualized products with
smaller batch sizes. They can either be installed as
a third arm, to hand the worker parts for assembly,
or work autonomously in supplying chains. They are
small and outfitted with sensors to perceive their sur-
roundings and not to collide with humans, but also
’see’ what they can grip and where to move. Because
of this versatility, they need to be set up for each spe-
cific task. They need to be placed in such way that
they can access all the instruments and parts they need
to complete their task. They also must not interfere
with the already existing machines and must not in-
terrupt a worker in his workflow (Kopp et al., 2021).
To improve the collaboration between robot and
a
https://orcid.org/0000-0001-9550-7418
worker, the worker must be able to have a way to com-
municate with the robot or at least understand what
the robot is working on at any moment in time. To
come closer to a solution, this paper describes how to
create an augmented reality (AR) application which
will show the worker the reach of the robot.
2 STATE OF THE ART
AR gained a lot of traction in the last few years not
only in pop culture but also in the industry. This vali-
dates a forecast given by Shao-Ning Chang and Wei-
Lun Chen (Chang and Chen, 2017) in 2015 where
they predicted an 450% increase in AR and virtual re-
ality (VR) users. They contributed this to the growth
of the ecosystem of AR and VR that enabled more
uses with these devices. Furthermore, the new devices
come with improved sensors, which also improve the
AR and VR experience. They also claim that this
increase will mainly happen because the industry is
interested in these technologies. For the consumer
market, the authors claim that there is a chicken-egg-
problem between manufacturers building devices and
70
Schwarz, F., Feinleb, M. and Meixner, G.
Augmented Reality-based Visualization of the Reach of a Collaborative Robot.
DOI: 10.5220/0011561100003323
In Proceedings of the 6th International Conference on Computer-Human Interaction Research and Applications (CHIRA 2022), pages 70-77
ISBN: 978-989-758-609-5; ISSN: 2184-3244
Copyright
c
2022 by SCITEPRESS – Science and Technology Publications, Lda. All rights reserved

developers building applications. Either of them waits
for the other to saturate the market which in turn stops
the general progress in the consumer market. Accord-
ing to the authors the industry must step in to cre-
ate a need for AR applications and devices such that
progress can still be made.
Many AR approaches in industry fall into the
teaching /supporting area, where they support the
worker in his task or simplify teaching of new tasks.
Mourtzis et al. (Mourtzis et al., 2018) simplifies
the teaching of new designers by simplifying the de-
signing process with the help of AR. Furthermore,
Mourtzis et al. (Mourtzis et al., 2017) shows a re-
mote support system where they improve the main-
tenance procedure. A similar approach is also de-
scribed by Peng Wang et al. (Wang et al., 2019) where
they describe how a remote expert can teach a lo-
cal worker through spatial augmented reality (SAR)
which projects information directly on the surfaces
around the worker. A further solution is described by
Volker Paelke (Paelke, 2014) where the author sup-
ports workers with visual aid in a simplified produc-
tion environment that synchronizes the work of the
machines and the workers.
Using AR as shown by Dimitris Mourtzis et al.
(Mourtzis et al., 2018) improves the teaching of new
designers and also helps professionals. The authors
create an application which allows designers to view
a product through a head mounted AR device. De-
signers can manipulate the product design with their
gestures while it is shown in real time, with the prod-
uct designs’ size adjusted to its surroundings. The ap-
plication helps new designers to rule out mistakes that
would otherwise emerge later in the designing pro-
cess. It also enables the designers to discuss their de-
signs in group sessions, so it simplifies pointing out
flaws to their colleagues. The proposed approach of
the authors is working as follows:
1. The requirements of the new product are defined
2. A prototype is designed
3. The prototype is viewed in AR by the designing
group
4. If a flaw is found the designers go back to 2)
5. If product is production ready the designers can
proceed to the next production steps
Through the help of AR, the design process is made
more accessible to newcomers, but also helps profes-
sionals by simplifying the design process in general.
It shortens design time and designers become more
aware which challenges they will face in the final as-
sembly.
In a second paper the same authors show a
maintenance-as-a-service approach (Mourtzis et al.,
2017). The authors create a system that lets onsite
technicians get remote support for broken machines.
After a malfunction report is filed to the cloud service
by an onsite technician, the manufacturer generates
an AR scene which is sent back to the onsite tech-
nician. The AR scene is mostly auto-generated and
only little help is required from the manufacturer. Al-
ready existing scenes are reused, and a scene shows a
step-by-step walk through of the repair. This enables
the onsite technician to handle the repair without the
need of a manufacturer to send experts to the site.
Since the systems depends on a cloud infrastructure,
the maintenance service is always accessible. The au-
thors claim to reduce the maintenance cost by this ap-
proach and better integrate maintenance solutions into
the product-as-a-service market.
Similar to the aforementioned solution, Peng
Wang et al. (Wang et al., 2019) describe a mixed
reality (MR) approach to teaching. Here, a remote
expert shows in VR how to assemble a product to a
local worker. The worker will apply this knowledge
which is shown to him through spatial augmented re-
ality, and he reproduces these steps to build the phys-
ical product. The authors also implemented a two-
way feedback by sharing the video stream of the local
worker to the remote expert, so the remote expert is
able to modify or repeat steps if necessary. The goal
of this research is to determine whether the remote
expert is more comfortable using a controller or his
hands / gestures to manipulate objects in AR. The au-
thors conclude that a gesture-based system is gener-
ally more accepted than a controller-based system.
While these papers focus on knowledge transfer
with the help of AR, there are solutions for helping
the workers actively in their daily working routine as
well. Volker Paelke shows an application which sup-
ports the worker in a simulated production environ-
ment (Paelke, 2014). His solution is integrated into a
modular production system and offers the worker vi-
sual hints through a head-mounted-display. The tasks
performed by the worker vary depending on the pro-
duction steps of the machines ahead of the worker’s
station. These steps are considered when providing
visual support to the worker. The worker then per-
forms the required build task. The author compares
different visualization methods, from text-only to vi-
sual cues, like concentric circles. While the author
cannot establish which method of user guidance is
best, he states the results to be very promising in gen-
eral. The feedback received from the test subjects is
very positive.
In the following paragraphs, this paper will de-
scribe an approach (similar like (Paelke, 2014)) for
helping the worker through visual guidance in his
Augmented Reality-based Visualization of the Reach of a Collaborative Robot
71
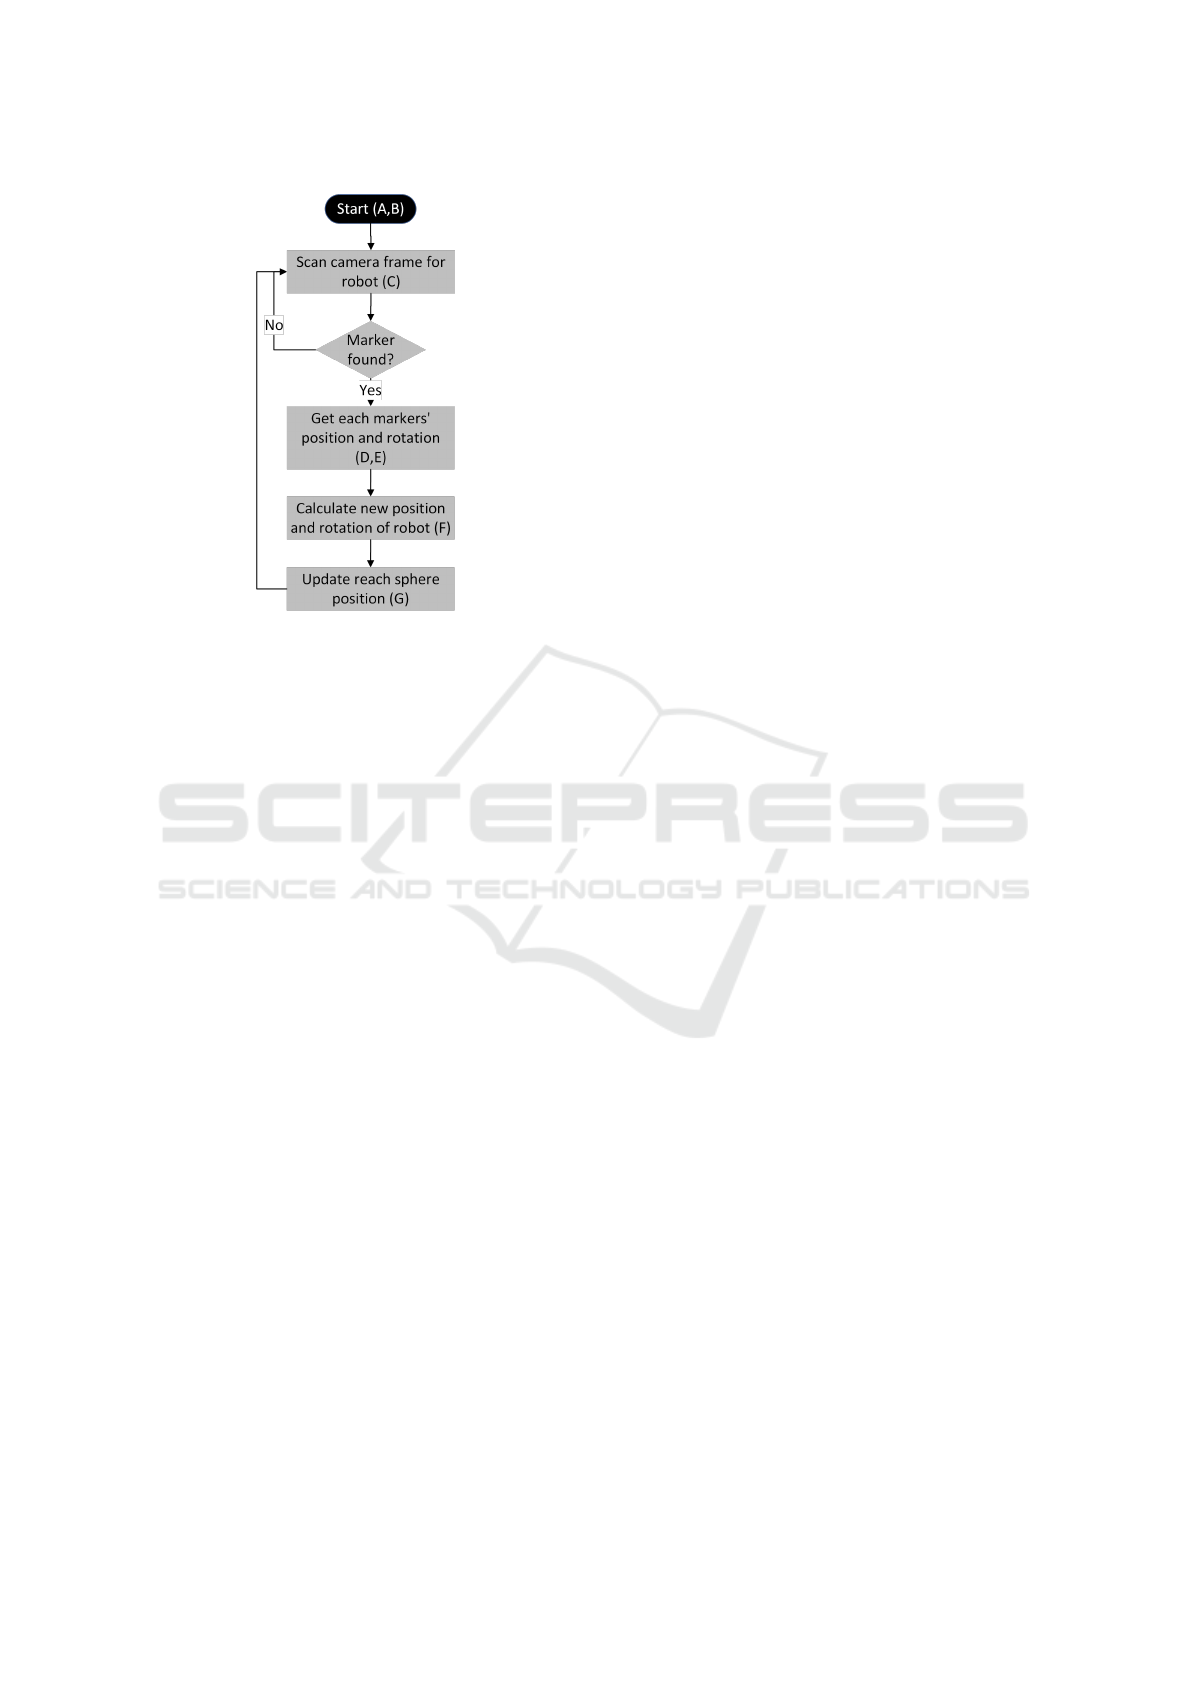
Figure 1: Flow chart of application.
work with, and around, a collaborative robot. Our
approach shows the worker information for his task.
This will help to optimize the worker’s safety.
The next section explains how the robot is recog-
nized from the AR device and how the AR application
is created. The subsequent section explains the gener-
ation of the sphere representing the reach of the robot.
Finally, this paper gives a conclusion and further con-
siderations on future extension to the presented ap-
proach.
3 APPROACH
In this section, the specifics of the approach are pre-
sented and discussed in detail. Figure 1 shows the
simplified sequence diagram of the AR application.
As soon as the application is started, it is scanning
the received camera image for markers. Once one or
more markers are found, it calculates the rotation of
these markers and infers the position of the robot base
from them. Afterwards, it updates the position of the
reach sphere accordingly.
3.1 Foundation
Unity3D is a game engine mainly used to create video
games. Since Unity3D supports development of AR
and VR applications, it is selected for the purpose of
this paper. Unity3D supports building AR applica-
tions for IOS, Android and Microsoft HoloLens. An
Android tablet (Samsung Galaxy Tab S6 Lite) and an
Android smartphone (Samsung Galaxy S20) are used
exemplary throughout this paper.
3.2 Recognition Approaches
With the foundation set, the first step is to recognize
the robot in the camera image of the tablet. Three
recognition methods are evaluated for the robot recog-
nition:
1. Recognition with artificial intelligence (AI)
2. Recognition through image recognition algo-
rithms
3. Recognition with markers
The first method, an AI based approach, is ruled out
because the necessary information for visualizing the
reach of the robot cannot be extracted from the image.
An artificial neural network must be trained thousands
of epochs with millions of images, to be fitted to the
purpose of recognizing the robot. The artificial neu-
ral network is then able to detect objects in the image
and is providing either a bounding box around the ob-
ject in the image or a segmentation pattern which only
gives the pixels of the found object. Thus, informa-
tion of the pose of the robot and the distance to the
camera must be inferred by subsequent steps in the
image processing pipeline. A single unified approach
is subject to further research.
The second approach, recognizing the robot
through image recognition algorithms, is also ruled
out. Using recognition algorithms to detect salient
features on the robot cover would recognize the robot,
but there is also no further information about the robot
pose and distance to the camera.
The third approach is the recognition with the help
of markers (e.g., ArUCO markers). These are the
work of Romero-Ramirez et al. (Romero-Ramirez
et al., 2018) and Garrido-Jurado et al. (Garrido-
Jurado et al., 2015). The authors show in their work
how to generate and detect the markers with low effort
and high precision. They claim to recognize the mark-
ers reliably in a 4k video stream with 1000 FPS even
when the markers are printed on normal paper. For the
recognition of the markers the OpenCV library (Brad-
ski, 2000) is used with its ArUCO marker detection
algorithms. This implementation is selected because
of the high precision and speed that is also achieved
on mobile devices.
3.3 Marker Recognition
OpenCV provides methods to recognize ArUCO
markers in images. These methods are integrated into
the Unity3D application as a dynamic-link library.
The library is responsible for detecting markers in
camera images and returning its encoded ID, its nor-
mal vector and the coordinates of the marker corners.
CHIRA 2022 - 6th International Conference on Computer-Human Interaction Research and Applications
72
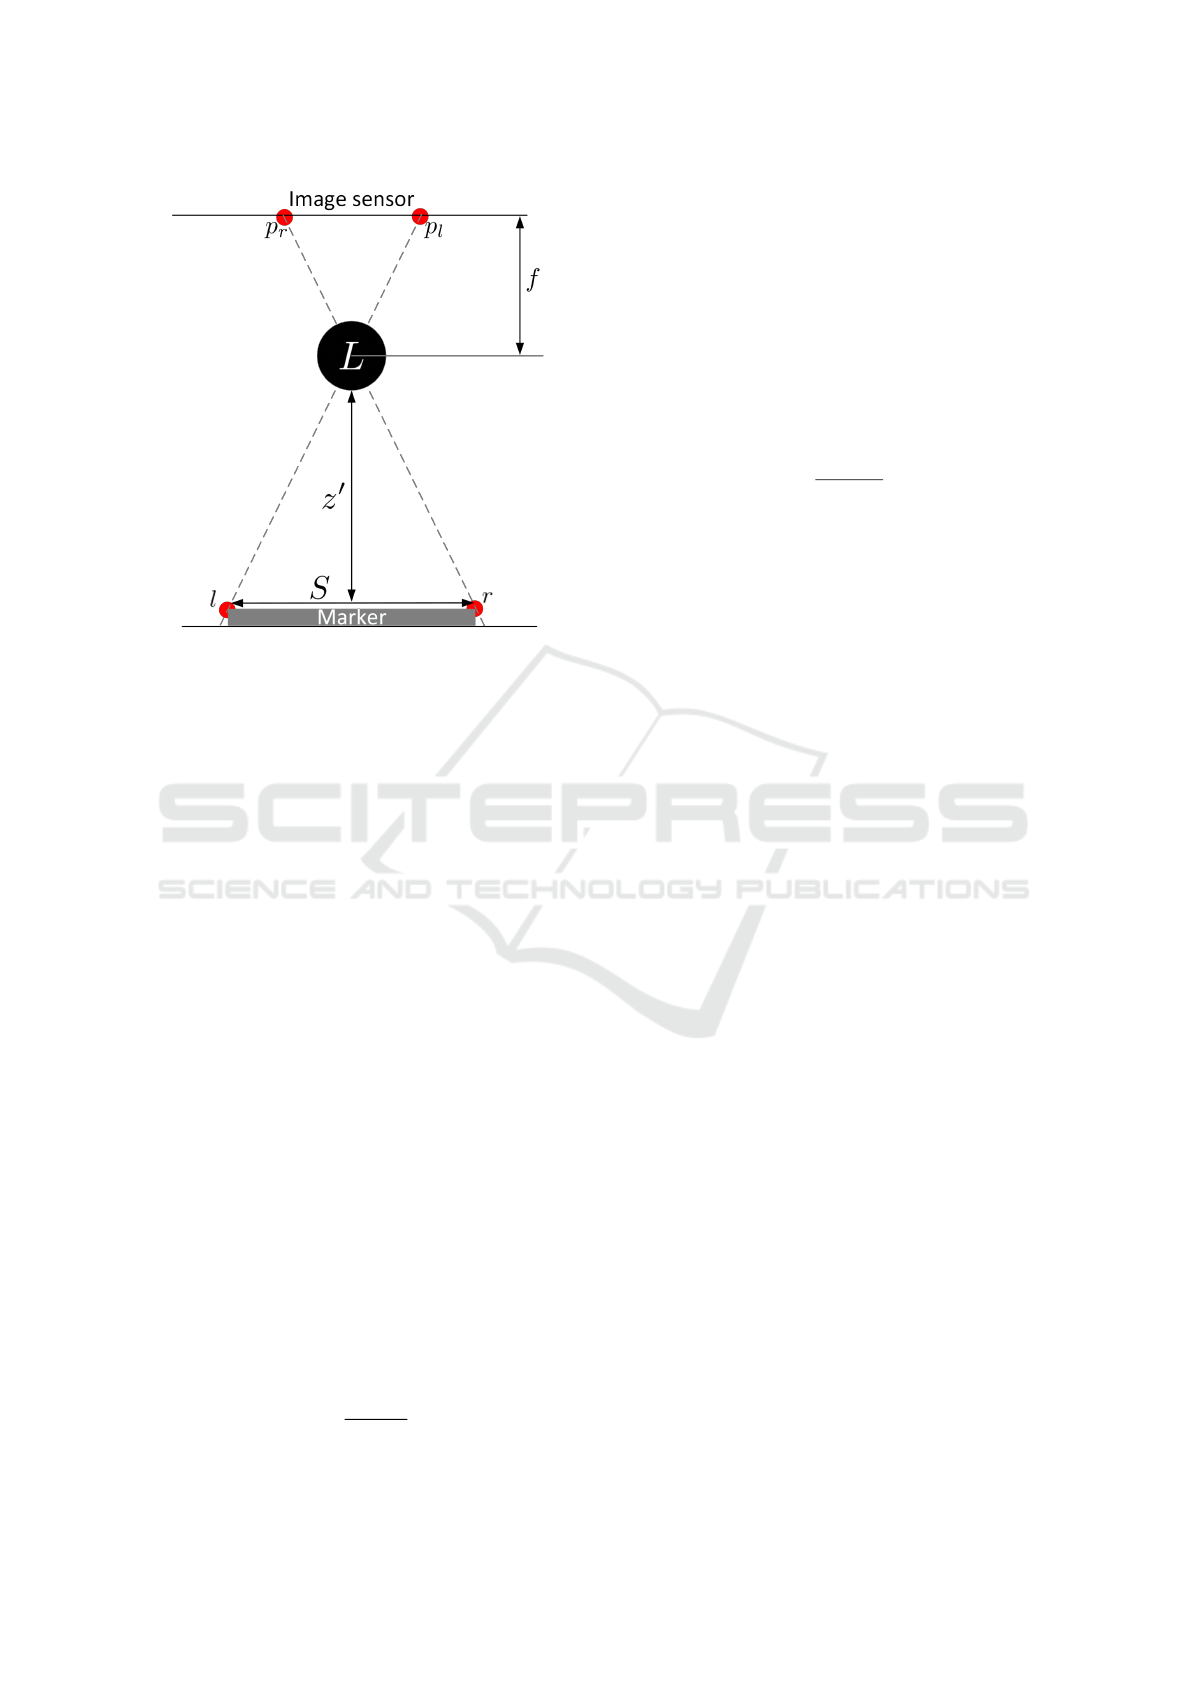
Figure 2: Conversion of the binocular disparity.
C#’s invoking and marshalling mechanisms are used
to call the methods of the library.
The process of recognition of these markers works
as follows: First, the image is turned to gray scale.
Color is not necessary for this process. Then square
structures are searched in the image. These are possi-
ble candidates for the markers, since the markers are
squares as well. Once the candidates are found, they
are further examined to figure out, if they contain an
encoded ID and thus are valid markers. The valid
markers are then returned, with their corresponding
recognized data, to the Unity3D application.
3.4 Distance Estimation
OpenCV returns the (x,y) coordinates of the mark-
ers corners in the image. To add a 3D component
to this information, the distance of the marker to the
camera must be calculated. Most of the so-called 3D
cameras use a similar approach to the binocular dis-
parity, as described by Asra Aslam and Mohammad
Samar Ansari (Aslam and Ansari, 2019). The au-
thors describe how to calculate the distance to an ob-
ject by taking two images from two cameras. These
two cameras are placed with a fixed and known dis-
tance T from each other. Both cameras use the same
focal length f and photograph the same scene. Now
the pixels on each image are compared and the pixel-
wise distance between pixels showing the same object
is computed. Using equation (1) the distance is then
calculated.
z =
f · T
|x
l
− x
r
|
(1)
A typical Android tablet only possesses one camera.
To calculate the distance with one camera, the binoc-
ular disparity approach must be altered. Using one
camera, the size of the object must be known. This
is given, since the markers have a fixed and known
size S. Also, the focal length f must be known. This
value is provided by Unity3D. Calculating the pixel-
offset between the provided corners of a marker deliv-
ers the third value necessary to calculate the distance
with only one camera. This is also shown in figure 2.
Using equation (2), it delivers the distance z
′
.
z
′
=
f · S
|p
l
− p
r
|
(2)
With this equation, the distance to a marker is calcu-
lated once a marker is found by OpenCV. The appli-
cation now has the location of a marker in the image
and also the distance to the marker from the camera.
With these, the marker is located in world coordinates
and an object is placed at its location in Unity3D’s co-
ordinate system. Since the markers placements on the
robot is known, the position of the robot is extrapo-
lated from the marker position.
As soon as a position of the robot is located,
Unity3D keeps its relative position to the robots’ sur-
roundings. This is done by tracking the tablet move-
ments with the help of gyro sensors and inertial mea-
surement units. This allows the application to only
update the robot position on a successful measure-
ment, while still keeping the objects at the correct
place when a worker is moving around.
3.4.1 Recognition Accuracy
The analysis of the accuracy of the distance measure-
ment approach described above is shown in figure
3. It shows the deviation of the measured distance
from the actual distance in percent. While the color
strength indicates the horizontal angle to the marker,
the different colors and line markers indicate the ver-
tical angle to the marker. The stronger the color, the
more perpendicular the angle to the marker. Measure-
ments are taken from 25°, 50°, 75° and 90° for vertical
and horizontal angles respectively. 90° corresponds to
the camera being orthogonal to the marker, while 25°
is the sharpest angle. The vertical angle corresponds
to moving the AR device up and down, and the hor-
izontal angle corresponds to left and right movement
of the AR device. During the measurements the cam-
era is pointed directly at the marker. The aim for this
measurement is to cover one eighth of a sphere, as
the results can be mirrored to the other seven eighths
of the sphere. Every measurement is also carried out
for six different distances. The distances tested range
from 50 cm to 300 cm.
Augmented Reality-based Visualization of the Reach of a Collaborative Robot
73
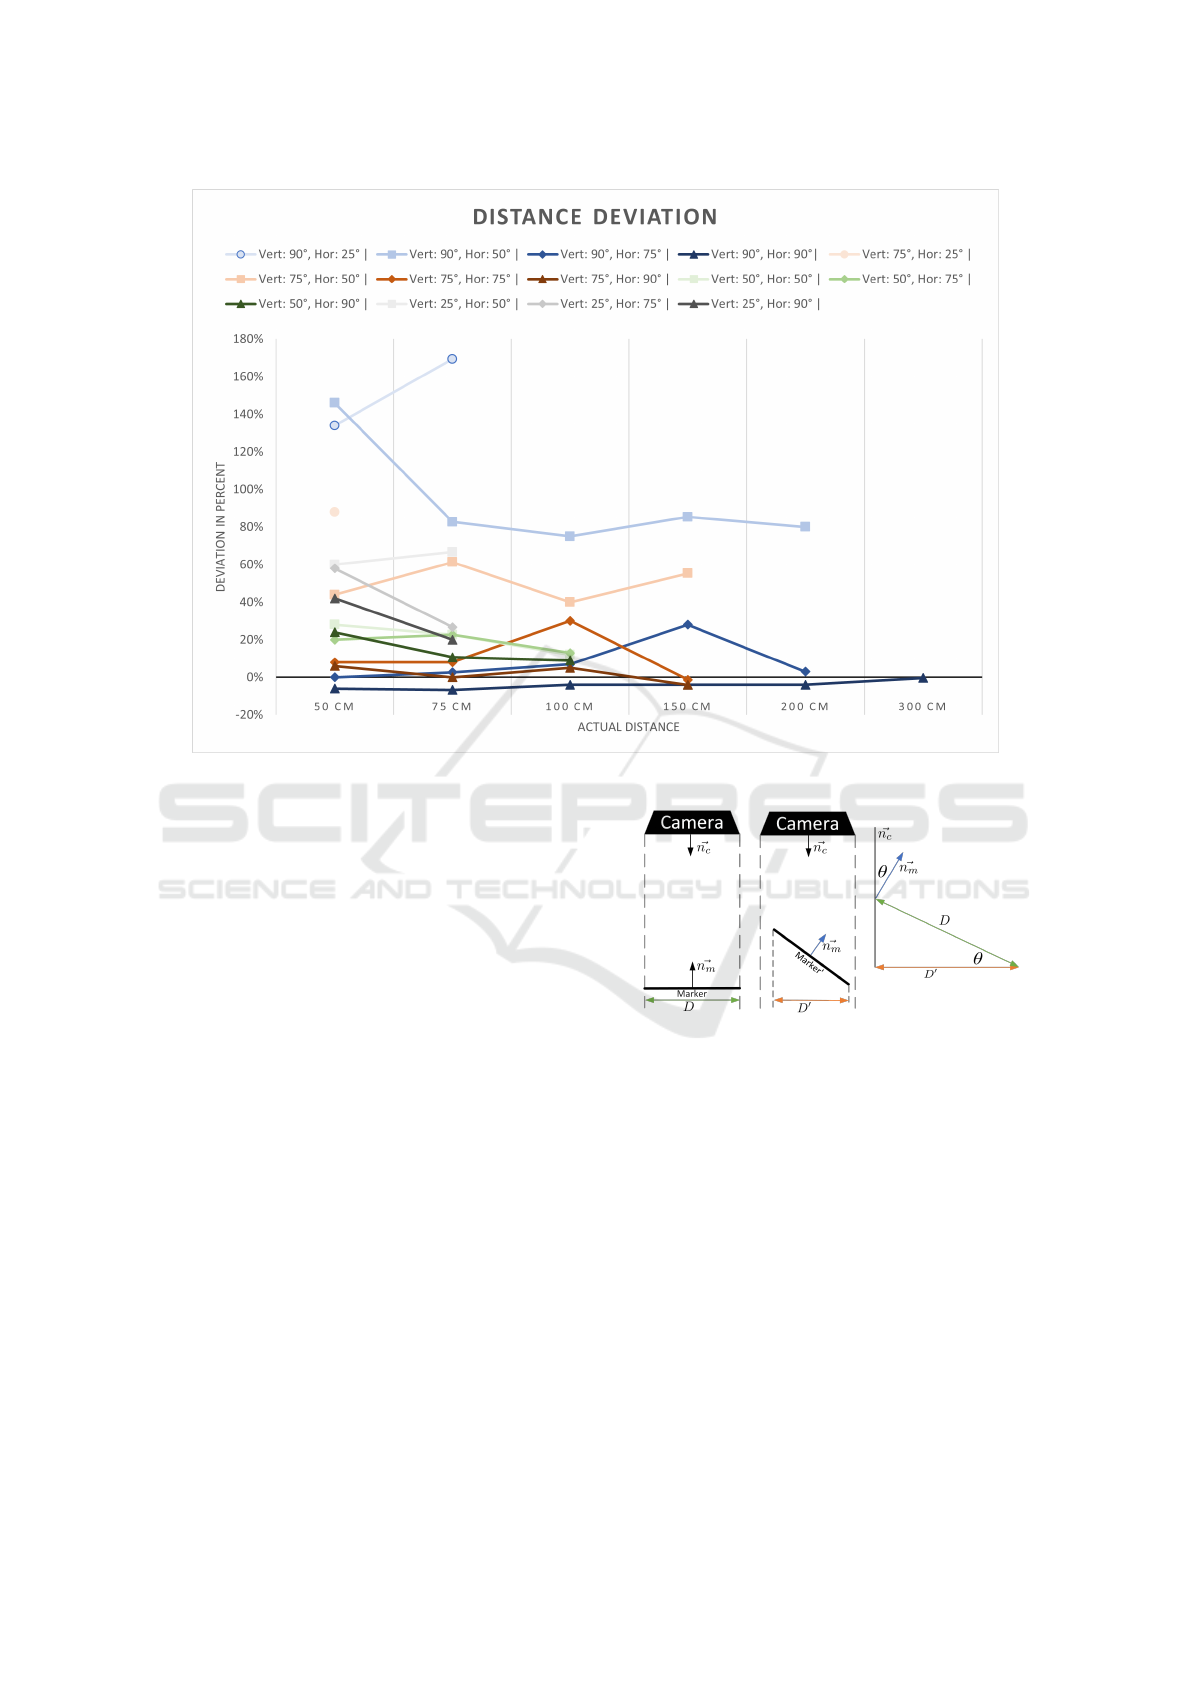
Figure 3: Deviation of the distance measured by the app in percent.
To estimate the distance, each position is tested
three times and the average is taken. A test for one
position is carried out by placing the AR device at the
given angles to a marker fixed at a wall and with a
given distance. The distance to the marker is mea-
sured directly between camera and marker, while the
angles are measured from the wall to the AR device
camera.
As expected, the figure shows that a perpendicular
viewing angle of the marker works best for distance
estimation, since it results in the smallest deviation
for every tested distance. Decreasing the horizontal
viewing angle increases the deviation. The accuracy
loss is even bigger for decreasing the vertical angle.
This deviation happens due to a difference in the
actual marker size and the projected marker size in the
image. To correct this difference the viewing angle
needs to be accounted for.
3.5 Viewing Angle Corrections
The projected marker is smaller in the image when
the cameras’ normal vector ⃗n
c
is not perpendicular to
the marker. This happens due to rotation of the AR
device. Under those circumstances the measurements
become inaccurate when using the fixed marker size
S.
The provided normal vector ⃗n
m
of the marker
Figure 4: Marker changing size in image.
is used to counteract bad measurements on non-
perpendicular angles of ⃗n
c
to the marker. Knowing
the relative rotation θ between ⃗n
c
and ⃗n
m
allows to
calculate the projected size of the marker. Figure 4
shows the difference in size of the projected markers
when the camera is rotated. Furthermore, it shows the
correlation between the length of the projected mark-
ers and a right-angled triangle. This correlation al-
lows to use the Pythagorean theorem in equation (3)
to calculate the smaller projected marker length S
′
.
S
′
= cos(θ) · S (3)
Using S
′
in equation (2) will result in calculating the
correct distance of a marker to the camera. Even if the
marker is rotated and the camera forward vector ⃗n
c
is
not orthogonal to the marker.
CHIRA 2022 - 6th International Conference on Computer-Human Interaction Research and Applications
74
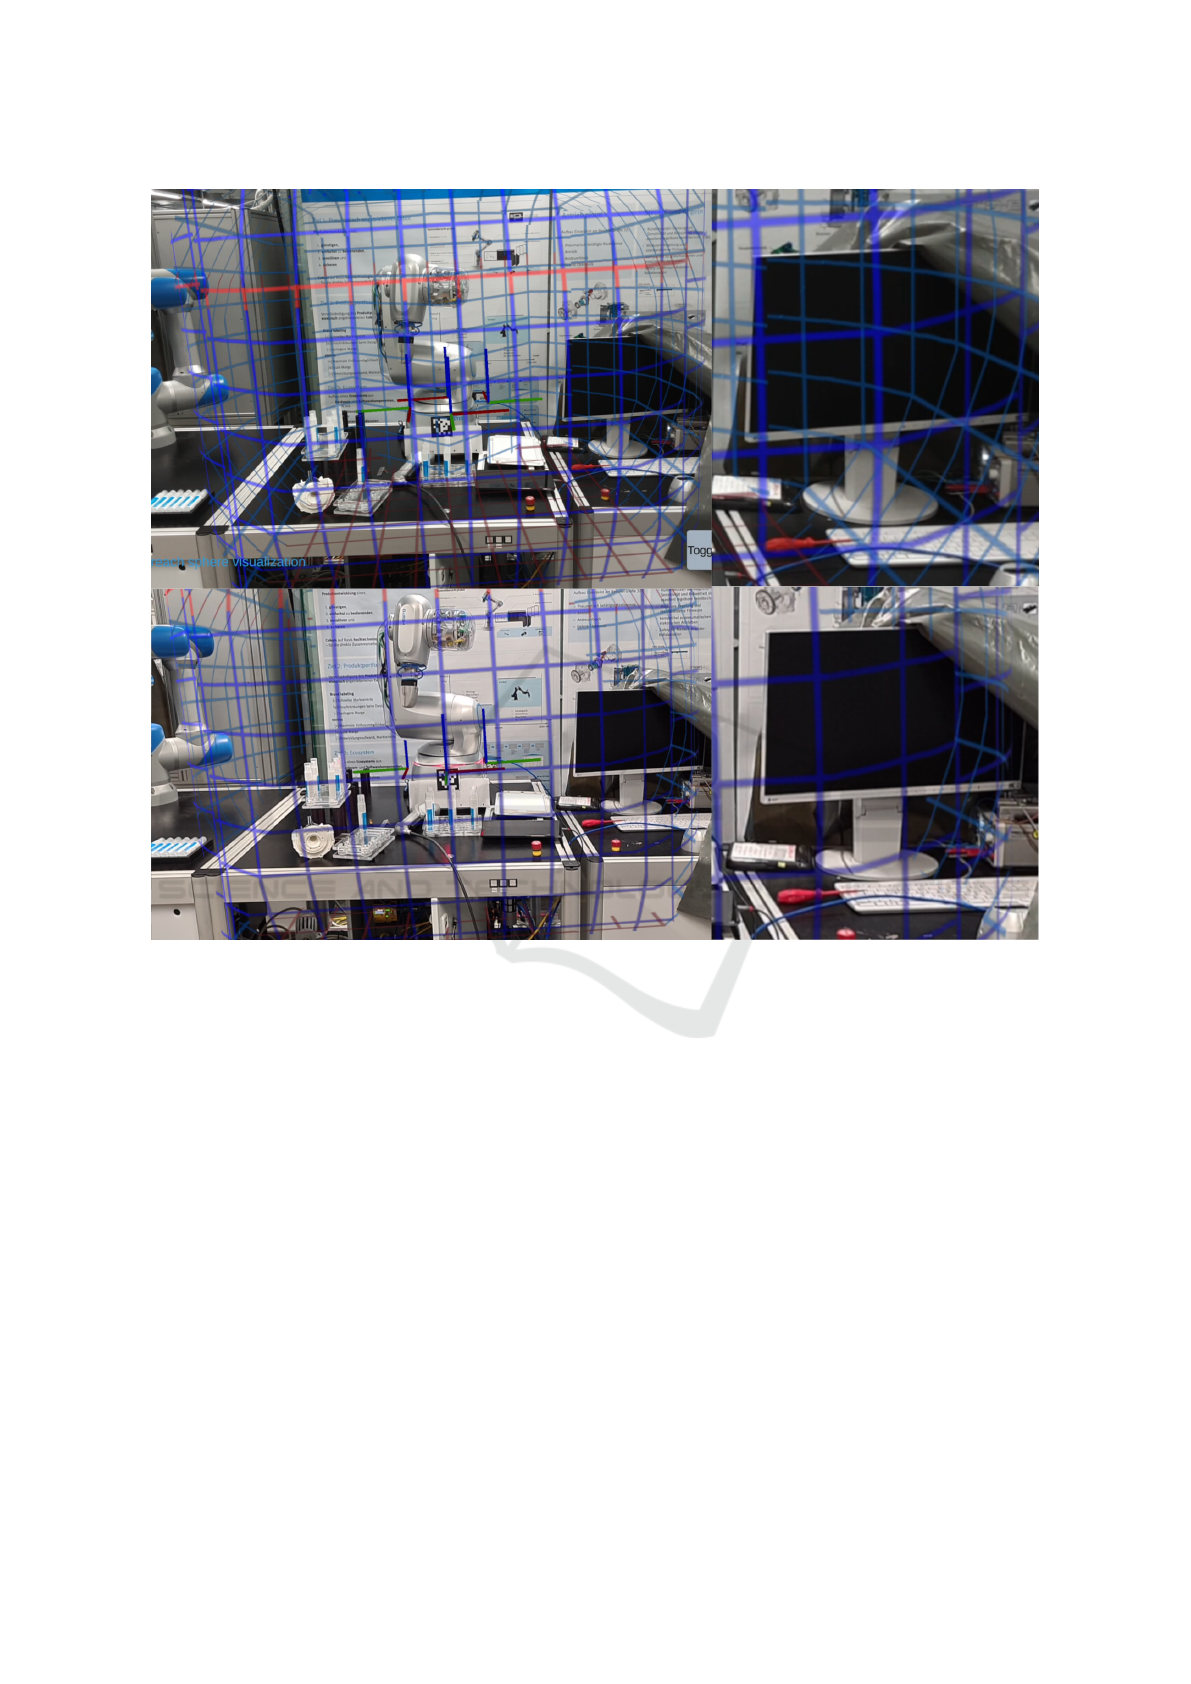
Figure 5: Comparison of the result without (top part) and with (bottom part) Depth API.
3.6 Exponentially Weighted Moving
Average
To give the worker a smooth experience, larger dif-
ferences in between frames need to be evened out.
OpenCV delivers the rotation of the marker, which is
not always the same, for consecutive frames without
moving the camera. This results in a shaky move-
ment of the virtual object representing the reach of
the robot. To get improved results, an exponen-
tially weighted moving average (EWMA) is used. By
weighing the newly calculated position and rotation
values against the already provided ones, the shaky
behaviour gets smoothed out. How to calculate the
EWMA is show in equation (4).
EWMA
t
= α · r
t
+ (1 − α) · EWMA
t−1
(4)
The EWMA is a recursive function which is usually
used in finance. The α is the weight with which each
old value is reduced before adding it to the average.
By using this equation for location and rotation val-
ues, the application filters out single bad measure-
ments, but is still able adapt to changes that persist
over a longer period of time by overriding the old val-
ues with each new measurement and thus changing
the average to be at the changed value.
3.7 Visualize the Reach
To visualize the reach of the robot, the reach must
be known. Therefore, the robot is simulated to reach
every possible position and the outer most position of
the tool head is marked. The created point cloud gives
an outer limit as to what the robot can reach. With
this point cloud, a 3D object can be modeled which is
representative of the robot reach and shown in figure
6. This model is loaded into Unity3D. Whenever the
robot is recognized successfully, this model is posi-
tioned around the robot base and shows the user the
Augmented Reality-based Visualization of the Reach of a Collaborative Robot
75
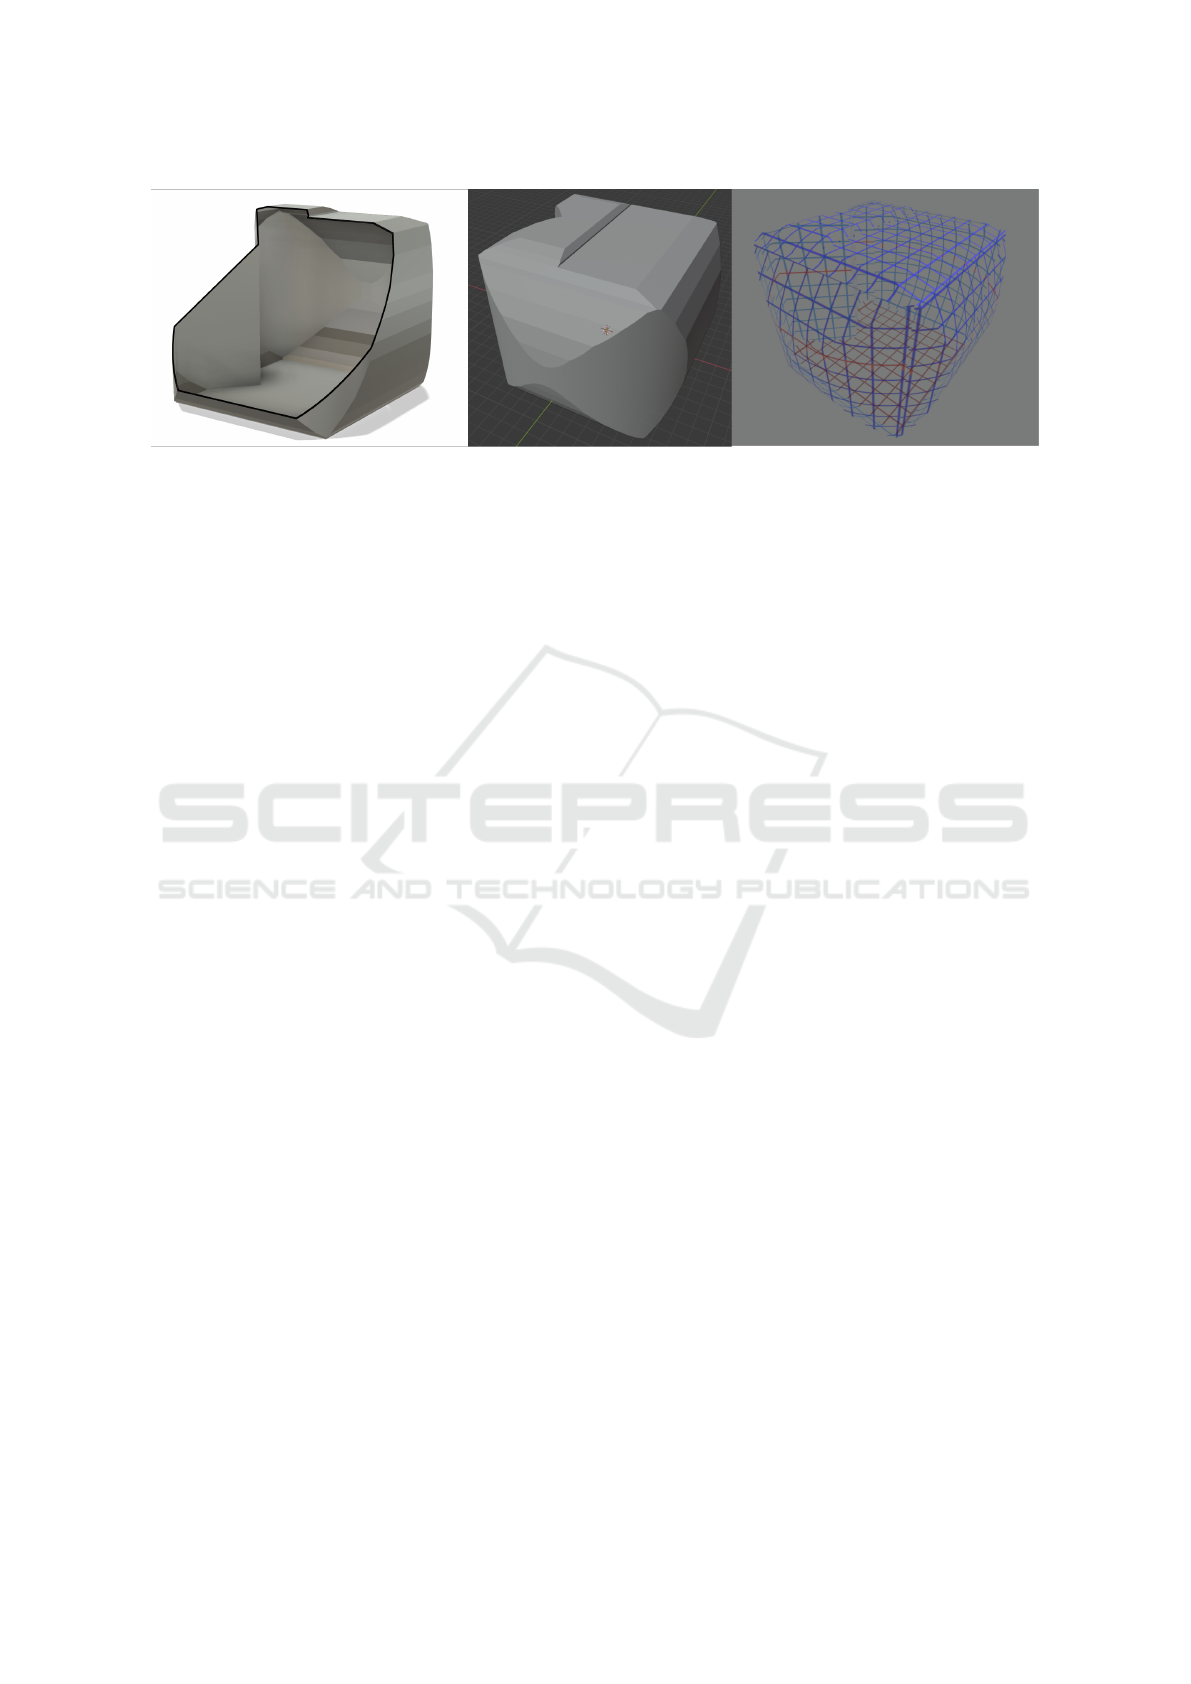
Figure 6: On the left a section analysis of the sphere object. In the middle single color approach to displaying the sphere. On
the right a mesh approach to displaying the sphere.
maximum reach.
The first approach to show the reach sphere in a
single color (figure 6 mid part, though the approach
was done with the sphere being transparent) was dis-
carded as it was not possible to understand where the
border of the reach of the robot is. Thus, in the chosen
approach, a mesh texture is displayed on the sphere
(figure 6 right part). This requires the sphere object
to be hollow, to also render a texture on the inside of
the sphere (figure 6 left part). The coloring shows the
worker from which side the sphere is viewed. Darker
blue for the outside and lighter blue for the inside of
the sphere. This enables the worker to distinguish
the reach borders and improves understanding of the
reach of the robot. Furthermore, a red scan line is
added. This line moves up and down on the sphere. It
is used as a moving element that helps to better differ-
entiate between the outside and inside of the sphere.
4 OCCLUSION DETECTION
Occlusion detection enables the application to detect
if virtual objects are hidden behind real world objects.
In doing so it allows the application to disable render-
ing for hidden virtual objects. Unity3D supports oc-
clusion detection by using device dependent APIs for
depth estimation.
Depth estimation is enabled when a device has
appropriate sensors (iPad: Lidar sensor) or power-
ful enough hardware to create a depth map through
image analysis in conjunction with motion sensor in-
put (modern Android devices (Google, 2022)). Once,
Unity3D detects that depth mapping is available, it
will automatically toggle the occlusion detection fea-
ture. This causes the application to pay attention to
the generated depth map for each frame and render
the virtual objects accordingly. If a virtual object is
hidden behind a real world object then only its visible
part is rendered.
Figure 5 is a comparison between what the worker
sees with occlusion detection disabled vs. enabled.
The top row shows the application with occlusion
detection disabled, while the bottom row shows the
application with occlusion detection enabled. The
zoomed in view on the right enlarges the monitor of
the image on the left. In the top, it is visible that the
sphere is rendered even though it is overlapping with
the monitor. Since occlusion detection is disabled, the
application does not know that the monitor is collid-
ing with the sphere and thus is not hiding the sphere
object. With occlusion detection enabled in the bot-
tom row, the monitor hides the sphere where it is col-
liding with the monitor. The effect of partially render-
ing the sphere improves the immersion of the worker,
since this is the anticipated effect. It also improves
understanding of the spheres’ position in relation to
the real world objects.
Occlusion detection improves immersion as it en-
ables the application to integrate the virtual objects
better into the scene with respect to the real world en-
vironment.
5 CONCLUSIONS
Visualizing the reach of a robot as proposed in this
paper not only improves the set-up procedure of a new
robot, but also helps the worker in his daily tasks with,
and around, the robot.
Visualizing the robot reach during set-up simpli-
fies the positioning of the robot. The robot needs to
reach all of its tools and work pieces, and by enabling
the setup worker to see the reach, it is possible to con-
figure the robot position without powering the robot
up. This also speeds up the set-up process by reducing
the number of reach test that need to be done to con-
firm if the robot is able to reach everything he needs
to reach.
Furthermore, the application also supports the
CHIRA 2022 - 6th International Conference on Computer-Human Interaction Research and Applications
76

worker while working around the robot. It enables
the worker to understand what the robot can reach.
This understanding also improves the safety of the
worker. The worker is able to see where the robot can
reach and thus reduce accidents when working with
the robot.
The quantity of these results are subject of further
research.
Further improvements to the application to in-
crease the support for the worker could be imagined.
The depth map could be used to also show areas
where the robot is possibly colliding with objects in-
side its reach sphere. The visualization of these areas
could improve the programming process of the robot
by showing the worker which areas to avoid during
program execution. The application could also show
the worker information for the ports on the backside
of the robot. This will improve understanding of the
ports and their corresponding functions.
REFERENCES
Aslam, A. and Ansari, M. S. (2019). Depth-map generation
using pixel matching in stereoscopic pair of images.
CoRR, abs/1902.03471.
Bradski, G. (2000). The OpenCV Library. Dr. Dobb’s Jour-
nal of Software Tools.
Chang, S.-N. and Chen, W.-L. (2017). Does visualize indus-
tries matter? a technology foresight of global virtual
reality and augmented reality industry. In 2017 In-
ternational Conference on Applied System Innovation
(ICASI), pages 382–385.
Galin, R. and Meshcheryakov, R. (2019). Automation and
robotics in the context of industry 4.0: the shift to col-
laborative robots. IOP Conference Series: Materials
Science and Engineering, 537(3):032073.
Garrido-Jurado, S., Mu
˜
noz-Salinas, R., Madrid-Cuevas, F.,
and Medina-Carnicer, R. (2015). Generation of fidu-
cial marker dictionaries using mixed integer linear
programming. Pattern Recognition, 51.
Google (2022). Overview of arcore and
supported development environments.
https://developers.google.com/ar/develop?hl=en.
Online; accessed 28 July 2022.
Kopp, T., Baumgartner, M., and Kinkel, S. (2021). Success
factors for introducing industrial human-robot inter-
action in practice: an empirically driven framework.
The International Journal of Advanced Manufactur-
ing Technology, 112.
Mourtzis, D., Zogopoulos, V., and Vlachou, E. (2017).
Augmented reality application to support remote
maintenance as a service in the robotics industry. Pro-
cedia CIRP, 63:46–51. Manufacturing Systems 4.0 –
Proceedings of the 50th CIRP Conference on Manu-
facturing Systems.
Mourtzis, D., Zogopoulos, V., and Vlachou, E. (2018).
Augmented reality supported product design towards
industry 4.0: a teaching factory paradigm. Procedia
Manufacturing, 23:207–212. “Advanced Engineer-
ing Education & Training for Manufacturing Inno-
vation”8th CIRP Sponsored Conference on Learning
Factories (CLF 2018).
Paelke, V. (2014). Augmented reality in the smart factory:
Supporting workers in an industry 4.0. environment.
In Proceedings of the 2014 IEEE Emerging Technol-
ogy and Factory Automation (ETFA), pages 1–4.
Romero-Ramirez, F., Mu
˜
noz-Salinas, R., and Medina-
Carnicer, R. (2018). Speeded up detection of squared
fiducial markers. Image and Vision Computing, 76.
Wang, P., Bai, X., Billinghurst, M., Zhang, S., Han, D., Lv,
H., He, W., Yan, Y., Zhang, X., and Min, H. (2019).
An mr remote collaborative platform based on 3d cad
models for training in industry. In 2019 IEEE Inter-
national Symposium on Mixed and Augmented Reality
Adjunct (ISMAR-Adjunct), pages 91–92.
Augmented Reality-based Visualization of the Reach of a Collaborative Robot
77
