
RGB-D Structural Classification of Guardrails via Learning from
Synthetic Data
Kai G
¨
obel
1 a
, Csaba Beleznai
1 b
, Alexander Sing
1 c
, J
¨
urgen Biber
1
and Christian Stefan
2
1
Center for Vision, Automation & Control, AIT Austrian Institute of Technology GmbH, Vienna, Austria
2
Center for Low-Emission Transport, AIT Austrian Institute of Technology GmbH, Vienna, Austria
Keywords:
Vision-based Environment Perception, Road Infrastructure Analysis, Semantic Segmentation.
Abstract:
Vision-based environment perception is a key sensing and analysis modality for mobile robotic platforms.
Modern learning concepts allow for interpreting a scene in terms of its objects and their spatial relations.
This paper presents a specific analysis pipeline targeting the structural classification of guardrail structures
within roadside environments from a mobile platform. Classification implies determining the type label of an
observed structure, given a catalog of all possible types. To this end, the proposed concept employs semantic
segmentation learned fully in the synthetic domain, and stereo depth data analysis for estimating the metric
dimensions of key structural elements. The paper introduces a Blender-based procedural data generation
pipeline, targeting to accomplish a narrow sim-to-real gap, allowing to use synthetic training image data to
train models valid in the real-world domain. The paper evaluates two semantic segmentation schemes for the
part segmentation task, and presents a temporal tracking and propagation concept to aggregate single-frame
estimates. Results demonstrate that the proposed analysis framework is well applicable to real scenarios and
it can be used as a tool for digitally mapping safety-critical roadside assets.
1 INTRODUCTION
Recent developments in machine learning and vi-
sual perception open up new ways to digitally map
large-scale environments in a fully automated man-
ner. Several application domains exist where an area-
wide mapping step introduces great benefits. Such
task domains range from autonomous driving, robotic
navigation to geographic information systems. In
all these cases recognition and mapping of the en-
vironment tends to be linked to safety-related as-
pects, as location-specific priors can enhance contex-
tual awareness and complement sensory perception.
Spatial digitization of roadside infrastructure is
also a topic where perception and mapping play
a role, because recognition of common infrastruc-
tural assets (traffic signs, traffic lights, lane struc-
ture, etc.) in a spatial context significantly enhances
the robustness and safety of autonomous operations.
Guardrails, also called vehicle restraint systems repre-
sent additional important roadside infrastructural el-
a
https://orcid.org/0000-0001-5074-3652
b
https://orcid.org/0000-0003-1880-2979
c
https://orcid.org/0000-0002-3340-1789
ements, which have received less research attention
so far. The relevance of an automated guardrail sur-
vey is mainly given by capturing its local character-
istics and to translate these measurements into inter-
pretable measures representing local safety levels for
the case of run-off-road accidents. Within the con-
text of a roadside safety management process, such
geo-referenced measurements can contribute to mon-
itor and regulate road safety standards at a large geo-
graphic scale. In Germany and Austria there are over
150 different guardrail types along the roads, exhibit-
ing a great structural diversity which we seek to rep-
resent and learn.
In this paper we introduce a mobile stereo-
vision-based processing concept and multi-cue anal-
ysis scheme for classifying guardrail structures via
appearance and depth cues. The overall workflow
is illustrated in Figure 1. A semantic segmenta-
tion analysis is employed to spatially delineate key
functional parts, while dense stereo depth computa-
tion yields metric measurements (height, spacing be-
tween specific parts), distinctive for specific guardrail
types. The sensor is mounted on a survey vehicle
which can travel up to 60km/h, therefore individual
measurements are aggregated in a time-consecutive
Göbel, K., Beleznai, C., Sing, A., Biber, J. and Stefan, C.
RGB-D Structural Classification of Guardrails via Learning from Synthetic Data.
DOI: 10.5220/0011561300003332
In Proceedings of the 14th International Joint Conference on Computational Intelligence (IJCCI 2022), pages 445-453
ISBN: 978-989-758-611-8; ISSN: 2184-3236
Copyright © 2023 by SCITEPRESS – Science and Technology Publications, Lda. Under CC license (CC BY-NC-ND 4.0)
445
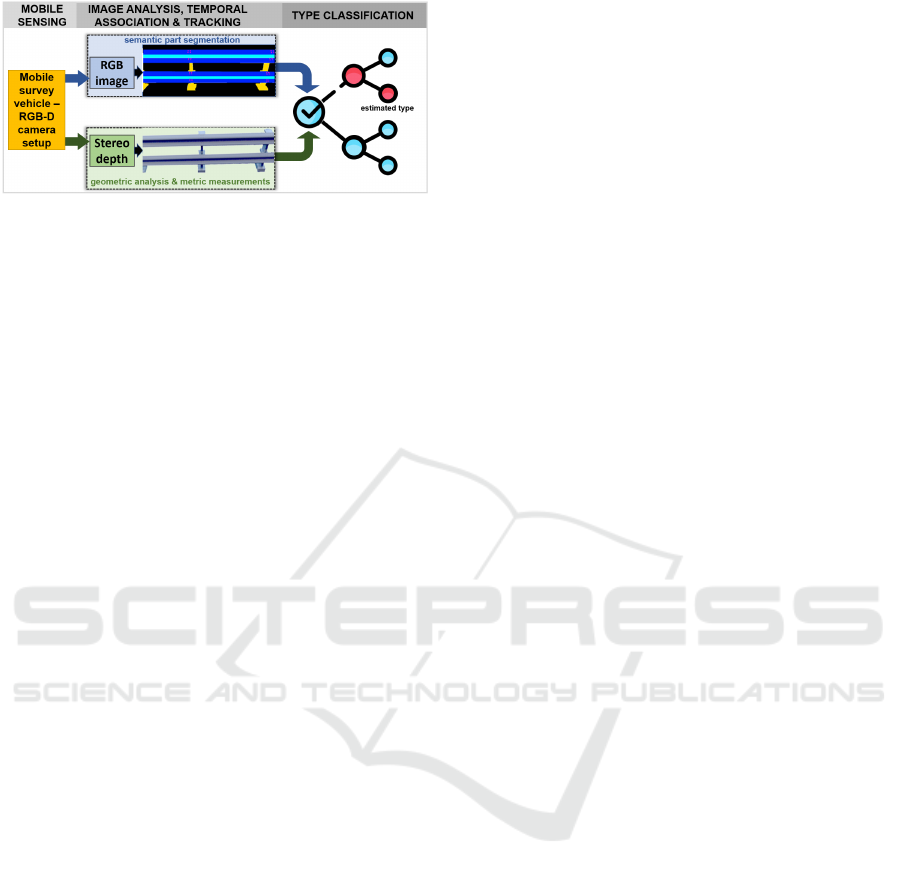
Figure 1: Schematic illustration depicting the combined
appearance- and geometry-aware analysis for guardrail
structural classification.
manner using a simple structure-based registration
scheme. The task-specific goal is to classify an ob-
served guardrail segment into one of the pre-defined
type categories. To this end, we employ a decision
tree based classification scheme with the measured at-
tributes guiding the classification process towards a
certain type estimate.
The paper introduces following contributions: we
present a viable systemic concept for performing
RGB-D guardrail analysis on a moving survey plat-
form. To accomplish the spatial segmentation and
classification tasks, we present a fully synthetic data
generation pipeline yielding a high structural diver-
sity embedded into varying viewing and photometric
conditions. In the context of the classification task
we evaluate two semantic segmentation schemes (IC-
Net (Zhao et al., 2018), SwinTransformer (Liu et al.,
2021)) with different accuracy-vs-run-time charac-
teristics. This analysis sheds light on the accuracy
differences between two different processing scenar-
ios: real-time on-board analysis (ICNet) versus off-
line processing via SwinTransformer. Results are
analyzed in terms of the semantic segmentation ac-
curacy on a real test set. Furthermore, the paper
presents evaluation for type-specific classification of
guardrails via a decision tree.
The paper is structured as follows: in Section 2
we describe related works. Section 4 presents the de-
vised data generation and RGB-D analysis methodol-
ogy, which is evaluated and discussed in Section 5.
Finally, Section 6 concludes the paper.
2 RELATED WORKS
In this section we present relevant works related to
vision-based sensing and classification of roadside in-
frastructure. Furthermore, since Deep Learning con-
cepts require much data with labeling, a concise sum-
mary on related datasets and synthetic data generation
concepts is included as well.
Vision-based Sensing and Classification: In recent
years, emerging spatial sensing technologies, espe-
cially 3D laser-scanning (Fang et al., 2015) and high-
resolution stereoscopy (Xu and Zhang, 2020) provide
new ways to capture accurate geometric and appear-
ance information of large-scale environments such as
roads and their assets. Mobile laser mapping by Lidar
sensors targeting pole-like objects (lamp posts, trees,
traffic lights, noise barriers) in urban environments
is presented in (Golovinskiy et al., 2009), (Li et al.,
2019). While these works do not detect and analyze
guardrail structures, their spatial sensing modalities
are applicable to such scenarios. Furthermore, these
systems do not exploit image information, their anal-
ysis and classification concept is based exclusively on
point cloud data.
Works focusing on automated image-based dig-
ital mapping of roadside guardrail structures exist
only few. Prototypical automated roadside infras-
tructure segmentation and classification concepts are
proposed in (Golparvar-Fard et al., 2015), (Balali
and Golparvar-Fard, 2015) and (Smith et al., 2013).
These works employ a Random Forest classification
approach and capture appearance via texture units
(Shotton et al., 2008), as being the most accurate
classification scheme prior to Deep Learning based
analysis schemes. These methods, although requiring
less training data, yield nevertheless comparatively
low recognition accuracy and segmentation quality.
A recent survey on roadside video data analysis via
Deep Learning (Verma et al., 2017) reveals that Deep
Learning schemes prevail in structure recognition and
assessment tasks.
Datasets: To cope with the typical diversity observed
in real roadside images, Deep Learning based meth-
ods require large curated training datasets. To mit-
igate the need for labeled data, recently introduced
approaches (Rezapour and Ksaibati, 2021), (Sainju
and Jiang, 2020) adopt transfer learning to accom-
plish model specialization towards the guardrail do-
main. (Chen, 2021) presents a geographically di-
verse annotated dataset, however limited to noise
barriers. The Mapillary Vistas dataset (Neuhold
et al., 2017) contains annotated image instances for
guardrail structures and for other roadside infrastruc-
ture elements. However, it does not contain structural
fine-annotations, and no specific analysis methodol-
ogy has been presented based on this dataset so far.
Synthetic Data Generation: The usage of syn-
thetic data is a popular scheme to enrich real train-
ing datasets (Georgakis et al., 2017), or to rely on
purely synthetic training images (Hinterstoisser et al.,
2019), (Tremblay et al., 2018). The synthetic and real
image domains, depending the employed represen-
tations, typically exhibit a ”sim-to-real” or ”domain
ROBOVIS 2022 - Workshop on Robotics, Computer Vision and Intelligent Systems
446
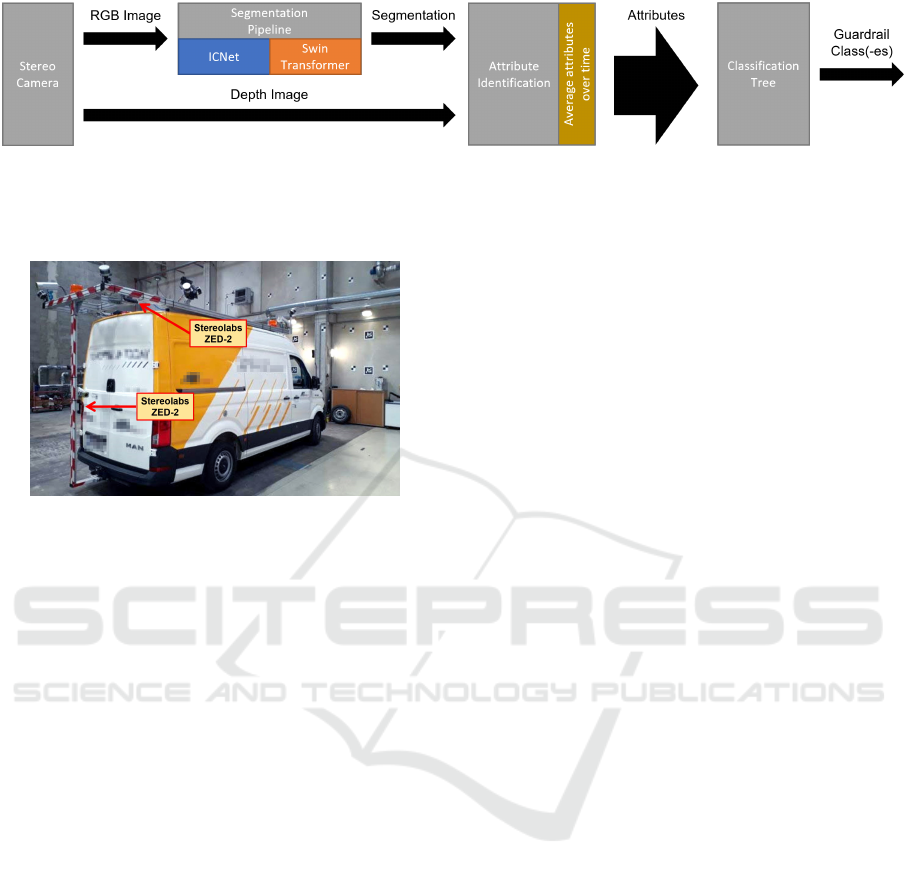
Figure 2: The systemic structure of the proposed classification pipeline. A stereoscopic camera provides RGB-D data as the
input. The RGB image is used for semantic segmentation, while depth data yields metric size measurements for the different
structural elements. Guardrail attribute estimates are propagated over time to yield stable estimates for a given guardrail
segment. Finally, a decision tree is used to assign a guardrail-type class label.
Figure 3: The mobile survey vehicle equipped with two
stereo camera heads to acquire (each independently) an
RGB and depth image for the guardrail analysis task.
gap” to a certain extent. This discrepancy prevents
models trained in the synthetic domain from perform-
ing equally well in the real domain. Recent advances
in simulation environments and real-time rendering,
such NVidia Isaac Gym (Makoviychuk et al., 2021)
and NVidia Omniverse (NVidia, 2022), (Zhao et al.,
2022), allow for generating vast amounts of diversi-
fied and photo-realistic training data.
In our paper we also adopt a fully synthetic train-
ing data generation concept, because collecting and
fine annotating all variations of encountered guardrail
structures and appearances represent a far too great
burden.
3 SENSOR SETUP
As shown in Figure 3, a van-sized vehicle was
equipped with two stereo-vision sensors (ZED-2 cam-
era by Stereolabs (Stereolabs, 2022)). Live stereo
image streams can be either analyzed on-line using
desktop computer hardware (NVidia RTX 3090) set
up within the van cargo bay, or recorded and pro-
cessed off-line using multiple modern GPU’s. Other
sensors (LiDAR, monocular cameras) were not used
for the guardrail analysis task. Survey speeds up
to 60 km/h have resulted in time-consecutive non-
overlapping image material, nevertheless, guardrail
types along a road segment do not vary often, there-
fore a sparser spatial sampling was not critical for the
targeted mobile guardrail mapping task.
4 METHODOLOGY
The overall methodology is depicted in Figure 2.
Our main analysis modality is based on semantic
segmentation of RGB images. We independently
evaluate two semantic segmentation algorithms for
this step. The image-based structural segmenta-
tion is complemented by metric depth/size measure-
ments of guardrail parts from the stereo depth data,
to resolve ambiguities between structurally similar
guardrail types. At higher travel speeds, RGB im-
ages still resolve sufficient detail about fine struc-
tures (waves, poles), while depth measurements of-
fer a depth accuracy sufficient to assess the dimen-
sions of larger structural elements (beam width and
height, pole spacing). The proposed combination of
RGB-D analysis modalities thus yields a set of spe-
cific measurements which remove much ambiguity
when estimating the guardrail type. The per-frame
type estimates are propagated over time (assuming a
locally constant guardrail type along a road segment)
to select most probable type estimates and accomplish
their temporal stability. Obtained type estimates are
geo-referenced using an on-board GPS sensor.
4.1 Synthetic Data Generation
Since publicly available roadside environment
datasets do not focus on the guardrail classification
task, and fine structural labeling requires enormous
labor, we employ a synthetic image generation
pipeline for the semantic segmentation task. More-
over, by establishing a synthetic guardrail modeling
and rendering workflow, we can optimally design
the representational granularity and labelling policy
of the sought structural features on the guardrail
elements.
RGB-D Structural Classification of Guardrails via Learning from Synthetic Data
447
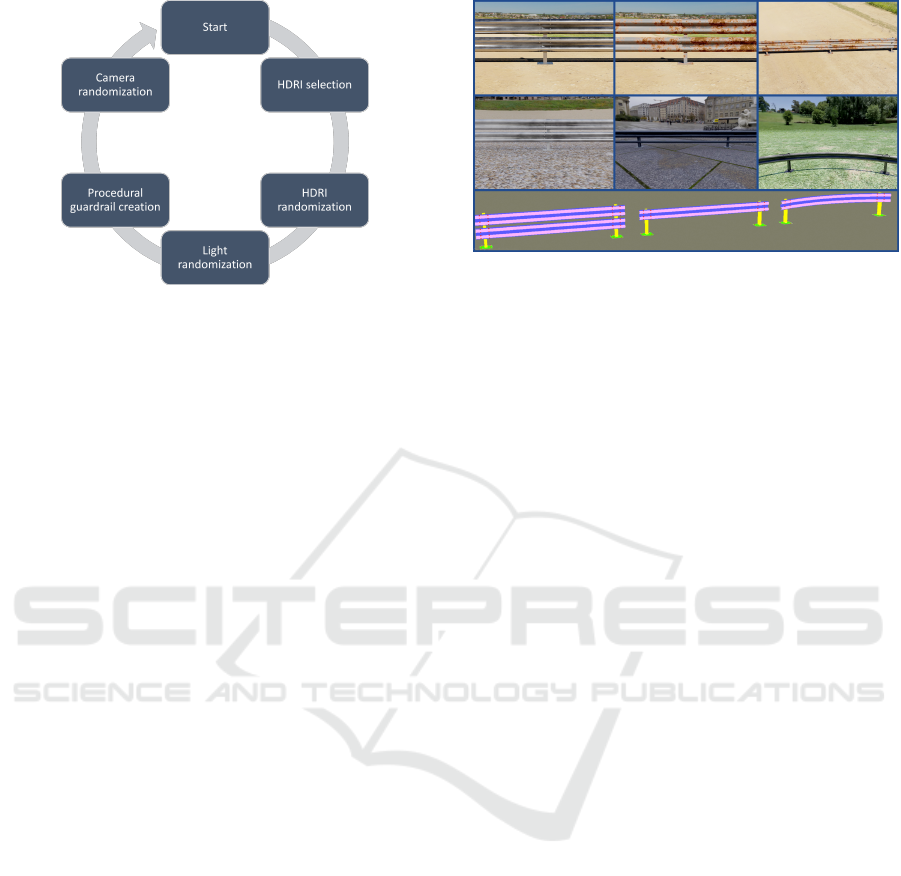
Figure 4: The procedure of synthetic data generation yield-
ing photometric and structural variations in each generation
cycle. The output of the synthesis is a rendered RGB image
and a matching label map outlining individual structural el-
ements.
A key question is whether synthetic guardrail
structure appearances will well match that of the real
domain; a critical condition to be met towards apply-
ing models learned in the synthetic domain on real
data. Fortunately, guardrails exhibit a strict regularity
in terms of their material and structure: typically they
are made of steel with specific coating or galvaniza-
tion applied to their surfaces. Due this regularity and
controlled oxidation and wear, the distributional space
of typical metallic appearances can be well recreated
by photo-realistic rendering solutions.
To create a synthetic guardrail dataset, Blender
(Blender-Foundation, 2022) is used as a modelling
and rendering tool. The synthesis tool was set up
as a python-based project, randomizing illumination,
guardrail part and camera assets across different con-
figurations, which individually yield a rendered RGB
image and a matching segmentation label image. Fig-
ure 4 illustrates the overall data generation process.
Photometric variations are created using a large (150)
pool of high-dynamic-range dome images (HDRI). In
addition, these images are randomly rotated to create
diverse illumination effects in terms of incidence an-
gle and light distribution across the scene. Material
attributes are generated using a set of 20 metal and
30 corrosion and dirt textures, procedurally mixed to
generate vastly diverse surface properties.
Guardrail geometric variations are created by us-
ing a set of manually modeled structure elements such
as beam elements with different wave numbers, pro-
files and degree of bending, poles, bolts and ground
plates. The spatial location (beam and pole heights,
pole spacing, number of bolts, their location and spac-
ing) are varied procedurally, to create a large number
of plausible guardrail structures. Finally, the Blender
camera viewing angles (azimuth [-45°,45°], eleva-
Figure 5: Some example synthetic guardrail structures with
diverse structure, background, material and lighting. Bot-
tom row: ground truth semantic label maps for some struc-
tural prototypes.
tion [10°,50°]) and distance-to-object [2m, 10m] are
randomized within a range, where the range centers
represent typical view geometries encountered during
mobile surveys.
Since learned semantic segmentation models in-
trinsically capture spatially correlated structural ele-
ments (e.g. regular bolt arrays near poles), it is es-
pecially important during synthesis to cover frequent
structural patterns and also introduce certain stochas-
tic variations beyond that, to enhance the the model’s
generalization power in real scenarios. For example,
a beam structure seen always centered along the im-
age height during training time will induce a strong
location-based bias, preventing a trained model from
correctly inferring off-center structures in test images.
Programatically, we also generate semantic label
maps in Blender, delineating key guardrail structural
elements. These semantic label maps are used jointly
with the synthetic RGB images for training the se-
mantic segmentation models, as described in Sec-
tion 4.2. Since the primary objective of the seman-
tic segmentation step is to yield a meaningful se-
mantic map for guardrail-type classification, therefore
a set of type-specific structural attributes have been
identified to facilitate this task. We define 7 seman-
tic classes: {wave convex, wave concave, pole, bolt,
ground plate, underride protection bar, background}.
By defining specific classes pertaining to the concave
and convex beam wave profiles, determining the wave
number (a highly specific attribute) from the segmen-
tation results becomes significantly easier. Some gen-
erated synthetic guardrail structures and label maps
are shown in Figure 5.
Using the Cycles render engine in Blender, we
generate 100,000 synthetic images and matching (at
pixel-level) semantic label maps for semantic model
learning. The image resolution of both image and se-
mantic maps is 1920 × 1080 pixels.
ROBOVIS 2022 - Workshop on Robotics, Computer Vision and Intelligent Systems
448

4.2 Semantic Model Training
To perform the semantic segmentation task, we
trained and evaluated two different semantic seg-
mentation frameworks using distinct representational
strategies and exhibiting different accuracy-vs-run-
time performances. The two neural architectures used
are ICNet (Zhao et al., 2018) and Swin Transformer
(Liu et al., 2021).
ICNet (Image Cascade Network) is a framework
for real-time semantic segmentation. To achieve effi-
ciency, a multi-resolution concept is adopted where
low-resolution segmentation estimates guide pixel-
wise label inference at incrementally higher spatial
resolutions. This step-wise refinement scheme re-
duces the computational cost and the memory con-
sumption. Sharing weights and computations be-
tween different resolution levels contributes to the
high run-time performance. At the same time, the
main representational drawback is also given by the
initial low resolution step, as many details are omit-
ted at the early segmentation step, which are not fully
recovered later on.
The Swin Transformer (Liu et al., 2021) is
a hierarchical vision Transformer that uses shifted
non-overlapping local windows to calculate inten-
sity structural correlations, while also allowing for
connections between local windows. Transform-
ers originate from the natural language process-
ing domain. The shifted local windows limit the
computationally-intensive self-attention calculation
to non-overlapping localities, while its hierarchical
formulations allows for models at varying scales.
Capturing structural correlations between guardrail
parts at larger distances, and at the same time keep-
ing much image detail yield a powerful learned repre-
sentational backbone. Despite the partitioned analysis
concept, Swin Transformers require more computa-
tion time (up to few seconds for 1080p resolutions),
which limits them to a usage in off-line analysis sce-
narios.
4.3 Structural Analysis, Temporal
Reasoning and Classification
We use depth information to identify specific struc-
tural characteristics of the guardrail. We employ
the ZED-2 camera’s stereo API (Stereolabs, 2022)
to compute dense depth maps with the Ultra qual-
ity setting. As the input stereo image pair exhibits
motion blur artifacts at higher travel speeds, stereo
matching becomes less exact in the absence of spe-
cific image details. Experiments have showed that
small-sized structures (bolts, holes) are too small to
reliably resolve them spatially, however, larger struc-
tures (wave dimensions, profile, pole spacing) exhibit
a good signal-to-noise ratio to perform depth-based
measurement.
The wave profile can have a round or square
shape. From the dense stereo depth map we in-
tend to derive beam profile signatures, where the
term profile stands for the wave shape and dimen-
sion between the top and bottom extremities of a
beam wave. First, given the RGB-based segmenta-
tion for the beam wave, we sample the depth profile
data along the beam at n different locations, normal-
ize profile signatures to a unit length and compute the
median of the n sampled profile signatures. Within
this normalized and averaged signal space, we fit a
spline model to the signal, and match the spline data
to both a round and a square wave profile. A better
match yields our profile shape estimate.
The metric pole distances are estimated by com-
bining the depth data and the segmentation images.
We use the semantic label map to selectively access
pixels corresponding to pole objects in the image and
in the depth map. A connected component analysis
retains pole candidates as individual objects. Depth
measurement within the pole candidates are converted
into (x,y,z) coordinates and their median value gen-
erates a pole’s 3D position. If several pose objects are
detected in an image, their 3D distance is computed.
The metric distances between nearest pole pairs are
accumulated over time in a distance histogram. Re-
curring pole-to-pole distances emerge as a prevailing
peak in the binned distance distribution after time-
accumulating many measurements along a given road
segment. Using a Mean Shift mode seeking technique
(Comaniciu and Meer, 2002), we detect the peak of
maximum density within this distribution, yielding a
pole distance estimate.
A similar approach is employed to determine
the existence of ground plates, which are the op-
tional metallic plates below the individual poles. The
corresponding label maps are analyzed using con-
nected components and ground plate object candi-
dates within a plausible distance to the beam wave
are retained. The temporal pairwise distance aggre-
gation scheme and the search for the dominant mode
can well discover the sought recurring repetitive dis-
tances despite erroneous object candidates and clus-
tering errors.
The sought height of the beam wave is given by
the distance between its top edge and the ground (as-
suming a locally planar ground). This estimation task
is again performed using a combination of depth data
and the segmentation image. All existing segmenta-
tion labels are taken into account to form a mask for
RGB-D Structural Classification of Guardrails via Learning from Synthetic Data
449

Figure 6: Histogram of the decision tree leaf node sizes. The size of these sets indicates the granularity of the classification.
Approximately 25% of all guardrail systems can be unambiguously classified using vision-based measurements.
depth data. Metric distances between upper (beam)
and lower (pole) extremities of the guardrail are de-
termined. Again, a time-aggregated histogram of per-
frame estimates generates a more robust result.
The temporal aggregation and mode seek-
ing/tracking scheme yields a reliable mean to cope
with spurious and noisy segmentation results. If no
guardrail in the image is detected, the histogram en-
tries are slowly decreased, and if a guardrail struc-
ture reappears, the histogram distribution is updated
again. In this way, a transition between two differ-
ent guardrail types in the surveyed environment is re-
flected by an altering mode locations in the respective
metric distance maps.
Finally, a decision tree is used to perform a
classification based on an attribute-set, tabulated for
different countries by road management authorities.
For Germany and Austria a library of 176 and 155
guardrail types has been established respectively,
each represented by a rich set of attributes. Certain at-
tributes cannot be directly measured by a vision-based
survey, such as the bolt shape or material thickness.
Therefore, we selected a reduced set of measurable at-
tributes, which can yield a type classification: {wave
number, wave profile, wave height, guardrail height,
pole spacing, bolt number, bolt configuration, ground
plate, underride protection bar}. Based on these at-
tributes, a decision tree has been constructed by or-
dering discriminative attributes in descending order
according to their entropy. The terminal nodes of the
decision tree define one or more guardrail types which
match a given sequence of attribute queries. In Figure
6 the distribution of leaf node sizes is displayed as a
histogram, illustrating how well individual guardrail
types can be discriminated given the set of vision-
based attribute measurements. As it can be seen from
the plot, there are certain few guardrail types which
are mutually similar, and vision-based measurements
cannot yield an unambiguous classification result. In
such cases, multiple options for guardrail types are
returned. On the other hand, about 24% of guardrail
types can be unambiguously recognized. In 37% of
the guardrail cases classification yields one or two
candidates, while in 63% of the cases more than two
type hypotheses are generated. Since no knowledge
on the occurrence frequency of the different guardrail
types is available, no posterior estimates on the recog-
nition probability for an arbitrary guardrail observa-
tion could be calculated.
5 RESULTS AND DISCUSSION
Data Recording: Using our mobile survey vehicle
(Figure 3), we recorded RGB and stereo depth data
in 4 sessions each covering 25 km of length on public
roads in Germany and Austria, with a high frequency
of surrounding guardrail structures. The recording
settings were set at 1080p resolution at 15 f ps, us-
ing the proprietary svo file format (Stereolabs, 2022).
All survey trips were conducted at daylight conditions
with survey speeds ranging between 30-60 km/h.
Data recording was time-stamped and assigned to a
GPS-based geo-location.
5.1 Semantic Part Segmentation
We present qualitative and quantitive results for the
semantic segmentation task, which is the primary
analysis modality towards deriving a guardrail type
estimate. Sample qualitative segmentation results are
shown for three input images in Figure 7 using the
ICNet (Zhao et al., 2018) and Swin Transformer (Liu
et al., 2021) methods. Both methods were trained us-
ing an identical and fully synthetic dataset containing
100K RGB images and matching segmentation maps.
As it can be seen from Figure 7, the synthetic data
achives good generalization for all of these scenar-
ios. Both ICNet and Swin Transformer capture the
most relevant structure parts, but the latter consis-
ROBOVIS 2022 - Workshop on Robotics, Computer Vision and Intelligent Systems
450
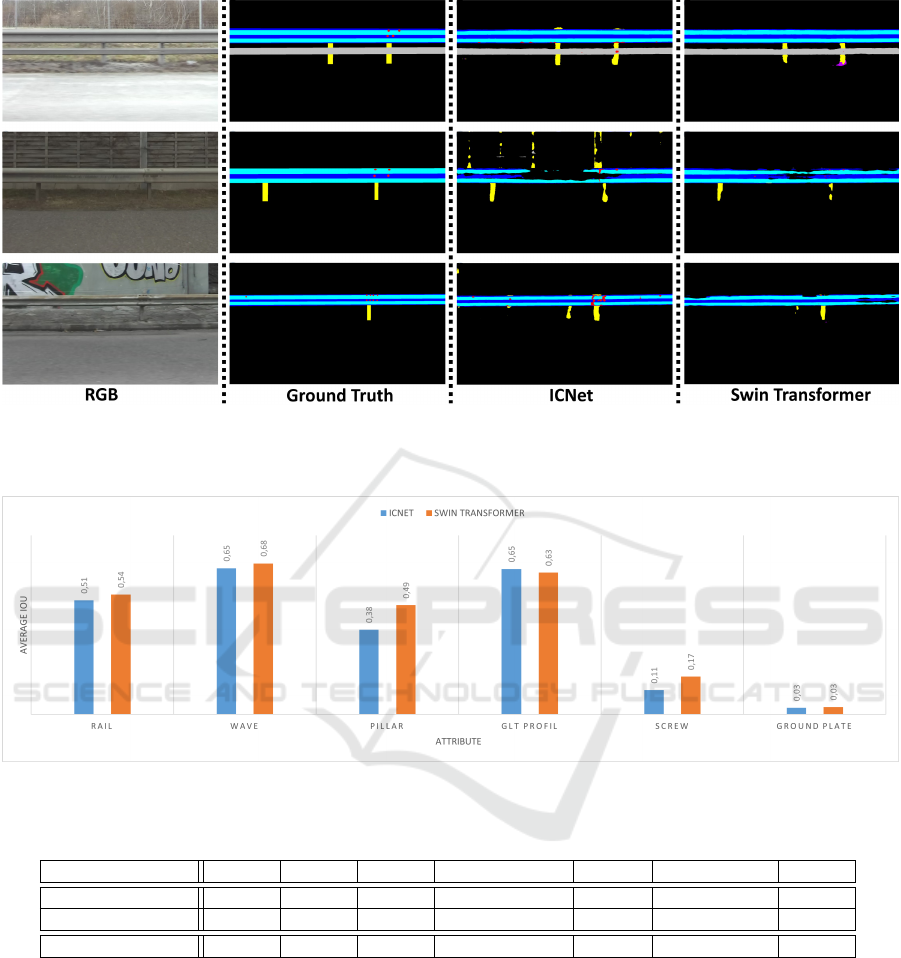
Figure 7: From left to right: captured RGB image, annotated ground truth, ICNet segmentation result, Swin Transformer
segmentation result. The colors are encoded as follows: concave part of the rail = blue, convex part of the rail = turquoise,
bolt = red, pole = yellow, underride protection bar = grey, ground plate = magenta.
Figure 8: The average IoU values when segmenting the individual classes. Swin Transformer performs most of the time
significantly better than ICNet.
Table 1: The average IoU values for the above plot. The average IoU over all classes is given in the last column.
Average IoU Rail Wave Pillar Add. S. Profile Screws Ground Plate Total
ICNet 0,5103 0,6534 0,3784 0,6500 0,1077 0,0294 0,5043
SwinTransformer 0,5360 0,6755 0,4882 0,6342 0,1681 0,0331 0,5432
Difference 0,0257 0,0221 0,1098 0,0158 0,0604 0,0037 0,0389
tently achieves both a higher recall (less missing seg-
ments) and higher precision (less misclassified noise
patterns in the background). Although during training
time both methods relied on the same data, the Swin
Transformer better suppresses spurious grid-like pat-
terns in the background. Both methods exhibit a dif-
ficulty in correctly segmenting bolts and their spatial
arrangement. This effect can be due to the fact that
motion blur especially affect small-sized guardrail
features and renders the structure boundaries with re-
spect to the underlying beam hardly distinguishable.
To perform a quantitative comparison, we employ
a pixelwise Intersection-Over-Union (IoU) metric. As
our task involves multi-class segmentation of struc-
tural features with substantially sizes, we compute av-
erage IoU for each class and over all text images. We
set up a manually fine-annotated ground truth dataset
containing 60 images, sampled across different con-
ditions during the survey data. The per-class average
IoU values are shown in Figure 8 as a bar plot. The
corresponding IoU values are shown in a tabulated
form in Table 1. As it can be seen from the plot and
the table, Swin Transformer achieves mostly superior
segmentation accuracies when compared to ICNet. In
RGB-D Structural Classification of Guardrails via Learning from Synthetic Data
451

Figure 9: Per-image IoU measures for ICNet and Swin Transformer segmentation results computed for the pole class and
shown for each test image. The test data set contains 60 samples. The average IoU’s obtained for ICNet and Swin Transformer
are 0.38 and 0.49, respectively (dashed lines). Swin Transformer performs better in 83% of the samples.
general, however, thin (poles) or small (bolts, ground
plates) structural elements are difficult to segment re-
liably. However, as the large-area structure (beam
wave) and its profile can be accurately segmented
most of the time, the subsequent location and size es-
timation process of less reliably segmented parts can
be well robustified by relative spatial cues (w.r.t to
the beam as reference) and by finding their regularity
from temporal aggregation. This process well elimi-
nates spurious background segmentation results.
Since the largest quality difference between the
two segmentation methods emerges for thin or small-
sized structures, we perform an experiment to exam-
ine IoU quantities for the thin pole class. For each
of the test images we compute the pole segmentation
IoU’s, which are shown in Figure 9. As it can be
seen from the plot, in more than 80% of the cases
the Swin Transformer produces significantly better
results. Especially in presence of spurious back-
ground (man-made texture, concrete wall), its seg-
mentation results are much better. On the other hand,
in few images with low-light conditions (overcast and
rainy weather) the ICNet segmentation performs bet-
ter, which can be seen at the leftmost side of the plot.
5.2 Guardrail Classification
Results in the acquired large-scale test survey dataset
indicate that the segmentation model trained on the
fully synthetic data generates valid and sufficiently
accurate results under a diverse set of illumination (all
daylight variations) and viewing (distance and orien-
tation) conditions. The use of metric depth data helps
to achieve a good scale invariance, as all observed se-
mantic and depth features, such as beam profiles, can
be normalized and analyzed at a unit scale.
Our test evaluations show that the guardrail type-
diversity in the recorded data is much lower than for
those listed in our structure catalog. In addition, the
most difficult estimation task in our system is the
guardrail height estimation task, as the surrounding
environment often contains high grass and clutter,
making it difficult to estimate the exact ground plane
level. Current height estimation errors are around
±10 cm. However, a height difference of about 5 cm
is a discriminating factor for several guardrail types.
Therefore, in our current systemic solution we are
able to limit our classification output to about 2 type
hypotheses for 20%, 3-5 for 40% and 6-10 for 40% of
the observed guardrail structures. It implies that in the
final classification results still there is some ambigu-
ity, however, manual selection and fine classification
from this constrained set of candidates becomes rela-
tively straightforward.
6 CONCLUSIONS
In this paper we presented novel algorithmic concepts
of a mobile robotic survey system determining the
guardrail type in roadside environments, posed as a
classification problem. A key asset in the presented
concept is represented by a synthetic RGB image gen-
eration pipeline, which allows for training two com-
plex semantic segmentation models, which are de-
ployable in the real image domain. Results indicate
that Transformer-based representations can better en-
force recurring structural constraints learned from the
training data, yielding segmentation results with less
noisy and more complete segments. Furthermore, we
present a depth-based and temporal reasoning scheme
to scale-normalize and discover repetitive structural
elements from time-aggregated data, without the need
of explicit structure-based visual tracking. Future
work will focus on large-scale evaluation of the pro-
posed concept and a tighter integration of data with
GIS-based road management systems.
ROBOVIS 2022 - Workshop on Robotics, Computer Vision and Intelligent Systems
452

ACKNOWLEDGEMENTS
This work was carried out within the AENEAS
project, which is funded by the Austrian Min-
istry for Climate Action, Environment, Energy, In-
novation and Technology (BMK) under the pro-
gram “Eurostars-2/Road Transport Technology” and
is managed by the Austrian Research Promotion
Agency (FFG). We acknowledge the support and con-
tributions by the entire AENEAS consortium, consist-
ing of DTV-Verkehrsconsult GmbH (Germany) as co-
ordinator, 4D-IT GmbH (Austria) and the AIT.
REFERENCES
Balali, V. and Golparvar-Fard, M. (2015). Segmentation
and recognition of roadway assets from car-mounted
camera video streams using a scalable non-parametric
image parsing method. Automation in Construction,
49:27–39.
Blender-Foundation (2022). Blender - a 3D modelling and
rendering package. Blender Foundation, Stichting
Blender Foundation, Amsterdam.
Chen, M. (2021). Vectorized dataset of roadside noise bar-
riers in china. National Tibetan Plateau Data Center.
Comaniciu, D. and Meer, P. (2002). Mean shift: A robust
approach toward feature space analysis. IEEE Trans.
Pattern Anal. Mach. Intell., 24(5):603–619.
Fang, L., Yang, B., Chen, C., and Fu, H. (2015). Extraction
3d road boundaries from mobile laser scanning point
clouds. In 2nd IEEE International Conference on Spa-
tial Data Mining and Geographical Knowledge Ser-
vices, ICSDM 2015, Fuzhou, China, July 8-10, 2015,
pages 162–165.
Georgakis, G., Mousavian, A., Berg, A. C., and Kosecka, J.
(2017). Synthesizing training data for object detection
in indoor scenes. CoRR, abs/1702.07836.
Golovinskiy, A., Kim, V. G., and Funkhouser, T. (2009).
Shape-based recognition of 3D point clouds in urban
environments. International Conference on Computer
Vision (ICCV).
Golparvar-Fard, M., Balali, V., and de la Garza, J. M.
(2015). Segmentation and recognition of highway as-
sets using image-based 3d point clouds and semantic
texton forests. Journal of Computing in Civil Engi-
neering, 29(1):04014023.
Hinterstoisser, S., Pauly, O., Heibel, H., Marek, M., and
Bokeloh, M. (2019). An annotation saved is an an-
notation earned: Using fully synthetic training for ob-
ject detection. In 2019 IEEE/CVF International Con-
ference on Computer Vision Workshops, ICCV Work-
shops 2019, Seoul, Korea (South), October 27-28,
2019, pages 2787–2796. IEEE.
Li, Y., Wang, W., Li, X., Xie, L., Wang, Y., Guo, R., Xiu,
W., and Tang, S. (2019). Pole-like street furniture seg-
mentation and classification in mobile lidar data by
integrating multiple shape-descriptor constraints. Re-
mote Sensing, 11(24).
Liu, Z., Lin, Y., Cao, Y., Hu, H., Wei, Y., Zhang, Z., Lin,
S., and Guo, B. (2021). Swin transformer: Hierarchi-
cal vision transformer using shifted windows. In Pro-
ceedings of the IEEE/CVF International Conference
on Computer Vision (ICCV).
Makoviychuk, V., Wawrzyniak, L., Guo, Y., Lu, M.,
Storey, K., Macklin, M., Hoeller, D., Rudin, N., All-
shire, A., Handa, A., and State, G. (2021). Isaac
Gym: High Performance GPU-Based Physics Sim-
ulation For Robot Learning. arXiv e-prints, page
arXiv:2108.10470.
Neuhold, G., Ollmann, T., Rota Bulo, S., and Kontschieder,
P. (2017). The mapillary vistas dataset for semantic
understanding of street scenes. In Proceedings of the
IEEE International Conference on Computer Vision
(ICCV).
NVidia (2022). Omniverse. https://developer.nvidia.com/
nvidia-omniverse/. [Online; accessed 26-July-2022].
Rezapour, M. and Ksaibati, K. (2021). Convolutional neu-
ral network for roadside barriers detection: Trans-
fer learning versus non-transfer learning. Signals,
2(1):72–86.
Sainju, A. M. and Jiang, Z. (2020). Mapping road safety
features from streetview imagery: A deep learning ap-
proach. Trans. Data Sci., 1(3):15:1–15:20.
Shotton, J., Johnson, M., and Cipolla, R. (2008). Semantic
texton forests for image categorization and segmenta-
tion. In 2008 IEEE Conference on Computer Vision
and Pattern Recognition, pages 1–8.
Smith, V., Malik, J., and Culler, D. (2013). Classification of
sidewalks in street view images. In 2013 International
Green Computing Conference Proceedings, pages 1–
6.
Stereolabs (last accessed July 28, 2022)). Stereolabs. https:
//www.stereolabs.com/zed-2/.
Tremblay, J., Prakash, A., Acuna, D., Brophy, M., Jam-
pani, V., Anil, C., To, T., Cameracci, E., Boochoon,
S., and Birchfield, S. (2018). Training deep networks
with synthetic data: Bridging the reality gap by do-
main randomization. In 2018 IEEE Conference on
Computer Vision and Pattern Recognition Workshops,
CVPR Workshops 2018, Salt Lake City, UT, USA, June
18-22, 2018, pages 969–977. Computer Vision Foun-
dation / IEEE Computer Society.
Verma, B. K., Zhang, L., and Stockwell, D. R. B. (2017).
Roadside Video Data Analysis: Deep Learning - Deep
Learning, volume 711 of Studies in Computational In-
telligence. Springer.
Xu, H. and Zhang, J. (2020). Aanet: Adaptive aggregation
network for efficient stereo matching. In Proceedings
of the IEEE/CVF Conference on Computer Vision and
Pattern Recognition, pages 1959–1968.
Zhao, H., Qi, X., Shen, X., Shi, J., and Jia, J. (2018).
ICNet for real-time semantic segmentation on high-
resolution images. In ECCV.
Zhao, Y., Gong, S., Gao, X., Ai, W., and Zhu, S.
(2022). Vrkitchen2.0-indoorkit: A tutorial for aug-
mented indoor scene building in omniverse. CoRR,
abs/2206.11887.
RGB-D Structural Classification of Guardrails via Learning from Synthetic Data
453
