The Influence of E-Service Quality and Perceived Ease of Use on
Customer Satisfaction of DANA in Medan
Nabawi Putri Marisa Nasution
Master Program of Management Science, Postgraduate School, Universitas Sumatera Utara,
Jl. Prof. TM Hanafiah Kampus USU, Medan, Indonesia
Keywords: E-Service Quality, Perceived Ease of Use, Customer Satisfaction.
Abstract: The purpose of this study was to determine how the effect of e-service quality and perceived ease of use on
customer satisfaction for DANA users in Medan. The type of research used is quantitative research with a
sampling technique that is non-probability sampling, with a total of 140 respondents. The data collection
method in this study is a survey method using a questionnaire distributed to respondents online via google
form. The data analysis technique in this study uses multiple linear regression analysis which is processed
using SPSS 26. The results of this study indicate that the e-service quality variable has a positive and
significant effect on customer satisfaction, the perceived ease of use variable also has a positive and significant
effect on customer satisfaction. Simultaneously, e-service quality and perceived ease of use have a positive
and significant effect on customer satisfaction with DANA users in Medan.
1 INTRODUCTION
Current technological developments aim to facilitate
human life in daily activities so that it can be done
anywhere and anytime, one of which is in terms of
transactions. The rapid use of smart phones among
the public has encouraged companies to launch
electronic money in the form of mobile phone
applications, so that companies providing financial
services provide digital wallets.
The emergence of e-money and digital wallets is
the answer to the need for payments that can be
processed quickly because in general money stored in
digital wallets can be accessed quickly, safely, and
cheaply. According to a survey by the Indonesian
Internet Service Providers Association (APJII, 2020)
the use of electronic money transactions in Indonesia
has experienced very rapid growth, amounting to
196.7 million people. The use of non-cash payments
has been supported by Bank Indonesia by launching
the National Non-Cash Movement (GNNT) on
August 14, 2014.
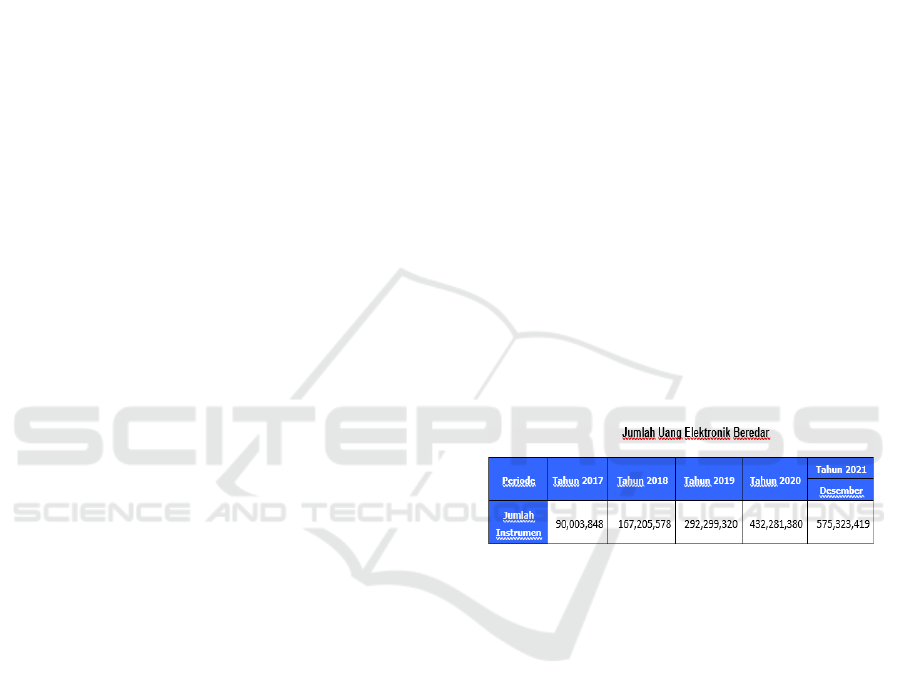
Figure 1: Amount of Electronic Money in circulation in
2017-2021.
On the BI website above, it can be seen that the
number of electronic money transactions has
increased significantly every year. In 2020, electronic
money in circulation increased drastically, from a
total nominal value of 292 trillion in 2019 to 432
trillion and increased again in 2021 to 575 trillion.
This shows that the use of electronic money in
Indonesia continues to grow.
In Indonesia, there are already many companies
engaged in electronic money services, users are
presented with various choices and benefits provided.
One of them is DANA, which is an electronic wallet
(e-wallet) service that acts as a means of payment.
Nasution, N.
The Influence of E-Service Quality and Perceived Ease of Use on Customer Satisfaction of DANA in Medan.
DOI: 10.5220/0011566300003460
In Proceedings of the 4th International Conference on Social and Political Development (ICOSOP 2022) - Human Security and Agile Government, pages 287-293
ISBN: 978-989-758-618-7; ISSN: 2975-8300
Copyright
c
2023 by SCITEPRESS – Science and Technology Publications, Lda. Under CC license (CC BY-NC-ND 4.0)
287
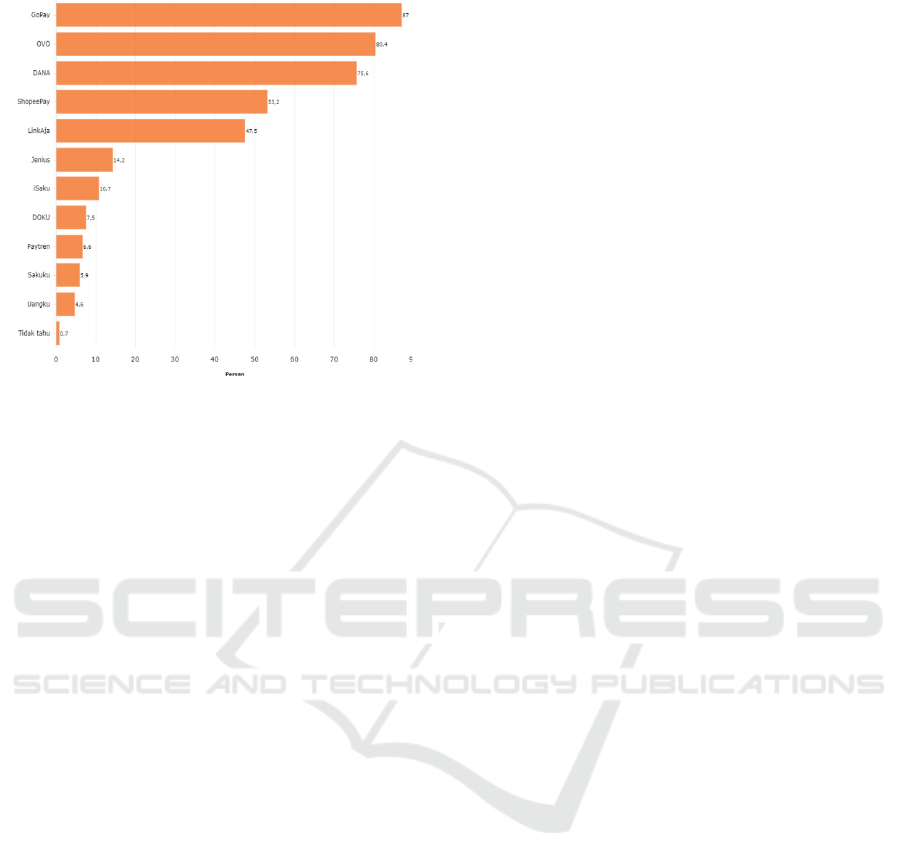
Figure 2: Digital Wallet Users in Indonesia in 2021.
Based on databoks.katadata.co.id in 2021 above,
the first rank of the most popular electronic money
service is occupied by Go-Pay with 87% of users,
then in the second place there is OVO with 80.4%
users while DANA is ranked second. the third is
75.6% of users. In contrast to GO-Pay which is an
integration of the GO-Jek application, DANA is a
stand-alone application organized byPT Espay Debit
Indonesia Koe.Although DANA has started to
become one of the e-payment applications that
dominates the current market, DANA must continue
to pay attention and improve the quality of its services
to maintain its existence in the midst of today's
intense competition for e-wallet services.
The quality of electronic services is different from
the quality of conventional services. This is because
there is a need for considerations related to the
technological aspects used in service quality on e-
wallet. Parasuraman et al (2005) define e-service
quality as the extent to which a website facilitates
efficient and effective shopping, purchasing, and
delivery.
DANA is inseparable from several complaints felt
by its users, both complaints about transactions that
have not been successful, problems in replenishing
balances, problems with decreasing balances but not
arriving at the destination account to customer care
that takes a long time in responding and handling user
complaints and unilateral account freezing by FUND.
DANA needs to address any user complaints in order
to create satisfaction so that users continue to use their
services.
Competition in digital wallets is not only the
quality of service but also the ease of use of the digital
wallet itself. DANA application users have difficulty
accessing the application (error) when they want to
use the e-wallet, transfers using a QR code experience
delays and users find it difficult to upgrade to
premium DANA.
In the Technology Acceptance Model (TAM)
theory, the effectiveness of electronic money can be
seen from the level of attitude of its users. According
to Davis (1989) one of the factors that can influence
interest in using technology is the user's perception of
a technology that is easy to understand and use
(perceived ease of use). Wibowo (2006) states that the
perception of the ease of use of a technology is
defined as a measure by which a person believes that
the technology can be easily understood and used.
This is very helpful for increasing the use of payment
applications which are often considered difficult even
though there are many enthusiasts.
By providing quality e-service and perceived ease
of use. A good service will have an impact on
satisfaction, because service quality has an important
role to measure customer satisfaction with the
services provided by the company.
By providing quality e-service and perceived
ease of use good will have an impact on satisfaction.
According to Tiwari (2017) customer satisfaction is a
very important parameter to maintain in terms of
online services, because it is very difficult to manage
and retain loyal customers with the services provided.
2 LITERATURE REVIEW
2.1 E-Service Quality
Basically, e-service quality is a development of
service quality theory which is carried out to evaluate
a service provided on the internet network. According
to Zeithaml, et al. (2002), e-service quality is
considered as the extent to which a website (website)
facilitates the shopping, purchasing, and delivery of
goods and services effectively and efficiently.
According to Santos (2003) e-service quality as a
comprehensive evaluation and assessment of
customers regarding an advantage and quality
delivered via the internet. In the field of marketing,
the topic that is most often studied is e-service
quality, this is due to the close relationship that occurs
between costs, satisfaction, retention and loyalty
(Gounaris et al., 2010).
According to Parasuraman (2005) e-service
quality has 7 dimensions, namely:
1. Efficiency, ease of use and speed in accessing the
site so that customers can find the desired product.
ICOSOP 2022 - International Conference on Social and Political Development 4
288

2. Fulfillment, guarantee the fulfillment of the
promised service.
3. System availability, technical functions that are
implemented in providing services that can
function properly.
4. Privacy, maintaining the confidentiality of
consumer data related to personal information,
such as identity and purchase or payment
transactions.
5. Responsiveness, the ability to quickly handle a
problem that customers complain about.
6. Compensation, a liability if a problem occurs
which includes refunds that do not reach their
destination.
7. Contact, the availability of online customer
service information includes: telephone number
and email.
In the research of Puriwat & Tripopsakul (2017),
it is stated that e-service quality has a significant
influence on consumer satisfaction using mobile
banking applications. By providing maximum e-
service quality from the company, it will create a
feeling of customer satisfaction and lead to a desire to
continue the relationship as loyal customers make
purchases and use products or services repeatedly
even though there are many alternative choices. So
customer satisfaction describes how the quality of e-
service quality is acceptable and provides benefits to
users.
2.2 Perceived Ease of Use
The Technology Acceptance Model (TAM) was first
introduced by Davis (1989) which is a theory that
explains the perception of technology users. TAM is
commonly used to understand the relationship
between humans and technology acceptance through
perceived usefulness and perceived ease of use.
Perceived ease of use is defined as the extent to which
a person believes that using a particular system will
be free from effort (Davis, 1989). Individuals who
believe that the system is easy to use, the individual
will use it, and vice versa if the individual believes
that the system is not easy to use, the individual will
not use it (Jogiyanto, 2007). In addition, the system
that is used more often indicates that the system is
easier to understand, easier to operate and easier to
use.
The aspects used for perceived ease of use (in
Chawla & Joshi, 2019) are as follows:
1. Easy to learn, namely a technology that is easy
to learn is a sign that the technology is easy to use.
2. Easy to understand, namely a technology that
is easy to understand then the technology is
considered easy to use,
3. Effortless, ie a technology can be done in a
succinct manner, then the technology is considered
easy to use.
4. Easy to use, i.e. if a technology is easy to use,
then individuals will feel increased trust in the
technology.
Har and Eze (2011) in their research give the
result that the perception of convenience has a
positive effect on repurchase intention. These results
indicate that the better the perception of convenience,
the more positive the repurchase interest will be.
Technology that is easy to use (perceived ease of use)
affects customer satisfaction because with the ease
with which users feel, there will be a sense of
satisfaction after using it..
2.3 Customer Satisfaction
According to Kotler & Keller (2016) consumer
satisfaction is the level of one's feelings, both satisfied
and disappointed with the performance of a product
or service compared to customer expectations. In
terms of mobile commerce, customer satisfaction is
the post- purchase evaluation of customers and
affective responses or feelings for the overall product
or service experience in a mobile commerce
environment (Lin & Wang, 2006). Customer
satisfaction or dissatisfaction as a response to the
evaluation of the perceived discrepancy between
initial expectations before purchase and the actual
performance of the product perceived after use (Tse
and Wilton, 1988).
Customer satisfaction is obtained when the
performance of the product or service received is in
accordance with customer expectations. If the
perceived benefits are not in line with expectations,
the customer will be dissatisfied. If the benefits
obtained match or even exceed expectations, the
customer will be very satisfied and happy. Very
dissatisfied customers can turn into “terrorists” for
service providers by spreading negative word of
mouth in abundance (Lovelock & Wirtz, 2018).
According to Kotler's theory (in Suwardi, 2011),
the key to retaining customers is customer
satisfaction. Indicators of consumer satisfaction can
be seen from: (1) Re-purchase, buying back
goods/services to the company. (2) Creating Word-
of-Mouth, customers will say good things about the
company to others. (3) Creating a brand image,
customers will pay less attention to competing
products. (4) Creating purchasing decisions on the
The Influence of E-Service Quality and Perceived Ease of Use on Customer Satisfaction of DANA in Medan
289
same company, buying other products from the same
company.
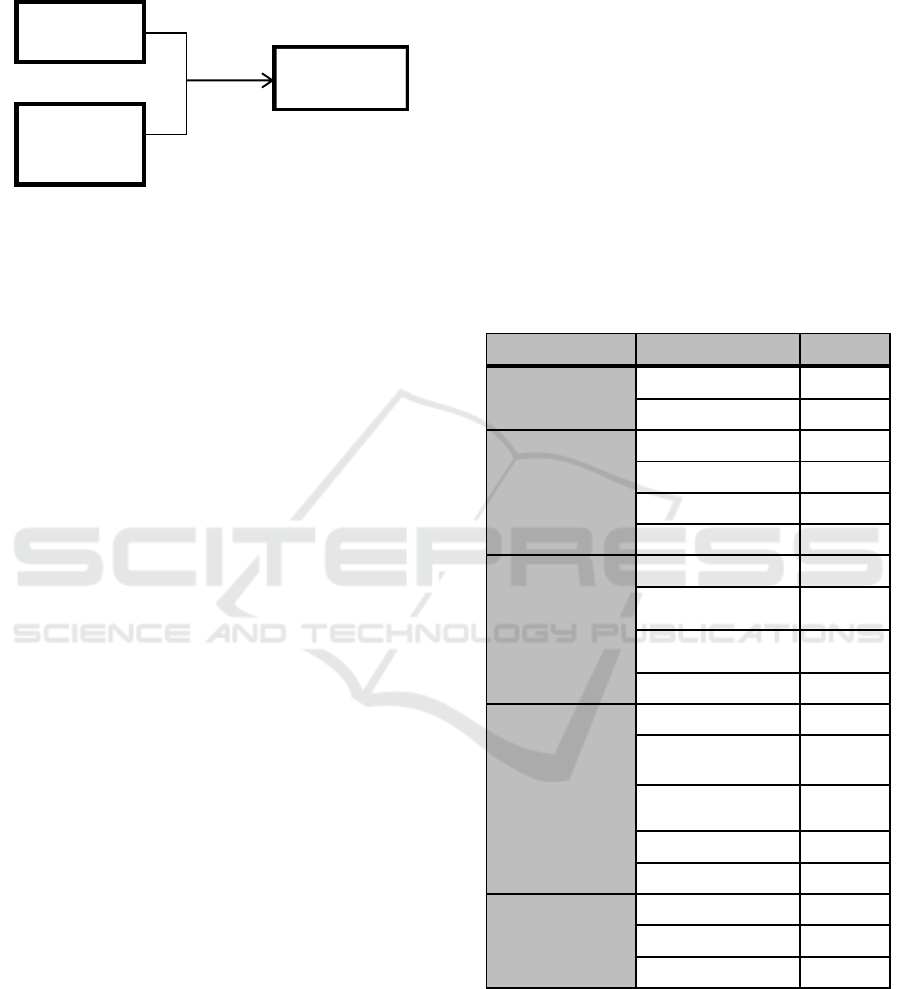
E-Service
Quality
Perceived
Ease of
Use
Figure 3: Conceptual Framework.
2.4 Research Hypothesis
H1: E-Service Quality and Perceived Ease of
Usehave a positive and significant effect on
Customer Satisfactionof DANA in Medan
H2: E-Service Qualityhas a positive and significant
effect onCustomer Satisfactionof DANA in
Medan
H3: Perceived Ease of Usehas a positive and
significant effect onCustomer Satisfactionof
DANA in Medan
3 RESEARCH METHODS
This research uses quantitative methods. The
population in this study were users of the DANA
application in Medan whose number was unknown,
so that the determination of the number of samples
was carried out with a minimum sample size of five
times the number of questionnaire statement items
(Hair et al., 2006). The sampling technique used
purposive sampling method, then the sample of this
study was taken bysome criteriawith the number of
respondents as much as 140 respondents.
The data collection method uses a survey method
with questionnaires distributed to respondents online
through the help of google form.The data analysis
technique in this study used multiple linear regression
analysis which was processed using SPSS 26.
4 RESULTS AND DISCUSSION
4.1 Characteristics of Respondents
Based on the respondent's data that has been collected
from distributing questionnaires, the following is the
data generated from the research on each numerical
value that has been used including: Gender, Age,
Income, Occupation, and Transactions for 3 months.
Respondents' descriptive data are as follows.
Based on Table 1 regarding the characteristics of
the respondents below, it can be seen that DANA
users are dominated by female respondents with a
total of 92 people and 48 male respondents. In this
study, the most dominant users occurred at the age of
26-35 years as many as 89 people and over the age of
46 years only as many as 6 people. Users with an
income of IDR 1,000,000 – IDR 5,000,000 are the
most dominant respondents with 88 people and
income above 10,000,000 only 6 respondents. DANA
users are also dominated by private employees with
66 respondents and only 9 respondents with
Entrepreneurial jobs.
Table 1: Characteristics of Respondents.
Characteristics Information Amount
Gender
Woman
92
Man 48
Age
16 – 25 years 33
26 – 35 years old 89
36 – 45 years 12
> 46
6
Income
< 1,000,000 18
1,000,001 -
5,000,000
88
5,000,001 -
10,000,001
28
> 10,000,000
6
Profession
Student/Student 28
Government
Employes
7
Private
employees
66
Entrepreneur
9
Other 30
Transactions
for the last 3
months
< 5 times 16
5 - 10 times 80
> 10 times 44
4.2 Multiple Linear Regression
Analysis
Multiple linear regression analysis was conducted to
analyze the effect of e-service quality and perceived
ease of use on customer satisfaction in the DANA
application in the city of Medan.
Customer
Satisfaction
ICOSOP 2022 - International Conference on Social and Political Development 4
290

Based on Table 3 below, it can be seen that the
regression equation is as follows:
Y = 0.225 + 0.277 X1 + 0.453 X2.
Table 2: Multiple Linear Regression Analysis.
B
Sig.
Constant 0.225 0.921
E_Sequal 0.277 0.000
PEU 0.453 0.000
a. = constant value of 0.225 which means that if
the independent variables of e-service quality (X1)
and perceived ease of use (X2) are constant (zero or
no effect), then the dependent variable of customer
satisfaction
(Y) is 0.225. This means that if e-service quality
(X1) and perceived ease of use (X2) have no effect,
then the customer satisfaction variable (Y) will still
exist because of the influence of other factors.
b1 = 0.277, the regression coefficient of e- service
quality (X1) is 0.277, which means that if the e-
service quality variable (X1) is increased, customer
satisfaction will also increase by 0.277.
b2 = 0.453, the regression coefficient of perceived
ease of use (X2) is 0.453, which means that if the
perceived ease of use (X2) variable is increased,
customer satisfaction will also increase by 0.453.
Table 3: R Square.
R
S
q
uare
Adjusted R
S
q
uare
0.542 0.536
Based on Table 2 above, it is known that R Square
is 0.542. This shows that the independent variables in
the model (e-service quality and perceived ease of
use) explain the variation in customer satisfaction by
54.2% and 45.8% is explained by other factors or
variables outside the model.
Table 4: F test (simultaneous test).
df
f
Sig.
Regression
2
81.128 0.00
0
Residual 137
Total 139
Based on Table 4 above, it is known that the
significance value is 0.000 <0.05. The calculated F
value > F table, which is 81.128 > 3.06. Therefore, it
can be interpreted that the variables of e-service
quality (X1) and perceived ease of use (X2)
simultaneously have a significant effect on customer
satisfaction DANA (Y) which means H1 in this study
is accepted.
Table 5: t test (partial test).
t
Sig.
E_Sequal
5.230
0.000
PEU
5.880
0.000
Based on the t-test in the table above, it is known
that the value of Sig. of e-service quality (X1) is 0.000
<0.05 and the value of t count is 5.230 > t table is
1.655. These results indicate that there is a positive
and significant effect of e- service quality on
customer satisfaction. So it can be concluded that H2
is accepted because there is an influence of the e-
service quality variable (X1) on the customer
satisfaction variable (Y).
In the perceived ease of use (X2), it can be seen
that the value of Sig. 0.000 < 0.05 and the value of t
count is 5.880 > t table 1.655.These results indicate
that there is a positive and significant effect of
perceived ease of use on customer satisfaction. So it
can be concluded that H3 is accepted because there is
an influence of the perceived ease of use (X2)
variable on the customer satisfaction variable (Y).
4.3 Effect of E-Service Quality on
Customer Satisfaction
The results of the multiple linear regression analysis
in this study found thate-service quality has a positive
and significant effect on customer satisfaction
variables. The results of this study are in line with
Putri & Novi (2021) which show that there is a
positive and significant effect of e- service quality on
consumer satisfaction, that the better the e-service
quality on ShopeePay, the higher consumer
satisfaction will be. Fitriana et al (2020) also show
that e-service quality has a positive and significant
effect on e-satisfaction. This explains that online
transactions in the DANA application are more
practical because they can be done anywhere and
anytime.
DANA as a digital wallet service has been able to
facilitate user needs such as making it easier to
change payment methods using cash to using e-
money. The quality of service in efficiency and
fulfillment shows that the DANA application is easy
to use, both for payments, transfers and storing funds
even during account activation. In addition, there are
various kinds of services provided by DANA, such
The Influence of E-Service Quality and Perceived Ease of Use on Customer Satisfaction of DANA in Medan
291

as: free admin fees when transferring to a bank
account, 24-hour system availability, and customer
care that can be contacted via numbers, e-mail and
even WhatsApp, making users satisfied with the
number of contacts that can be reached. contacted if
there is a complaint.
Words like “is”, “or”, “then”, etc. should not be
capitalized unless they are the first word of the
subtitle
4.4 The Effect of Perceived Ease of Use
on Customer Satisfaction
Furthermore, the results of this study indicate that
there is a positive and significant effect of perceived
ease of use on customer satisfaction. This is in line
with the research of Wiwoho (2018) which says that
perceived ease of use has a significant effect on
customer satisfaction. Users feel that it is easy to pay
with OVO on Grab, which can increase user
satisfaction. Anugrah (2020) also shows the results of
the same study that ease of use has a significant
influence on customer satisfaction.
The ease of using the DANA application in
transactions creates a sense of satisfaction from its
users. DANA has also begun to be used as payment
at food outlets and clothing stores using a QR code.
By only using a QR code, payments can be made
quickly and safely. The steps and instructions for
transferring or making payments that are presented
are quite easy to do, making customers feel that there
is no need for excessive effort when using the DANA
application. In addition, although DANA has many
features in its application, users do not find it difficult
to use these features. So it can be said that the
perceived ease makes DANA users feel satisfied.
5 CONCLUSIONS
From the results of the analysis of the discussion
above, regarding the effect of e-service quality and
perceived ease of use on DANA customer
satisfaction, the following conclusions can be drawn:
1. E-service quality has a positive and significant
influence on customer satisfaction DANA
customer satisfaction.
2. Perceived ease of use has a positive and
significant influence on customer satisfaction and
customer satisfaction DANA.
3. E-service quality and perceived ease of use have
a positive and significant effect simultaneously on
DANA's customer satisfaction.
In service quality, speed in responding and
handling customer complaints is the main thing
because customers feel cared for by their problems.
Then in the use of the e-wallet application,
convenience is a very important factor and is needed
to increase DANA customer satisfaction so that they
continue to transact using the application.
REFERENCES
Akhmadi, D., D., & Martini, E. (2020). The Effect of E-
Service Quality on Ovo Application Customer
Satisfaction and Loyalty. Journal of Management
Partners Vol. 4 No.5, 708- 720.
Anugrah, TF (2020). Effect of Promotion and Ease of Use
on Customer Satisfaction and Loyalty on OVO
Application Users. Quantitative Economics and
Management Studies (QEMS) Vol. 1 No. 2.
Charisma, L., & Suprapti, N., W., S.,. (2020). The Effect of
Utilitarian Value and Perceived Ease of Use on
Satisfaction to Increase Purchase Intention. E-Journal
of Management, Vol. 9, No. 6, 2147-2166.
Chawla, D., & Joshi, H. . (2019). Consumer Attitude and
Intention to Adopt Mobile Wallet in India – An
Empirical Study. International Journal of Bank
Marketing, 1590-1618.
Davis, F. (1989). Perceived Usefulness, Perceived Ease Of
Use, And User Acceptance Of Information.
Management Information Systems Research Center
13(3), 319-340.
Fitriana, I., Sugiono A., Adistya, D. (2020). Effect of E-
Service Quality and E-Trust on E- Satisfaction. Journal
of Competitive Business, Vol 1, No 4, 172-178.
Gounaris, S., Dimitriadis, S., & Stathakopoulos, V. (2010).
An Examination of The Effects of Service Quality and
Satisfaction on Customers' Behavioral Intentions in E-
Shopping. Journal of Services Marketing 24(2), 142–
156.
Hair, Jr., JF, Anderson, RE, Tatham, RL, & Black, WC
(2006). Multivariate Data Analysis. 6th Edition. New
Jersey: Prentice-Hall International, Inc.
Indriastuti, M., & Wicaksono, R. (2014). Influencers E-
Money In Banking Sector . South East Asia Journal of
Contemporary Business, Economics and Law.
Jogiyanto. (2007). Behavioral Information System
(Revised Edition). Yogyakarta: Andi.
Kotler, P., & Keller, KL (2016). Marketing Management.
Pearson Education.
Kumala, C., D., Paranata, W., J., and Thio, S. (2020). The
Influence of Perceived Usefulness, Perceived Ease Of
Use, Trust, And Security On Interest in Using GoPay In
Generation X In Surabaya. Journal of Hospitality
Management, Vol. 6, No. 1, 19–29.
Lin, HH, & Wang, YS (2006). An Examination of The
Determinants of Customer Loyalty in Mobile
Commerce Contexts. Information and Management.
Lovelock, CH, & Wirtz, J. . (2018). Essentials of Service
Marketing. New Jersey: Pearson Education.
ICOSOP 2022 - International Conference on Social and Political Development 4
292

Lupiyoadi, R. (2013). Service Marketing Management:
Competency Based (3rd ed.). Jakarta, Indonesia:
Salemba Empat.
Parasuraman, Zeithaml, & Malhotra. (2005). ES- QUAL: A
multiple-item scale for assessing electronics. Journal of
Service Research 7(3), 213–233.
Puriwat, W., and Tripopsakul, S. . (2017). The Impact of E-
Service Quality on Customer Satisfaction and Loyalty
in Mobile Banking Usage: Case Study of Thailand.
Polish Journal of Management Studies, 183-193.
Putri, SF A & Marlena, N. (2021). Effect of E- Service
Quality and E-Trust on Consumer Satisfaction.
Economic Forum, 23(3), 463-474.
Santos, J. (2003). E-Service Quality: A Model of Virtual
Service Quality Dimensions. Managing Service
Quality: An International Journal Vol. 13 No. 3, 233-
246.
Suwardi. (2011). Towards Customer Satisfaction Through
Quality Service Creation. Various Journals of
Humanities Development.
Tiwari P., Tiwari KS and Singh PT (2017). Measuring The
Effect of E-Service Quality In Online Banking. Prestige
International Journal of Management & IT-Sanchayan,
43-52.
Tse, David K. And Peter C Wilton. (1988). Models of
Customer Satisfaction Formation: An Extension.
Journal of Marketing Research Vol. 25, 204-212.
Wibowo, A. (2006). Study of Information System User
Behavior with Technology Acceptance Model (TAM)
Approach. ResearchGate.
Wiwoho, G. (2018). The Effect of Perceived Usefulness
and Perceived Ease Of Use on Customer Satisfaction
and Repurchase Intention of Ovo Application Users.
Journal of Business Focus, Vol.17, No.01, 53-61.
Zeithaml, VA, Parasuraman, A., & Malhotra, A. (2002).
Service Quality Delivery Through Web Sites: A
Critical Review of Extant Knowledge. Journal of The
Academy of Marketing Science, 30(4), 362-375.
The Influence of E-Service Quality and Perceived Ease of Use on Customer Satisfaction of DANA in Medan
293
