
Debunking the Stereotypical Ontology Development Process
Achim Reiz
a
and Kurt Sandkuhl
b
Rostock University, 18051 Rostock, Germany
Keywords: Ontology Metrics, NEOntometrics, Ontology Evolution, Ontology Evaluation, OWL, RDF.
Abstract: Ontologies facilitate meaning between human and computational actors. On the one hand, the underlying
technology can be considered mature. It has a standardized language, established tools for editing and sharing,
and broad adoption in practice and research. On the other hand, we still know little about how these artifacts
evolve over their lifetime, even though knowledge of the development process could influence quality control.
It would enable us to give knowledge engineers better modeling or selection guidelines. This paper examines
the evolution of computational ontologies using ontology metrics. First, we gathered hypotheses on the
ontology development process. We assume that groups of ontologies follow a similar development pattern
and that a stereotypical development process exists. Afterward, these hypotheses are tested against historical
metric data from 7053 versions from 69 dormant ontologies. We will show that ontology development
processes are highly heterogeneous. While the made hypotheses are partly true for a slight majority of
ontologies, concluding the bigger picture of ontology development down to the individual ontologies is mostly
not possible.
1 INTRODUCTION
Change in software over time is inevitable and vital
for successful applications. As customer
requirements and needs change over time, so does the
software. Computational ontologies are no different
in this regard. Noy and Klein identified three main
reasons for ontology evolution: (1) A change in the
domain (in the world the ontology captures), (2) a
change in the conceptualization, implying a changing
view on the modeled domain, and (3) a change in the
explicit specification, thus changes in the underlying
ontology representation (Noy & Klein, 2004).
The changes in the domain or the
conceptualization occur regularly and force the
development and evolution of the corresponding
electronic representations. While the intensity of
changes fluctuates, an ontology shall evolve to at least
some degree. A dormant artifact most likely does not
conform to the evolved requirements and can prevent
progress in the domain (Malone & Stevens, 2013).
Detecting the absence of development activity to
notice dormant ontologies is reasonably simple by
analyzing the publishing dates of new versions. While
a
https://orcid.org/0000-0003-1446-9670
b
https://orcid.org/0000-0002-7431-8412
identifying inactivity already helps, knowing the
lifecycle stages prior to the end of life of an ontology
could aid the knowledge engineers in making better
development decisions and the developers that
implement an ontology in selecting the correct artifact
that fits their needs. Several papers proposed stages
that shall occur in the lifecycle of an ontology,
starting from the early development until the end of
service.
This work tests whether we can identify these
stages using ontology metrics on OWL and RDF
ontologies. We first formulate hypotheses based on
proposed life cycle stages. At the center is the
assumption that ontologies have a stereotypical
development process. The assumptions are then
numerically tested using large quantities of historical
metric data.
The work falls into a broader research project
researching ontology quality based on evolutional
data (Reiz, 2020). Our goal is to understand how
ontologies evolve, to later guide developing and
reusing decisions. Knowing in which phase an
ontology currently is would allow us to recommend
the next developing steps and support the knowledge
82
Reiz, A. and Sandkuhl, K.
Debunking the Stereotypical Ontology Development Process.
DOI: 10.5220/0011573600003335
In Proceedings of the 14th International Joint Conference on Knowledge Discovery, Knowledge Engineering and Knowledge Management (IC3K 2022) - Volume 2: KEOD, pages 82-91
ISBN: 978-989-758-614-9; ISSN: 2184-3228
Copyright
c
2022 by SCITEPRESS – Science and Technology Publications, Lda. All rights reserved

engineer in need of reusing an existing ontology in
neither picking an initial, unstable, or dormant
artifact. It would enable us to compare an ontology
against the stereotypical development process and
base quality control on comparing it to other, highly
similar ontologies. In this regard, this research
examines whether the assumption of a stereotypical
development is supported by empirical evidence.
This paper is structured as follows: The next
section gathers the relevant state of the art in ontology
evolution research. Afterward, we derive hypotheses
for ontology evolution, followed by the presentation
of the dataset and the applied preprocessing. Section
5 then tests the hypotheses, followed by a discussion
and conclusion of the research.
2 RELATED WORK
Ontology evolution is mainly understood as
managing changes throughout the ontology's lifetime.
In this regard, Stojanovic defines ontology evolution
as the "…timely adaptation of an ontology to the
arisen changes and the consistent propagation of
these changes to dependent artifacts" (Stojanovic,
2004). Many papers have considered the
identification changes and their impacts using various
methods and granularity levels. (Zablith et al., 2015)
conducted an extensive literature review on the
various views of ontology evolution and change,
starting with detecting a need for change, followed by
its implementation and assessment.
Our research is less interested in managing the
fine granular modifications that occur regularly while
developing ontologies but in the bigger picture of the
ontology life cycle. We, thus, are especially interested
in papers that research a (stereotypical) ontology
evolution process from the formulation of the first
axioms to reaching the end of the lifespan and
becoming dormant.
(Mihindukulasooriya et al., 2017) examined the
evolution of the vocabularies FOAF, PROV-O,
DBPedia, and Schema.org with a research focus on
the numerical developments of classes and properties
for every published version. Key takeaways are the
increasing size of all the ontologies and the missing
adherence to formal theoretical evolution
frameworks.
(Ashraf et al., 2015) proposed an analysis
framework for measuring ontology usage (Table 1).
His ontology development lifecycle includes the
phases: Engineering, evaluation, population,
evolution, and usage analysis. The stages evaluation,
population, and evolution overlap and allow for
reiteration. This paper primarily uses the
development cycle to motivate their presented usage
analysis.
Table 1: The ontology development cycle according to
(Ashraf et al., 2015).
#Stage Descrip
t
ion
A.1 Engineering Ontology is developed from
scratch according to the
g
iven requirements.
A.2 Evaluation Assessment of how well the
ontolo
gy
fits the purpose.
A.3 Population Population of the ontology.
A.4 Evolution Adoption to changes.
A.5 Usage
Anal
y
sis
Ontology usage analysis.
(Malone & Stevens, 2013) assessed change
activities in bio-ontologies. These change activities
are measured through adding, deleting, or changing
classes. They see the ontology lifecycle as a five-way
step: initial, expanding, refining, optimizing/mature,
and dormant. Based on an analysis of 43 ontologies,
the authors derived recommendations for managing
community-led development efforts.
Table 2: Ontology lifecycle according to (Malone &
Stevens, 2013).
#Sta
g
e Description
B.1 Initial State of flux. Hierarchy is not
yet settled, coverage not yet
sufficient. Many additions,
chan
g
es, and deletions.
B.2 Expanding Expanding of the domain of
interest. Heavy adding of new
classes, fairly high level of
deletions.
B.3 Refining Low levels of addition and
deletion, high level of
chan
g
es.
B.4 Mature Very low or no level of
deletion, some addition or
chan
g
es.
B.5 Dorman
t
Little or no recent activity.
One possible view of computational ontologies is
to regard them as pieces of software. While ontology-
specific lifecycle research is scarce, the field of
software evolution has seen much activity in the past
years. Two papers had an especially significant
impact: (Rajlich & Bennett, 2000) proposed the
staged model for the software lifecycle, which is very
close in its assumption to the one proposed by Malone
and Stevens. It also has five stages with decreasing
Debunking the Stereotypical Ontology Development Process
83

change activity and rising maturity. A stark difference
is the inclusion of a release cycle: New versions of the
same software can trigger a new iteration of the
lifecycle.
Table 3: Staged model for software lifecycle by (Rajlich &
Bennett, 2000).
# Sta
g
e Description
C.1 Initial First functional version.
C.2 Evolution Extend capabilities to meet
users' needs.
C.3 Servicing Simple functional changes
and minor defect repairs.
C.4 Phaseou
t
N
o more servicing, still
g
eneratin
g
revenue.
C.5 Closedown Withdrawing the system from
the market.
Table 4: Lehman's laws of software evolution (newest
version, from (Cook et al., 2006)).
# Stage Description
D.I Continuing change Systems must adapt
continuously to remain
satisfactory.
D.II Increasing
complexity
As systems evolve, the
complexity increases –
unless work is done to
maintain or reduce it.
D.III Self-regulation The software evolution
process is self-regulating
regarding its attributes, with
a distribution that is close to
normal.
D.IV Conversation and
organiz. stability
The average effective
activity rate is invariant
over the lifetime of the
product.
D.V Conservation of
familiarity
During the active life of a
system, the average content
remains invariant.
D.VI Continuing growth The functional content must
continually increase over
the lifetime to maintain user
satisfaction.
D.VII Declining quality Unless rigorously adapted to
changes in the operational
environment, the quality will
appear to be declining.
D.VIII Feedback system Evolution is a multilevel,
multiloop, multiagent
feedback system.
Lehmann probably had the most impact on this
research area by formulating the laws of software
evolution. First published in 1974 and continuously
refined over the past years, it contains today eight
fundamentals on the evolutionary behavior of
software that depend or interact with the real world
(Cook et al., 2006).
The staged model and Lehmann's laws were
developed along with sizeable commercial software
projects. (Herraiz et al., 2013) collected nine studies
regarding the validity of the laws for open source
software and revealed controversy in the research
community. While laws D.I and D.VI were
confirmed, others were mainly invalidated, especially
laws D.II and D.IV. The other laws fall in the middle,
with some rejection and acceptance.
3 HYPOTHESES ON ONTOLOGY
EVOLUTION
The previous section reviewed relevant research for
ontology and software evolution. We gathered four
research endeavors with assumptions on how
software artifacts or ontologies evolve during their
lifetime. As a next step, we now transfer these
lifecycle assumptions to the hypotheses shown in
Table 5 that we will test on our dataset. This step also
includes the connection of hypotheses to ontology
metrics.
The first hypothesis (H1) states that ontologies
grow during their lifetime. They tend to get bigger
and incorporate a more detailed and broader view of
the domain they capture. This relatively simple
statement is measured through the development of the
number of axioms.
Hypothesis two (H2) states that the change
activity decreases, the more mature an ontology gets.
While it is supported by B, C, and also implicitly by
A, it contradicts D.IV. We expect to see this change
in activity in two measurements: At first, we measure
the number of commits overall. Less activity should,
thus, be visible in fewer commits at the end of the
lifecycle. However, we will also consider the size of
new versions, thus, how much change in these
versions occurred. In this case, we measure change
using the percental development of axioms.
The third hypothesis (H3) is not concerned with
the end of life in an ontology but with the beginning.
It states that knowledge engineers first develop the
ontology structure, measured through sub-classes and
properties on classes, and afterward populate the
classes (thus introducing individuals).
KEOD 2022 - 14th International Conference on Knowledge Engineering and Ontology Development
84

Table 5: Hypotheses on ontology evolution.
# Hypothesis Supported
b
y
Measured
By
H1 Ontologies
grow during
their lifetime.
B, C.2,
D.VI
Axioms
H2 The level of
change
decreases over
time,
(A), B.3-
5, C.3-5
Commits,
Axioms
H3 The instances
(or individuals)
are introduced
after the initial
design.
A.3 Subclasses,
Individuals,
Property
Assertions
H4 Ontology
complexity
increases with
risin
g
maturit
y
.
(B.III),
D.II
Complexity
Measures,
Relationship
Diversit
y
H5 A stereotypical
development
lifecycle can be
identified.
A, B, C Diverse
Hypothesis four (H4) states that ontologies tend
to get more complex. However, complexity from the
viewpoint of ontologies is different to define: Yang et
al. developed two complexity metrics for the gene
ontology: The average relationships per concept and
the average paths per concept. Here, we select the
latter as the results are more widespread throughout
the measured ontologies. However, the gene ontology
is heavily built on hierarchical relationships, and
Yang et al. only regard relationships as such that
incorporate hierarchical meaning (Yang et al., 2006).
We, thus, further consider the relationship diversity
proposed by the OntoQA framework (Tartir &
Arpinar, 2007), which measures the ratio of non-
inheritance and inheritance relationships. Arguably,
there are still many more aspects that constitute
complexity that one can measure, like general
concept inclusions or object property characteristics
(e.g., functional, symmetric). However, the focus on
these more generalistic attributes should be visible in
more repositories than other, more specific
measurements that are only used by a smaller number
of knowledge engineers.
All the hypotheses assume a standard
development process for ontologies and thus a
stereotypical development behavior. The last
hypothesis (H5) now tests whether we can identify a
joint development over time in an ontology or group
of ontologies. So while the former hypothesis
3
http://neontometrics.com
generates assumptions out of the lifecycle, H5
generalizes the findings and looks at the bigger
picture. It takes a variety of data into account, which
is described in the corresponding section 5.5
4 DATASET PREPARATION AND
ANALYSIS
The metric data for this analysis originates from the
NEOntometrics application
3
, developed by the same
authors as this paper. It allows the analysis of
ontology evolvement using git-based ontology
repositories and measures several structural
attributes. They include simple ones, like the depth of
the graph, the number of classes, or the count of
disjoint object properties. However, we also
implemented various metrics based on frameworks
proposed in the literature. Examples are the OntoQA
framework by (Tartir et al., 2005) or the OQual
measurements by (Gangemi et al., 2005), which are
also used in this paper. The application webpage
provides further reads on the capabilities and
architecture of the metric calculation software.
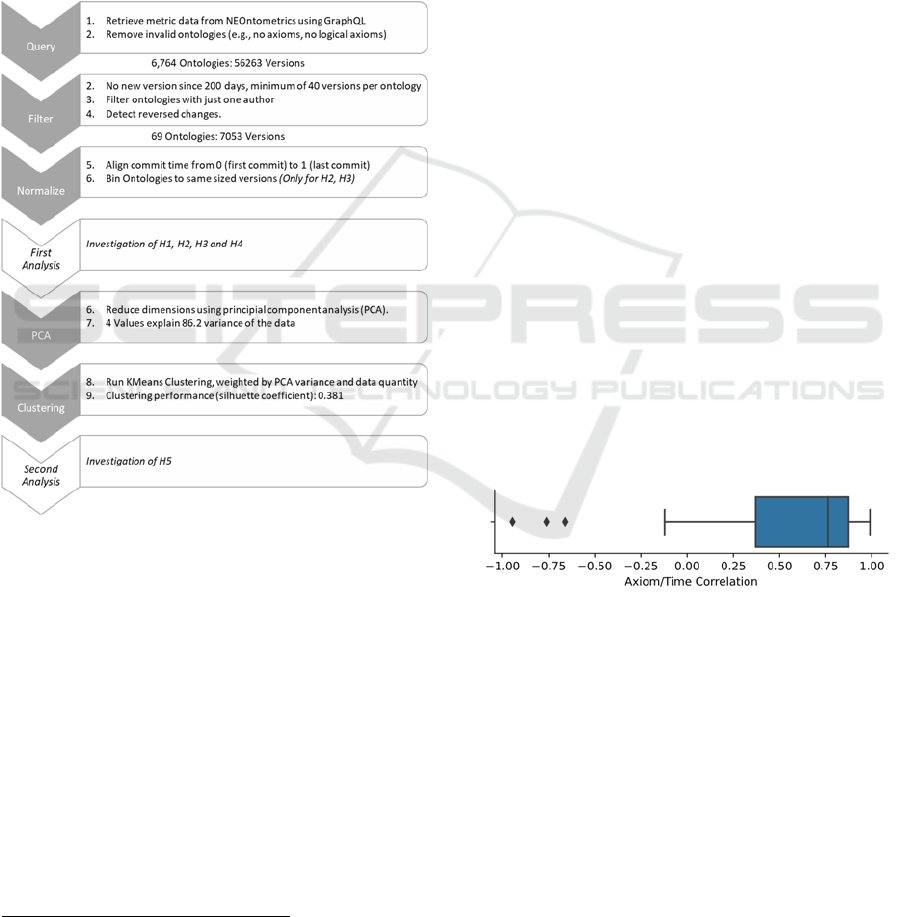
Figure 1 depicts the data pipeline. It begins with
the metric data access using the GraphQL endpoint of
NEOntometrics (1), followed by an initial check for
validity. Ontologies without logical axioms were not
further considered (2). That filtered out empty
ontologies, as well as such that merely contained
annotations or a fully custom vocabulary.
The query and validity check resulted in 159 git-
based ontology repositories containing 6,764
ontology files and 56,263 ontology commits (thus,
ontology versions).
In the next step, we applied several filters, starting
with conditions for our specific research questions
(3). As we are especially interested in the
development process of ontologies over the whole
lifetime, we need artifacts at the end of their lifecycle.
We considered ontologies without activity in the last
200 days as dormant (result: 6,016 ontology files,
31,439 versions).
Further, as this research focuses on the evolutional
aspects of ontology development, only such with a
rich history can be considered relevant. In this regard,
we set the threshold value for the minimum number
of versions to 40 (result: 77 ontology files, 11,998
versions).
Further not relevant are isolated or "toy"
ontologies that do not have a significant user base.
Here, we considered only ontologies that have at least
Debunking the Stereotypical Ontology Development Process
85
two authors (result: 69 ontology files, 10,810
versions).
The last step of filtering is the removal of reversed
commits (4). At times, the data show that metrics are
being reversed (changeOfCommit0 ==
changeOfCommit 1 + changeOfCommit2 AND
changeOfCommit0 = changeOfCommit2). For
instance, these can occur if one reverses the new
commit and recommits the old one. However, this
kind of behavior also occurs during merging
operations. After this last filter (4), the resulting data
set ready for analysis consisted of 69 ontologies with
7053 versions out of 30 repositories.
Figure 1: Data preparation and processing pipeline.
The actual dates of the ontology commits differ
widely. While some have been developed just
recently, others are older, without activity for some
years. To align the varying time frames, we
normalized the dates (5.) to a numerical value from 0
(first commit) to 1 (the last commit of the ontology).
At last, two of the analysis use the number of
commits and the commit time during the ontology
lifetime (H2, H3). To prevent the disproportionate
presence of ontologies with rich version history, we
proportionally thinned the commit times to around 40
for these hypotheses to ensure all ontologies are
represented equally (6.).
4
https://doi.org/10.5281/zenodo.7084705
With this last data preparation step, the data
preprocessing is completed for the answering of H1 –
H4. The processing steps for H5 are depicted in the
corresponding subsection 5.5. The analysis is based
on Jupyter notebooks. The corresponding source code
and ontology metric data are available online for
further investigation
4
.
The data used in this analysis covers manifold
application domains. Dormant ontologies from the
biomedical domain like the cell ontology or
obophenotype are included, as well as the food
ontology, ontologies about agriculture, Italian
cultural heritage or an information processing
ontology for robots.
5 EMPIRICAL ASSESSMENT OF
HYPOTHESES
Based on the hypotheses and the associated metrics
formulated in section three, we will now look at the
ontology metric data and assess whether the stated
assumptions can be empirically confirmed.
5.1 Ontologies Grow during Their
Lifetime (H1)
The first hypothesis states that ontologies get larger
over time. Our data supports this statement for a
majority of the ontologies. When comparing the
median of the first half of the ontologies' life to the
second half, 86,9 % have become larger and 13 %
smaller.
Figure 2: Distribution of correlation of axioms and time
(Pearson) of the ontology files.
The boxplot in Figure 2 shows the distribution of
measured correlation of the ontology axioms with the
normalized commit time. Half of the ontologies have
a strong positive correlation between axiom growth
and time. For the second half, however, this
correlation is less prominent. Three of the ontologies
even have strong negative growth.
As a result, we cannot confirm H1 to the full
extent. While most ontologies support the assumption
and consistently grow during their lifespan, 30,4 % of
KEOD 2022 - 14th International Conference on Knowledge Engineering and Ontology Development
86
the ontologies have a Pearson correlation value of
below 0.5. While most ontologies get more extensive
as a rule of thumb, this is not a generally applicable
rule.
5.2 The Level of Change Decreases
over Time (H2)
The statement (H2) assumes that rising ontology
maturity is associated with a decreasing change
activity. This assumption is tested by analyzing the
timely occurrence of commits and their commit size.
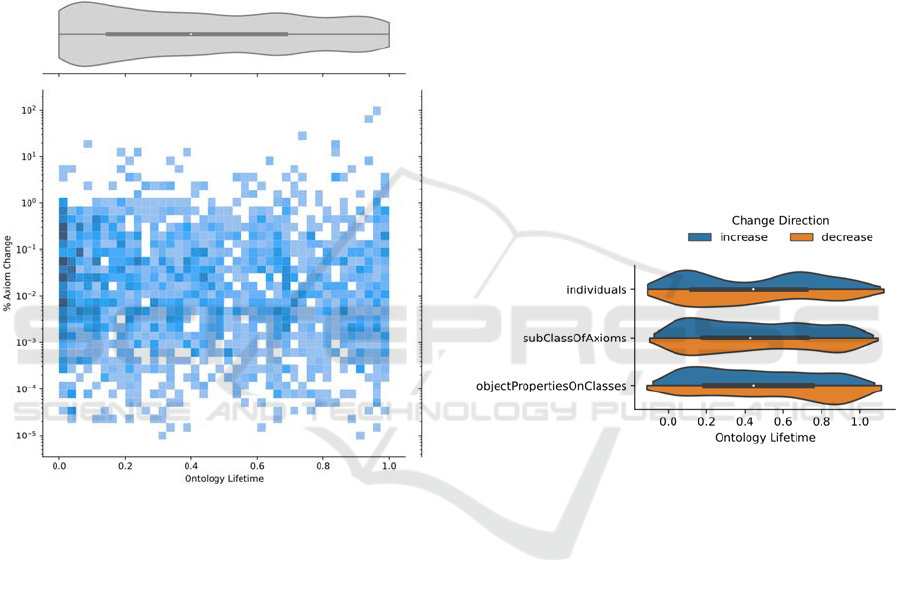
Figure 3: Development of axioms over the ontology
lifetime in percentage (log scale).
The violin plot at the top of Figure 3 displays the
change activity. The width of the violin graph
indicates the number of commits at a given lifecycle
stage. As the plot shows, most commits occur at the
beginning of the ontology lifecycle. Inside the violin
plot is a little boxplot. It indicates that more than half
of the ontology changes occur before 40 % of their
lifetime.
However, the size of the changes does not vary as
greatly. Underneath the boxplot is a bivariate
histogram plot. The darker the color, the more
commits occurred with the given percentage of axiom
increase or decrease. The graph shows first that the
size of changes varies widely, and secondly, that there
is not much difference in the size of the changes
throughout the ontology lifetime.
A closer look at the ontology files reveals that the
data is too heterogenous to validate the hypothesis as
a general rule. Of the 69 measured ontologies, 34
have more changes in the last third of their lifetime
compared to the first or second third. Applying the
same comparison to the mean change, 48 ontologies
have larger changes in the last third than in the first or
second third.
As a result, like with H1, we cannot confirm H2
to the full extent. While the data indeed shows that
the most and the most extensive changes occur during
the beginning of the ontology development process,
the rest of their lifetime is less distinguishable.
5.3 The Instances are Introduced after
the Initial Design (H3)
The third hypothesis (H3) makes assumptions
specifically for the development process. It states that
the structure of the ontology is developed first, and
instances are introduced later.
Figure 4: Change activity of ontology metrics over time.
Figure 4 shows the number of change activities
(not the intensity of the change) regarding sub-
classes and the addition or deletion of object
properties on classes and individuals. At first, it is
evident that the hypothesis of different phases of
adding structure and instances is not valid. It is quite
the opposite: At the beginning, there is a lot of
change activity and instability overall, with many
additions and deletions for all metrics, including the
individuals. However, after the first phase of
instability, the activity regarding instances decreases
overall. With increasing maturity, more commits
populate the ontology, and the deletions of
individuals decrease. The little boxplot inside the
violin graph shows that the median of commits
concerning individuals comes shortly after the
median of the other structural metrics; the difference,
however, is relatively small.
In conclusion, we cannot confirm H3 for ontology
development. Even though the end of the ontology
Debunking the Stereotypical Ontology Development Process
87
lifecycle comes with an increase of instances, the
development of structure and instances does not
happen separately but jointly.
5.4 Ontology Complexity Increases
with Rising Maturity (H4)
Hypothesis four (H4) states that, with rising maturity,
ontologies get more interconnected and complex.
This paper considers complexity as the average paths
per concept (thus assessing how many multi-
inheritance relationships are in the ontology) and the
ratio of inheritance and non-inheritance relationships.
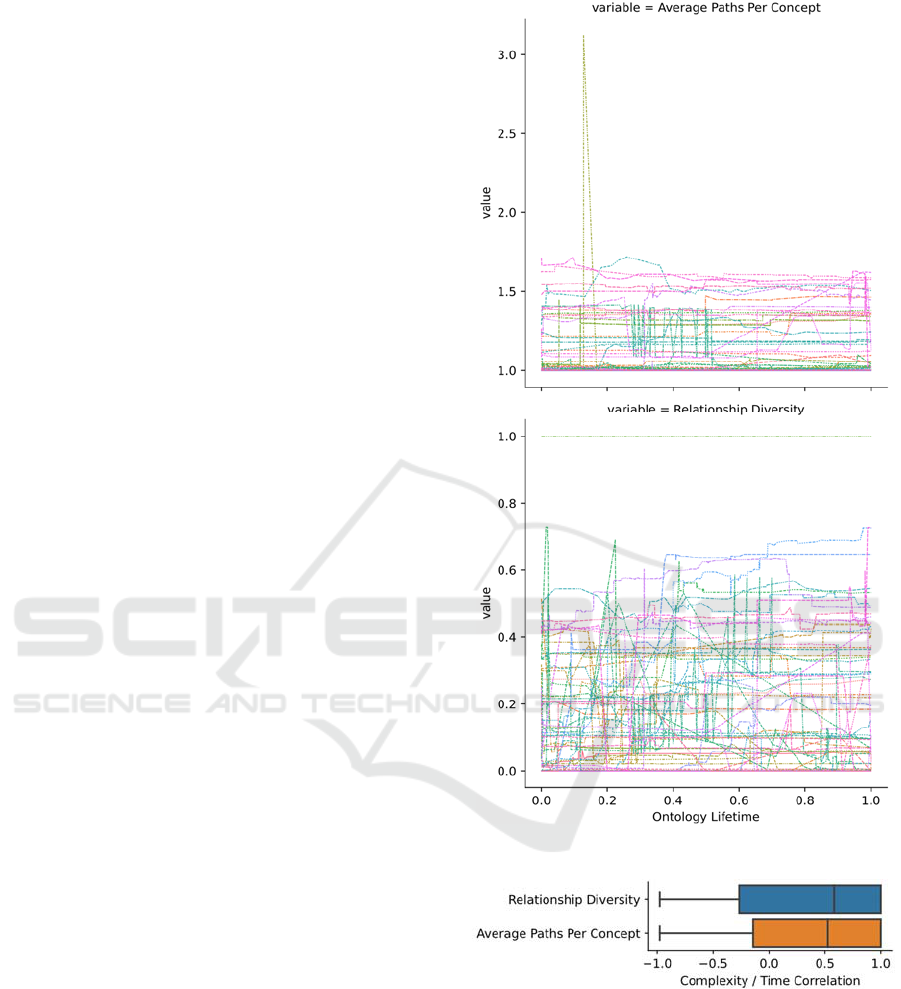
Both variables are plotted in their development over
time in Figure 5, where every line represents one
ontology.
This first visualization for H4 (Figure 5)
incorporates several findings: At first, some
ontologies fluctuate widely in their structural
complexity, while others remain relatively consistent.
This fluctuation is especially evident in the bottom
graph: Many ontologies show significant variations
of their inheritance to non-inheritance relation ratios.
While there is a slight tendency for rising complexity
(a rise of average paths and relationship diversity)
visible, it cannot be derived as a general rule. Instead
of constant metrics change, the measures seem to
progress rather volatile, and many ontologies show
heavy swings in their measured complexity in both
directions.
The second diagram visualizes the Pearson
correlation of the complexity measures and time for
the analyzed ontologies. It, thus, analyses whether the
ontologies rise steadily in their complexity.
In this case, its distribution looks somewhat
similar to the analysis of H1. Most ontology files
show a positive correlation, thus getting more
complex over time. However, a common rule cannot
be established, as there is too much heterogeneity in
the data, including ontologies with no apparent
correlation or even a stringent complexity decrease.
The result of H4 is similar to the previously tested
hypothesis. While there are indicators that the
majority of ontologies indeed get more complex with
rising maturity, there is still too much contradictory
evidence for acceptance of the hypothesis.
5.5 A Stereotypical Development
Lifecycle Can Be Identified (H5)
The last hypothesis is not concerned with the
development of isolated aspects of ontologies
Figure 5: Ontology complexity development over time.
Figure 6: Distribution of the ontology complexity in
correlation with their lifetime.
but consolidates the findings into a generalized
hypothesis. Central is the question of whether there is
something like a joint, stereotypical development
process for ontologies. The assessment of this
hypothesis is now not based merely on a single metric
but takes into account eleven compositional measures
KEOD 2022 - 14th International Conference on Knowledge Engineering and Ontology Development
88
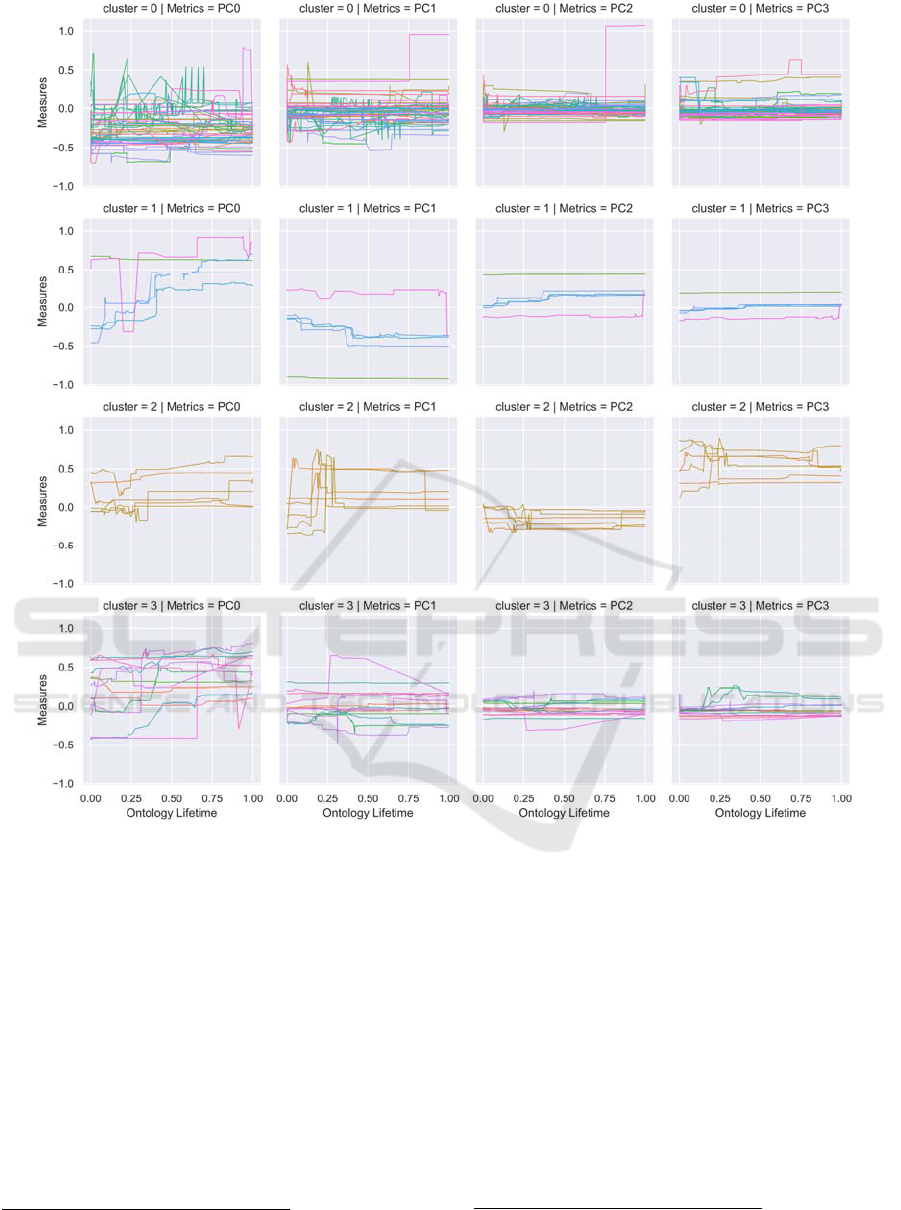
Figure 7: Clustering based on principal component analysis (PCA) for the ontologies.
proposed in the OQual
5
(Gangemi et al., 2005) and
OntoQA
6
(Tartir et al., 2005) framework. The
compositional values set metrics in relation to each
other. Thus, they allow a better comparison of
ontologies with varying sizes as count-related
measurements like the number of axioms or classes.
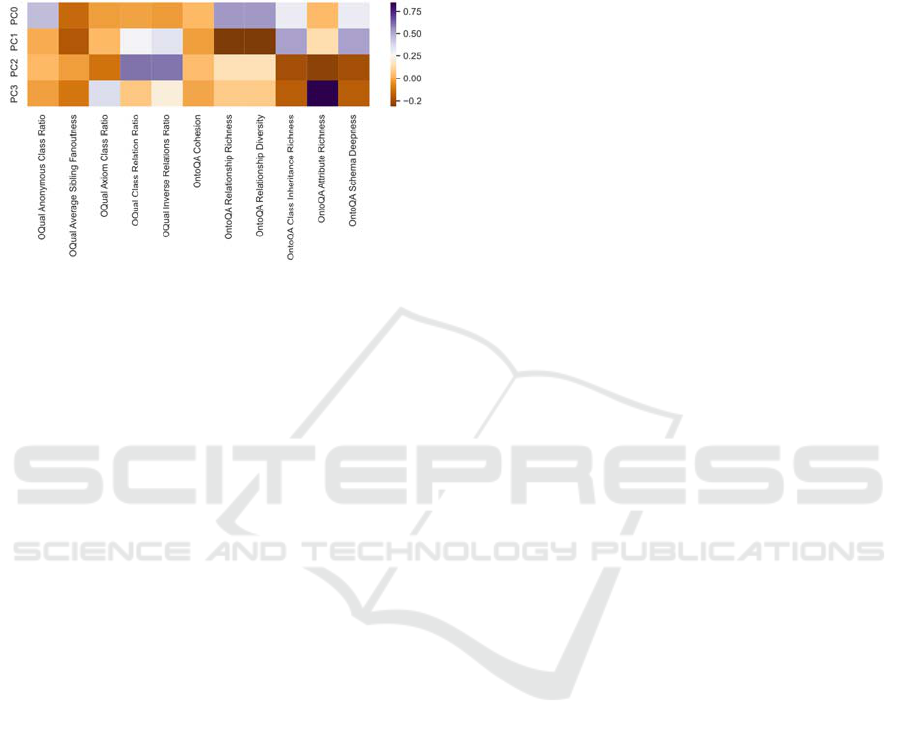
However, eleven metrics are still too numerous for
efficient visual comprehension. A principal
component analysis (PCA) based on the normalized
metric values (0:1) allows the reduction to four
principal components (PCs), which explain 86.2%
variance in the data. Figure 8 shows how the PCs
explain the variance of the given metrics.
5
Anonymous classes ratio, average Sibling fan outness,
axiom class ratio, class relation ratio, inverse relations ratio
The selected measurements are much more specific
than the metrics used for the previous analysis. Thus,
we do not expect to see a commonly accepted
development process applicable to all kinds of
ontologies. However, we argue that if there is
something like a stereotypical development process, we
shall expect groups of ontologies that develop similarly.
The calculated PCs are the input for an
unsupervised machine learning algorithm. Our goal is
to identify similar ontologies using the clustering
algorithm KMeans. While (as the previous analysis
has shown) a universal development process seems
unrealistic, clustering has the potential to reveal
6
Cohesion, relationship richness, relationship diversity, class
inheritance richness, attribute richness, schema deepness
Debunking the Stereotypical Ontology Development Process
89
hidden relations between the ontologies and find
typical development processes. The input data are
weighted for the PC's explained variance and the
number of input versions. The latter ensures that all
ontologies have the same impact on the clustering,
regardless of the number of available versions.
Figure 8: Explained variance of PCs.
The number of clusters is a required input
parameter for the algorithm. To identify the ideal
number of clusters, we ran multiple iterations of the
algorithm and evaluated the results using the
silhouette coefficient (Rousseeuw, 1987). The
coefficient rates the quality of the clusters from -1
(wrong clusters) to 1 (perfect clusters). Values around
0 indicate overlapping. For the ontology dataset, the
coefficient indicated four as the recommended
number of clusters with a silhouette coefficient of
0.381. However, it has to be noted that the clustering
is somewhat unstable and varies in each run.
Afterward, the ontologies are assigned with the
cluster calculated most throughout their versions.
These four clusters now represent groups of
ontologies where we assume a similar development
process.
Figure 7 reveals minimal evidence that groups of
ontologies share a typical development over their
lifetime. Conversely, ontologies that show a shared
modeling behavior, like in cluster 0, mostly have just
little overall activity. Additionally, the graphs
seldomly show gradual changes as we would expect
from progressively improving, evolving ontologies.
In this way, it supports the findings made by the
previous subsections: The data does not seem to show
a stereotypical development process that ontologies
in general or groups of ontologies share. This
heterogeneity in the data is also a possible
explanation for the unstable clusters overall.
Another conspicuousness visible in the graphs is
the spikes that indicate heavy restructuring, similar to
the spikes of H4. Instead of gradual development, the
ontologies often remain relatively constant for a long
time and then change drastically. These spikes are
present in all clusters and further hinder the grouping
of ontologies.
6 CONCLUSION
It is intriguing to think of ontologies as computational
artifacts that follow stereotypical development
processes. Such developing cycles could help to
advise the knowledge engineers on subsequent
recommended development steps and enable the
developers that need to select an ontology for
integration to make better-informed decisions. In this
regard, we set up five hypotheses on how ontologies
evolve during their lifecycle, grounded in knowledge
and software engineering research, and tested them
against a large body of metric ontology data.
The data does not support the existence of
standard ontology development processes. While
there are indeed indications for some hypotheses, like
the increase in size (H1), complexity (H4), or the
decrease in development activity (H2), too many
ontologies contradict the given assumptions. We
further found no conclusive evidence for hypothesis
two (H2), that the ontology population follows
schema development, or the last hypothesis and
analysis (H5), which looked at the bigger picture and
examined whether common development processes
between groups of ontologies exist.
While we found no support for the given
hypotheses in the data, particularly H4 and H5
revealed an exciting finding: Often, the ontologies
have few heavy change events during their lifetime
and otherwise stay relatively consistent. While these
disruptive commits hinder the identification of the
stereotypical development process, they are an
essential finding and are worth investigating further.
Thus our following research will consider these
change events: Their origins, their implications for
the ontology development process, and the selection
of ontologies in general.
Rule-based artificial intelligence is developed and
used in various communities with different
backgrounds, needs, and application scenarios. As we
have shown, the resulting ontologies reflect this
heterogeneity. While they all use the same underlying
technology, their way of developing these artifacts
differs widely. As a result, commonly existing rules
for ontology development, like they are prevalent in
software engineering, seem not to fit the knowledge
engineering context.
KEOD 2022 - 14th International Conference on Knowledge Engineering and Ontology Development
90

REFERENCES
Ashraf, J., chang, E., Hussain, O. K., & Hussain, F. K.
(2015). Ontology Usage Analysis in the Ontology
Lifecycle: A State-of-the-Art Review. Knowledge-
based systems, 80, 34–47. Https://doi.org/10.1016/j.
knosys.2015.02.026
Cook, S., Harrison, R., Lehman, M. M., & Wernick, P.
(2006). Evolution in software systems: foundations of
the SPE classification scheme. Journal of Software
Maintenance and Evolution: Research and Practice,
18(1), 1–35. https://doi.org/10.1002/smr.314
Gangemi, A., Catena, C., Ciaramita, M., & Lehmann, J.
(2005). A theoretical framework for ontology
evaluation and validation. In P. Bouquet & G.
Tummarello (Eds.), Semantic Web Applications and
Perspectives. CEUR. http://ceur-ws.org/Vol-166/
Herraiz, I., Rodriguez, D., Robles, G., & Gonzalez-
Barahona, J. M. (2013). The evolution of the laws of
software evolution. ACM Computing Surveys, 46(2),
1–28. https://doi.org/10.1145/2543581.2543595
Malone, J., & Stevens, R. (2013). Measuring the level of
activity in community built bio-ontologies. Journal of
Biomedical Informatics, 46(1), 5–14. https://doi.org/
10.1016/j.jbi.2012.04.002
Mihindukulasooriya, N., Poveda-Villalón, M., García-
Castro, R., & Gómez-Pérez, A. (2017). Collaborative
Ontology Evolution and Data Quality - An Empirical
Analysis. In M. Dragoni, M. Poveda-Villalón, & E.
Jimenez-Ruiz (Eds.), Lecture notes in computer
science: Vol. 10161, Owl: Experiences and directions -
reasoner evaluation: 13th International Workshop,
OWLED 2016 and 5th International Workshop, ORE
2016, Bologna, Italy, November 20, 2016 : Revised
selected papers (pp. 95–114). Springer.
https://doi.org/10.1007/978-3-319-54627-8_8
Noy, N., & Klein, M. (2004). Ontology Evolution: Not the
Same as Schema Evolution. Knowledge and
Information Systems, 6(4), 428–440. https://doi.org/
10.1007/s10115-003-0137-2
Rajlich, V. T., & Bennett, K. H. (2000). A staged model for
the software life cycle. Computer, 33(7), 66–71.
https://doi.org/10.1109/2.869374
Reiz, A. (2020). An Evolutional Based Data-Driven
Quality Model for Ontologies. In H. Alani & E. Simperl
(Chairs), ISWC-DC, Athens, Greece/online.
http://ceur-ws.org/Vol-2798/paper1.pdf
Rousseeuw, P. J. (1987). Silhouettes: A graphical aid to the
interpretation and validation of cluster analysis. Journal
of Computational and Applied Mathematics, 20, 53–65.
https://doi.org/10.1016/0377-0427(87)90125-7
Stojanovic, L. (2004). Methods and tools for onology
evolution [Ph.D.]. Universitaet Fridericiana, Karlsuhe.
Tartir, S., & Arpinar, I. B. (2007). Ontology Evaluation and
Ranking using OntoQA. In International Conference on
Semantic Computing, 2007: Icsc 2007 ; 17 - 19 Sept.
2007, Irvine, California ; proceedings ; [held in
conjunction with] the First International Workshop on
Semantic Computing and Multimedia Systems (IEEE-
SCMS 2007) (pp. 185–192). IEEE Computer Society.
https://doi.org/10.1109/ICSC.2007.19
Tartir, S., Arpinar, I. B., Moore, M., Sheth, A. P., &
Aleman-Meza, B. (2005). OntoQA: Metric-Based
Ontology Quality Analysis. In D. Caragea, V. Honavar,
I. Muslea, & R. Ramakrishnan (Chairs), IEEE
Workshop on Knowledge Acquisition from
Distributed, Autonomous, Semantically Heterogeneous
Data and Knowledge Sources, Houston.
Yang, Z., Zhang, D., & Ye, C. (2006). Ontology Analysis
on Complexity and Evolution Based on Conceptual
Model. In U. Leser (Ed.), Lecture notes in computer
science Lecture notes in bioinformatics: Vol. 4075.
Data integration in the life sciences: Third international
workshop, DILS 2006, Hinxton, UK, July 20 - 22, 2006
; proceedings (Vol. 4075, pp. 216–223). Springer.
https://doi.org/10.1007/11799511_19
Zablith, F., Antoniou, G., d'Aquin, M., FLOURIS, G.,
Kondylakis, H., Motta, E., PLEXOUSAKIS, D., &
Sabou, M. (2015). Ontology Evolution: A Process-
Centric Survey. The Knowledge Engineering
Review, 30(1), 45–75. https://doi.org/10.1017/
S0269888913000349.
Debunking the Stereotypical Ontology Development Process
91
