
Edge Containerized Architecture for Manufacturing Process Time
Series Data Monitoring and Visualization
Ander Garcia
a
, Xabier Oregui
b
, Javier Franco
c
and Unai Arrieta
d
Vicomtech Foundation, Basque Research and Technology Alliance (BRTA),
Mikeletegi 57, 20009 Donostia-San Sebastián, Spain
Keywords: Cyber Physical System, Industry 4.0, Time Series, Edge Computing.
Abstract: Pushed by the Industry 4.0 paradigm, the volume of data being captured from manufacturing lines is
continuously increasing. To get a deeper insight of manufacturing processes, time series data from key
variables of the processes has to be captured, monitored and visualized. This implies that more data variables
must be monitored and data must be captured at a higher frequency: from one value of a few key variables to
values of several variables captured at frequencies of seconds. Traditional Manufacturing Execution Systems
(MES) were not designed for this scenario and cannot cope with these requirements. Thus, new architectures
and tools are required to merge Information Technology (IT) and Operation Technology (OT) fields. This
paper proposes a lightweight architecture based on micro-services and time series data requirements to
connect to manufacturing process controllers, and to capture, store, monitor and visualize relevant data about
the process. Moreover, a reference implementation based on Open Source tools is presented and validated.
1 INTRODUCTION
Pushed by the Industry 4.0 paradigm, the volume of
data being captured from manufacturing lines is
continuously increasing. To get a deeper insight of
manufacturing processes, more data variables are
being monitored and data is captured at a higher
frequency: from one value of a few key variables for
a whole batch, to time series of several variables
captured at frequencies of seconds. Traditional
Manufacturing Execution Systems (MES) were not
designed for this scenario.
Thus, new architectures are required to integrate
Information Technology (IT) and Operations
Technology (OT) fields. This implies a myriad of IT
and OT technologies, standards and specifications
related to Industry 4.0.
The complexity of this integration generates a
knowledge barrier, as these IT technologies follow a
completely different philosophy from the regular
tools used by OT engineers. Thus, Small and
Medium-sized Enterprises (SMEs), which generally
a
https://orcid.org/0000-0001-5596-2838
b
https://orcid.org/0000-0002-2443-3367
c
https://orcid.org/0000-0002-9588-6857
d
https://orcid.org/0000-0003-0710-8148
lack multidisciplinary teams with the required IT and
OT knowledge and experience, face big difficulties to
capture, monitor and visualize data from
manufacturing processes.
Standard reference architectures such as RAMI
4.0 support advanced Industry 4.0 use cases, adding
additional technological complexity, which does not
add value for most SMEs starting to monitor time
series data from their processes.
Existing market solutions rely on external cloud
servers to perform these tasks, adding a dependency
on servers out of the control of manufacturing
companies, which is not compatible with privacy and
confidentiality requirements of several
manufacturing companies.
This paper tackles this complexity by proposing a
containerized micro-service-based edge architecture
to monitor and visualize manufacturing processes.
The architecture connects to manufacturing
controllers to acquire time series data about the
processes, and then store it on a time series database
to be monitored and visualized. A reference
Garcia, A., Oregui, X., Franco, J. and Arrieta, U.
Edge Containerized Architecture for Manufacturing Process Time Series Data Monitoring and Visualization.
DOI: 10.5220/0011574500003329
In Proceedings of the 3rd International Conference on Innovative Intelligent Industrial Production and Logistics (IN4PL 2022), pages 145-152
ISBN: 978-989-758-612-5; ISSN: 2184-9285
Copyright
c
2022 by SCITEPRESS – Science and Technology Publications, Lda. All rights reserved
145

implementation of the architecture based on Open-
Source tools is presented and validated with a
simulated process.
2 RELATED WORK
The German government presented the Industrie 4.0
term in 2011. The objective of the fourth industrial
revolution is to work with a higher level of
operational productivity and efficiency, connecting
the physical to the virtual world. Industry 4.0, also
known as Industrial Internet of Things (IIoT), is
related to several technologies such as Internet of
Things (IoT), Industrial Automation, Cybersecurity,
Intelligent Robotics, or Augmented Reality (Alcácer
& Cruz-Machado, 2019).
The term cyber-physical systems (CPS) was
coined in the USA in 2006 and has received several
definitions (Fei et al., 2019). CPS is the merger of
‘‘cyber” as electric and electronic systems with
‘‘physical” things. The ‘‘cyber component” allows
the ‘‘physical component” (such as mechanical
systems) to interact with the physical world by
creating a virtual copy of it. This virtual copy will
include the ‘‘physical component” of the CPS (i.e., a
cyberrepresentation) through the digitalization of
data and information (Alcácer & Cruz-Machado,
2019).
In general, a CPS consists of two main functional
components: (1) the advanced connectivity that
ensures real-time data acquisition from the physical
world and information feedback from the cyber
space; and (2) intelligent data management, analytics
and computational capability that constructs the cyber
space (Lee et al., 2015).
First attempts to integrate advances services from
Industry 4.0 on manufacturing environments were
based on cloud computing. Cloud computing
paradigm relies on remote servers with a storage and
computing power magnitudes beyond local servers.
However, cloud computing presents four main
disadvantages for manufacturing scenarios: latency,
security, privacy, and cost.
Edge computing is a paradigm where data are
analyzed and stored close to the devices generating
and consuming them, facing previous disadvantages
and making them attractive for manufacturing
scenarios (Alam et al., 2018; Qiu et al., 2020).
The main objective of edge computing is to
exploit computational resources of interconnected
devices to increase their independence and to get data
analysis and exploitation closer to where data is
generated. This paradigm optimizes cloud computing
paradigms moving data processing task (or part of
them), to the edge of the network. This philosophy is
especially relevant for manufacturing scenarios.
Edge computing devices have increasingly
powerful computation functionalities. This, combines
with advanced connectivity technologies such as 5G,
which offers a fast, robust, and massive connectivity,
is paving the way for a new type of intelligent devices
and services based on Artificial Intelligence.
Recently, various attempts have been made to
transform manufacturing systems into interoperable,
connected and digitalized elements. However, the
main challenges of the Industry 4.0, including
cybersecurity, and standardized data interchange
between devices, machines and services, are still
opened (Lu, 2017). In (Qiu et al., 2020), a review of
the application of edge computing paradigm into
manufacturing scenarios is provided, identifying
architectures, advances and open challenges.
Existing international reference architectures for
manufacturing scenarios, such as RAMI 4.0 or IIRA,
propose reference models difficult to implement
(Szántó et al., 2021). Moreover, architectures
proposed by other authors target a lot of complex
functionalities related to the Industry 4.0
(Azarmipour et al., 2020; Omar et al., 2019; Yang et
al., 2020).
Thus, their implementation is time and cost
consuming, out of the reach of small and medium
manufacturing companies.
The architecture proposed in this paper is focused
on an specific case: monitor and visualize time series
data from manufacturing processes. However, the
architecture is flexible enough to be extended with
new future services (for example to integrate
Artificial Intelligence services), increase its
performance, or integrate new communication and
security mechanisms.
3 ARCHITECTURE
The architecture is composed by the following
components: client, message queue, writer, time
series database, visualizer, and monitor (Figure 1).
The manufacturing equipment is the asset being
monitored. Data from the equipment is captured from
the manufacturing controller, which publishes it using
standard communication specifications such as OPC-
UA or MQTT.
The Open Platform Communications Unified
Architecture (OPC-UA), has become the
interoperability standard for the secure and reliable
exchange of data in the industrial domain, easing the
IN4PL 2022 - 3rd International Conference on Innovative Intelligent Industrial Production and Logistics
146

Figure 1: General architecture.
tasks of capturing and exporting data. In the most
common OPC UA communication paradigm, the
manufacturing equipment has an OPC UA server that
allows to read/write variables values and to invoke
custom methods. Clients connect to the server to
read/write values of the variables, to call remote
methods, and to subscribe to receive changes on their
values.
MQTT is a robust and trustworthy protocol, with
implementations with very low computation
requirements and available for most of the current
hardware and software platforms.
MQTT is based on a queue manager (broker),
where different clients send messages (publish). Each
message is sent with a certain subject (topic) and may
contain data (payload). Other clients can show their
interest in certain topics to the que manager
(subscribe). When the queue manager receives a
message with some of these topics, it sends the
message to the subscribed clients.
This communication paradigm based on
publishing messages and subscribing to topics to
receive them, has proved to be a robust, efficient, and
low latency technology. Currently, it is one of the
most used protocols for Internet of Things domain.
Although the proposed architecture does not
impose the use of a communication protocol, authors
recommend the use of OPC-UA or MQTT. Most
modern Programable Logic Controllers (PLCs)
already include OPC-UA or MQTT functionalities,
and there are several specialized gateways on the
market translating other industrial protocols to OPC-
UA or MQTT.
However, if this option is not available for some
manufacturing scenario, it would be always possible
to develop a custom communication module inside
the client to get data from the manufacturing
controller.
The first element of the architecture is the client.
Its main task is to connect to the manufacturing
equipment to obtain the values of the manufacturing
process. The client has to perform data cleaning and
validation tasks to ensure the quality of the data,
including the check of the timestamps. Moreover,
when required, data has to be transformed to a proper
format to be stored, for example to update numeric
values to labels or Booleans, or to generate synthetic
data from variables. Once data is ready, it is sent to
the writer using a message queue.
The message queue decouples the client from the
writer. It could be based on any technology, such as
MQTT, as long as it satisfies the load requirements of
each scenario.
The main task of the writer is to receive data from
the message queue and to transform it into a proper
format to be sent directly to the time series database
to be stored.
The time series database manages data storage
and retrieval operations. This database should have
advanced functionalities to ease querying time series,
and to aggregate data to optimize disk space
utilization.
The visualizer is responsible to generate
dashboards of the manufacturing processes, and to
allow final users (operators, engineers…) to visualize
and manually analyse data.
The last element, the monitor, is focused on the
generation of alarms and notifications when data of
the manufacturing process is out of its regular range
or some conditions are fulfilled.
The architecture is based on decoupled micro-
services designed to be deployed as containers. The
objective is (i) to ease the deployment at the edge, and
(ii) to allow individual changes or upgrades of each
micro-service without having to update and validate
the rest of the micro-services.
4 REFERENCE
IMPLEMENTATION
This section presents a reference implementation of
the general architecture based on Open-Source tools.
Edge Containerized Architecture for Manufacturing Process Time Series Data Monitoring and Visualization
147

Each micro-service has been designed as a Docker
container, and the architecture has been orchestrated
with the docker compose tool.
The client has been implemented as a Python
micro-service. OPC-UA and MQTT support has been
based on the FreeOpcUa library and the MQTT Paho
library from the Eclipse Foundation. The client sends
values of the variables to the message queue with a
JSON payload with and object format. Each element
of the object has three element: timestamp of the
value, identifier of the equipment, and an object of
data with variables name and value pairs. Thus, each
message can include value for one or more variables.
The message queue has been implemented with
RabbitMQ, a lightweight and widely deployed Open-
Source message broker. Although it requires more
computing resources than MQTT, RabbitMQ
supports several messaging protocols and paradigms,
and has better security and reliability features.
Moreover, RabbitMQ includes internal buffers to
avoid losing messages if the writer is temporarily
overloaded and mechanisms to easily integrate new
writer containers if several clients are sending data to
the queue.
The writer has been implemented as a Python
micro-service. It receives messages from the queue,
and transforms data into INSERT queries for the
database. This insert queries have to be formatted to
fulfil the format expected by the SQL dialect of the
database.
TimescaleDB has been selected as the time series
database engine over other alternatives such as
InfluxDB due to its advanced functionalities, SQL
language compatibility, and the rich PostgreSQL
based tooling ecosystem. TimescaleDB is an Open-
Source database designed to make SQL scalable for
time-series data. It is engineered up from PostgreSQL
and packaged as a PostgreSQL extension.
Traditional relational databases, such as MySQL
or SQL Server, are not suited for the storage of time
series data, as their performance decrease greatly as
the data volume of the time series increases. NoSQL
databases, such as MongoDB, have recently include
support for time series data, but the functionalities
they offer to work with time series data is still not
comparable to the ones offered by TimescaleDB or
InfluxDB.
Finally, both the visualizer and the monitor
components have been deployed based on Grafana.
Grafana is a popular multi-platform Open Source
analytics and interactive visualization web
application. Grafana is agnostic of the underlying
database and has an intuitive user interface both to
customize charts and dashboards, and to generate
alerts and notifications based on advanced rules and
notification channels.
All the micro-services have been deployed as
docker containers within the same docker network.
The Web access port from Grafana has been exposed
within the client host to be accessible from a Web
Client. Port 5432 from TimescaleDB has also been
exposed to allow the use of PostgreSQL desktop tools
such as pgadmin from the host machine. Information
to automatically connect micro-services and to
manage data persistence of each container has been
included inside the docker compose definition.
The main customization of the reference
implementation to be deployed in a new scenario is
related to OPC UA or MQTT, and the structure of the
data and the database. For example, different OPC
UA servers may send data either as an object, or as a
several individual variables. Regarding MQTT, each
controller may use different topic and payload
definition to send data.
The design of the database is also specific of each
scenario. In a general scenario, a table with these
columns would be enough to store data:
• Time: to store the timestamp of the value
• Id: to store the identifier of the equipment
• Variable: To store the name of the variable
• Value: To store the value of the variable. It
should be a string to allow storing different data
types
However, this design may present performance
drawbacks to retrieve data from the database, and to
visualize and monitor it, as each value has to be
parsed. Thus, it is recommended that each scenario
designs its database table to store time series data.
For OPC-UA servers, a config file with the URL,
and optionally the username and password, has to be
updated. Moreover, a list of the identifier of each
OPC UA node variable has to be filled, including the
name and type of each variable. For MQTT, server
connection data (URL, username and password) and
the topic name have to be defined. Moreover, as
MQTT payload is not standardized, code changes
may be required on the client to read variable names
and values from the MQTT messages.
5 VA L I D AT I O N
The architecture has been validated with a simulator
of a manufacturing basic boiling process. The
simulator is provided by the Open Source OPC-UA
PLC server implementation from Microsoft. The
simulated boiler has three variables (temperature,
pressure and heater state) and two methods to turn the
IN4PL 2022 - 3rd International Conference on Innovative Intelligent Industrial Production and Logistics
148
heater on or off. When the heater is on, the bottom
temperature increases by 1 degree per second, the top
temperature is always 5 degrees less than the bottom
one. Pressure is calculated as 100000 plus bottom
temperature.
The client has subscribed to these variables to
receive their values and sent them to the message
queue. However, instead of publishing one node for
each variable, the OPC Server publishes one node of
type BoylerDataType. This data type includes three
variables:
• HeaderState: Boolean representing whether the
boiler is on or off
• Pressure
• Temperature: IT is an object with two
variables:
o Top
o Bottom
In order to get the identifier of the boiler node, we
have used a regular OPC UA client GUI, UaExpert
from Unified Automation. The identifier is
“ns=3;i=15013”.
The client subscribes to these node, and receives
updates of the values. Each time an update is
received, the object is parsed. When the boiler is off,
there is no data about the temperatures or the
pressure. Thus, the client set their value as “-1” to
mark them as unknown.
Once data is ready, the client send it to a
RabbitMQ queue named “boiler”. The next code
shows an example payload of the message:
{
"data": {
"temperature": {
"top": 23,
"bottom": 28
},
"pressure": 100028,
"heaterState": 1
},
"time": "2022-08-12T10:15:18.784Z",
"id": "boiler01"
}
The writer receives these updates and send them to
the TimescaleDB database. A table has been created
for the boiler with the following columns:
• Time: to store the timestamp of the value
• Id: to store the identifier of the boiler and to
allow to store data from more than one boiler in
the future
• Top: To store the temperature of the top of the
boiler
• Bottom: To store the temperature of the bottom
of the boiler
• Pressure: To store the pressure
• HeaderState: To store whether the boiler is off
(0) or on (1)
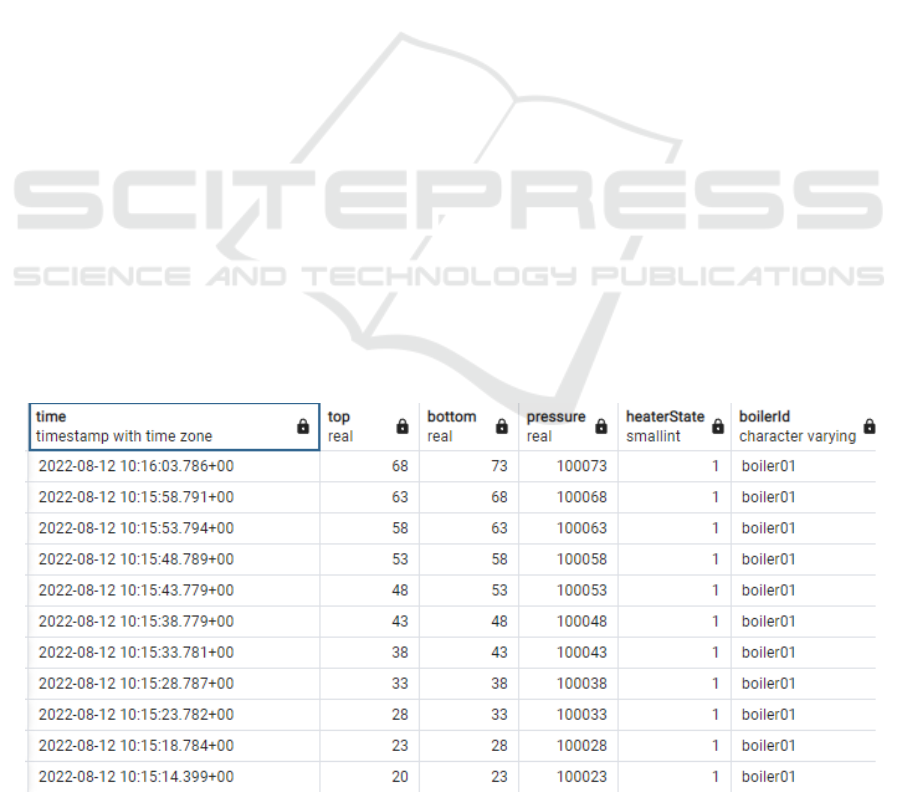
The writer receives each message and generates the
following SQL query to insert data. The database
receives the query and stores data on the table (Figure
2).
INSERT INTO boiler("time", top, bottom, pressure,
"heaterState","boilerId") VALUES ('2022-08-
12T10:18:03.779Z', 30, 35, 100193, 1,'boiler01');
The notifier has been configured to raise alarms each
time some of these conditions are met:
• Temperature is out of the 15-300 range
• Pressure is above 101500
• Temperature is above 200 and pressure is
above 100500
Figure 2: Screenshot of a select query of the data.
Edge Containerized Architecture for Manufacturing Process Time Series Data Monitoring and Visualization
149
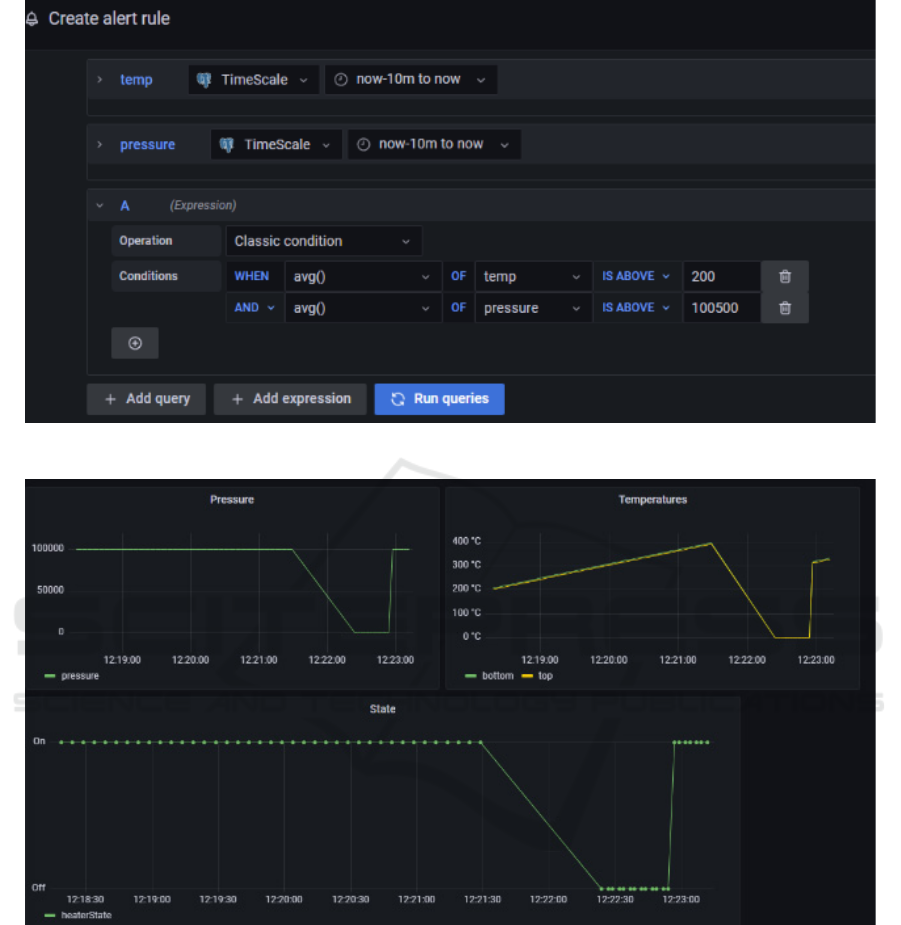
Figure 3: Example of a complex rule generation.
Figure 4: Example of a Grafana dashboard.
The alarms are easily configured using the
Grafana GUI (Figure 3). For each alert rule, after
selecting the datasource and the related table and
column, several conditions can be applied to decide
whether an alert should be raised.
Grafana has a powerful alert customization and
notification mechanism able to suit most of the
regular requirements to monitor manufacturing
equipment. Once rules have been defined, labels can
be attached to them to ease their management. Then,
a notification policy is applied where several filters
regarding time, labels, severities… allow to decide
whether the alert has to be redirected to any of the
available notification channels. There are several
notification channels (email, slack, PagerDuty…)
available, and custom ones can also be defined.
Finally, a dashboard showing the values of the
temperature, pressure and status of the boiler has been
generated in Grafana (Figure 4).
Definition of each graph is easily customized
using the available query builder (Figure 5). Using the
GUI a general SQL query is generated, and it is also
possible to insert manual SQL queries to directly
integrate advanced functions from TimescaleDB such
IN4PL 2022 - 3rd International Conference on Innovative Intelligent Industrial Production and Logistics
150
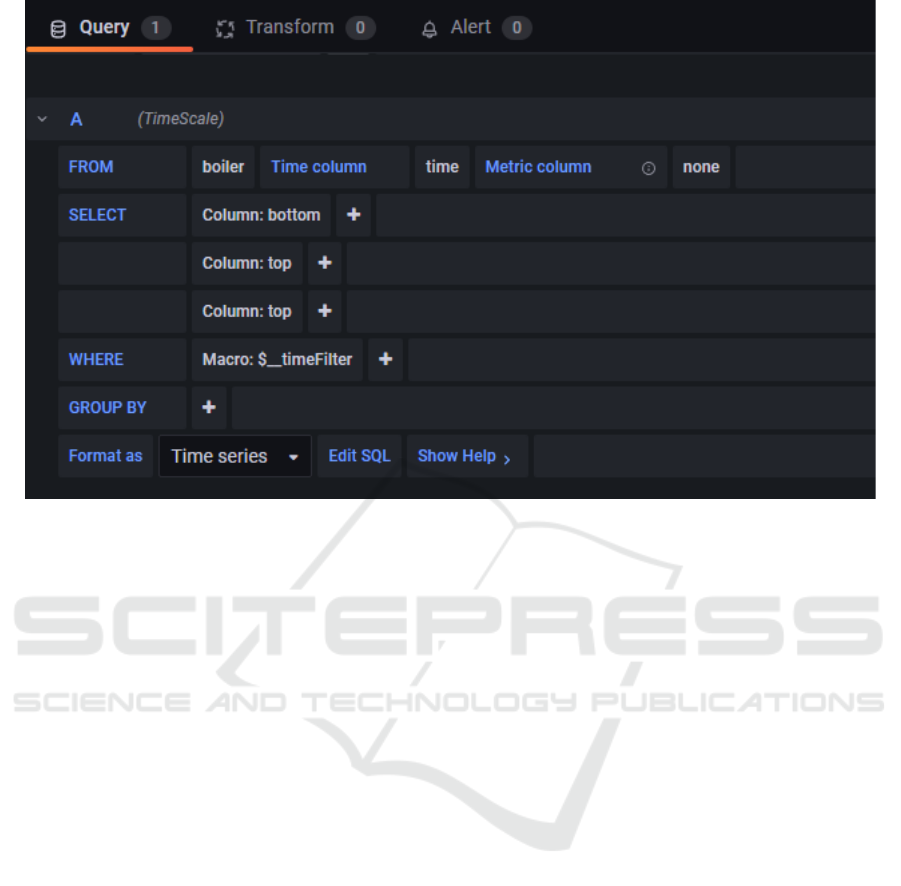
Figure 5: Query builder from Grafana.
as time buckets. Time buckets allow to get uniformly
distributed data points within a range, for example
one value with the average of the values from the
database each 10 minutes.
The whole system has been defined as docker
containers orchestrated within a docker compose file.
This docker compose file can be used as a template to
be deployed in new scenarios, after updating the
points mentioned in the previous section.
6 CONCLUSIONS
Industry 4.0 requires data to get insights of the
manufacturing processes. Thus, requirements to
capture more data variables and at a higher frequency
arises: from one value of a few key variables for a
whole batch, to time series of several variables
captured at frequencies of seconds. Traditional
Manufacturing Execution Systems (MES) were not
designed for this scenario composed by a high
volume of time series data of manufacturing
processes.
Thus, new architectures are required to integrate
Information Technology (IT) and Operations
Technology (OT) fields. This implies a myriad of IT
and OT technologies, standards and specifications
related to Industry 4.0, with a high complexity level.
SMEs are not ready to cope with this complexity
level.
This paper tackles this complexity by proposing a
containerized micro-service-based edge architecture
to monitor and visualize manufacturing processes.
The architecture connects to manufacturing
controllers to acquire time series data about the
processes, and then store it on a time series database
to be monitored and visualized. A reference
implementation of the architecture based on Open-
Source tools has been presented and validated with a
simulated process.
The architecture is based on decoupled containers
to be easily deployed at the edge. It has four main
elements.
The client connects to the manufacturing
equipment to obtain the values of the manufacturing
process. Once data is ready, it is sent to the writer
using a message queue.
The main task of the writer is to receive data from
the message queue and to transform it into a proper
format to be sent directly to the time series database
to be stored. The time series database manages data
storage and retrieval operations.
The visualizer is responsible to generate
dashboards of the manufacturing processes, and to
allow final users (operators, engineers…) to visualize
and manually analyse data.
The last element, the monitor, is focused on the
generation of alarms and notifications when data of
the manufacturing process is out of its regular range,
or some conditions are fulfilled.
Edge Containerized Architecture for Manufacturing Process Time Series Data Monitoring and Visualization
151

A reference implementation based on the following
Open Source has also been provided:
• Custom Python scripts for the client and the
writer
• RabbitMQ message queue to connect the client
and the writer
• TimescaleDB to store time series data
• Grafana to deploy and customize the visualizer
and the monitor
This implementation has been validated using a
simulator of a boiler from Microsoft which includes
and OPC UA Server to subscribe to its values. Data
from the boiler has been captured, adapted and stored
at the database. A Grafana dashboard has been
created to visualize data from the boiler, and three
rules have been successfully generated to create alerts
when undesirable conditions are fulfilled.
The proposed architecture greatly decreases the
technological barrier required to monitor and
visualize data from manufacturing processes.
Moreover, as data is already properly stored at the
database, it serves as a foundation for future services,
for example integrating Artificial Intelligence
algorithms to provide predictive maintenance
functionalities.
Future work starts with a validation at a real
manufacturing scenario for a relevant period of time
to test the resilience and scalability of the
implementation. Moreover, advances functionalities
from TimescaleDB to manage data retention and
aggregation policies should also be validated.
Performance of the solution in a real scenario
customized with rules and alarms related to a real
manufacturing use case should also be tackled during
the validation.
One last point to further decrease the
technological barrier consists of the integration of no-
code tools, such as node-red. Node-red is a popular
graphical tool where non-expert users interact with
simple blocks to customize the functionalities of a
system using an interactive interface.
ACKNOWLEDGEMENTS
This work has been partially founded by the Basque
Government (SPRI) through the following Elkartek
project: KK-2021/00111 ERTZEAN.
REFERENCES
Alam, M., Rufino, J., Ferreira, J., Ahmed, S. H., Shah, N.,
& Chen, Y. (2018). Orchestration of Microservices for
IoT Using Docker and Edge Computing. IEEE
Communications Magazine, 56(9), 118–123.
https://doi.org/10.1109/MCOM.2018.1701233
Alcácer, V., & Cruz-Machado, V. (2019). Scanning the
Industry 4.0: A Literature Review on Technologies for
Manufacturing Systems. Engineering Science and
Technology, an International Journal, 22(3), 899–919.
https://doi.org/10.1016/j.jestch.2019.01.006
Azarmipour, M., Elfaham, H., Gries, C., Kleinert, T., &
Epple, U. (2020). A Service-based Architecture for the
Interaction of Control and MES Systems in Industry 4.0
Environment. IEEE International Conference on
Industrial Informatics (INDIN), 2020-July, 217–222.
https://doi.org/10.1109/INDIN45582.2020.9442083
Fei, X., Shah, N., Verba, N., Chao, K. M., Sanchez-Anguix,
V., Lewandowski, J., James, A., & Usman, Z. (2019).
CPS data streams analytics based on machine learning
for Cloud and Fog Computing: A survey. Future
eneration Computer Systems, 90, 435–450.
https://doi.org/10.1016/j.future.2018.06.042
Lee, J., Bagheri, B., & Kao, H. A. (2015). A Cyber-Physical
Systems architecture for Industry 4.0-based
manufacturing systems. Manufacturing Letters, 3, 18–
23. https://doi.org/10.1016/j.mfglet.2014.12.001
Lu, Y. (2017). Industry 4.0: A survey on technologies,
applications and open research issues. Journal of
Industrial Information Integration, 6, 1–10.
https://doi.org/10.1016/j.jii.2017.04.005
Omar, A., Imen, B., M’Hammed, S., Bouziane, B., &
David, B. (2019). Deployment of Fog Computing
Platform for Cyber Physical Production System Based
on Docker Technology. Proceedings - 2019 3rd
International Conference on Applied Automation and
Industrial Diagnostics, ICAAID 2019, 1(September),
1–6. https://doi.org/10.1109/ICAAID.2019.8934949
Qiu, T., Chi, J., Zhou, X., Ning, Z., Atiquzzaman, M., &
Wu, D. O. (2020). Edge Computing in Industrial
Internet of Things: Architecture, Advances and
Challenges. IEEE Communications Surveys and
Tutorials, 22(4), 2462–2488. https://doi.org/10.1109/
COMST.2020.3009103
Szántó, N., Pedone, G., Monek, G., Háy, B., & Jósvai, J.
(2021). Transformation of traditional assembly lines
into interoperable CPPS for MES: an OPC UA enabled
scenario. Procedia Manufacturing, 54, 118–123.
https://doi.org/10.1016/j.promfg.2021.07.019
Yang, C., Lan, S., Shen, W., Wang, L., & Huang, G. Q.
(2020). Software-defined Cloud Manufacturing with
Edge Computing for Industry 4.0. 2020 International
Wireless Communications and Mobile Computing,
IWCMC 2020, 1618–1623. https://doi.org/10.1109/
IWCMC48107.2020.9148467
IN4PL 2022 - 3rd International Conference on Innovative Intelligent Industrial Production and Logistics
152
