
Number of Attention Heads vs. Number of Transformer-encoders in
Computer Vision
Tomas Hrycej, Bernhard Bermeitinger
a
and Siegfried Handschuh
b
Institute of Computer Science, University of St. Gallen (HSG), St. Gallen, Switzerland
Keywords:
Computer Vision, Transformer, Attention, Comparison.
Abstract:
Determining an appropriate number of attention heads on one hand and the number of transformer-encoders,
on the other hand, is an important choice for Computer Vision (CV) tasks using the Transformer architec-
ture. Computing experiments confirmed the expectation that the total number of parameters has to satisfy the
condition of overdetermination (i.e., number of constraints significantly exceeding the number of parameters).
Then, good generalization performance can be expected. This sets the boundaries within which the number of
heads and the number of transformers can be chosen. If the role of context in images to be classified can be
assumed to be small, it is favorable to use multiple transformers with a low number of heads (such as one or
two). In classifying objects whose class may heavily depend on the context within the image (i.e., the meaning
of a patch being dependent on other patches), the number of heads is equally important as that of transformers.
1 INTRODUCTION
Architecture based on the concept of Transform-
ers became a widespread and successful neural net-
work framework. Originally developed for Nat-
ural Language Processing (NLP), it has been re-
cently also used for applications in Computer Vision
(CV) (Dosovitskiy et al., 2021).
The key concept of a Transformer is (self-) atten-
tion. The attention mechanism picks out segments (or
words, tokens, image patches, etc.) in the input data
that are building relevant context for a given segment.
This is done by means of segment weights assigned
according to the similarity between the segments. The
similarity assignment can be done within multiple at-
tention heads. Each of these attention heads evalu-
ates similarity in its own way, using its own similarity
matrices. All these matrices are learned through fit-
ting to training data. In addition to similarity matri-
ces, a transformer (-encoder) adds the results of atten-
tion heads and processes this sum through a nonlinear
perceptron whose weights are also learned. Trans-
former layers are usually stacked so that the output
of one transformer layer is the input of the next one.
Among the most important choices for implementing
a transformer-based processing system are
a
https://orcid.org/0000-0002-2524-1850
b
https://orcid.org/0000-0002-6195-9034
1. the number of attention heads per transformer-
encoder and
2. the number of transformer-encoders stacked.
The user has to select these numbers and the result
substantially depends on them but it is difficult to
make recommendations for these choices. Follow-
ing the general recommendation to avoid underdeter-
mined configurations (where the number of parame-
ters exceeds the number of constraints) and thus over-
fitting leading to poor generalization, there are still
two above-mentioned numbers to configure: approx-
imately the same number of network parameters can
be reached by taking more attention heads in fewer
transformer-encoders or vice versa. The decision in
favor of one of these alternatives may be substantial
for the success of the application. The goal of the
present work is to investigate the effect of both num-
bers on learning performance with the help of several
CV applications.
2 PARAMETER STRUCTURE OF
A MULTI-HEAD
TRANSFORMER
The parameters of a multi-head transformer (in the
form of only encoders and no decoders) consist of:
Hrycej, T., Bermeitinger, B. and Handschuh, S.
Number of Attention Heads vs. Number of Transformer-encoders in Computer Vision.
DOI: 10.5220/0011578000003335
In Proceedings of the 14th International Joint Conference on Knowledge Discovery, Knowledge Engineering and Knowledge Management (IC3K 2022) - Volume 1: KDIR, pages 315-321
ISBN: 978-989-758-614-9; ISSN: 2184-3228
Copyright
c
2022 by SCITEPRESS – Science and Technology Publications, Lda. All rights reserved
315

1. matrices transforming token vectors to their com-
pressed form (value in the transformer terminol-
ogy);
2. matrices transforming token vectors to the feature
vectors for similarity measure (key and query),
used for context-relevant weighting;
3. matrices transforming the compressed and
context-weighted form of tokens back to the
original token vector length;
4. parameters of a feedforward network with one
hidden layer;
All these matrices can be concatenated (e.g., column-
wise) to a single parameter-vector. Each transformer-
encoder contains the same number of parameters. The
total parameter count is thus proportional to the num-
ber of transformer-encoders. Varying the number of
heads affects the parameter count resulting from the
transformation matrices of the attention mechanism,
the remaining ones being the parameters of the feed-
forward network. The total parameter count is thus
less than proportional to the number of heads.
3 MEASURING THE DEGREE OF
OVERDETERMINATION
Fitting a parameterized structure to a data set can be
viewed as an equation system. M outputs to be fitted
for K training examples constitute MK equations. P
free parameters whose values are sought for the best
fit correspond to P variables. Consequently, we have
a system of MK equations with P variables. Since it
is not certain that these equations can be satisfied, it
is more appropriate to speak about constraints instead
of equations. In the case of linear constraints, there
are well-known conditions for solvability. Assuming
mutual linear independence of constraints, this sys-
tem has a unique solution if MK = P. The solution
is then exactly determined. With MK < P, the system
has an infinite number of solutions — it is underdeter-
mined. In the case of MK > P, the system is overde-
termined and cannot be exactly solved — the solution
is only approximate. One such solution is based on
the least-squares, i.e., minimizing the mean square er-
ror (MSE) of the output fit. Usually, the real system
on which the training data have been measured is as-
sumed to correspond to a model (e.g., a linear one)
with additional noise. The noise may reflect measure-
ment errors but also the inability of the model to de-
scribe the reality perfectly. It is desirable that the as-
sumed model is identified as exactly as possible while
fitting the parameters to the noise in the training set is
to be avoided. The latter requirement is justified by
the fact that novel patterns not included in the train-
ing set will be loaded by different noise values than
those from the training set. This undesirable fitting
to the training set noise is frequently called overfit-
ting. For exactly determined or underdetermined con-
figurations, the fit to the training set outputs including
the noise is perfect and thus overfitting is unavoid-
able. For overdetermined configurations, the degree
of overfitting depends on the ratio of the number of
constraints to the number of parameters. This ratio
can be denoted as
Q =
MK
P
(1)
For a model with a parameter structure corresponding
to the real system, it can be shown that the propor-
tion of noise to which the model is fitted is equal to
1
/Q. With increasing the number of training cases, this
number is diminishing, with a limit of zero. Asymp-
totically, the MSE corresponds, in the case of white
Gaussian noise, to the noise variance. In other words,
overfitting decreases with a growing number of train-
ing cases. The dependency of MSE on the number of
training samples is
E = σ
2
1 −
1
Q
= σ
2
1 −
P
MK
(2)
The genuine goal of parameter fitting is to receive
a model corresponding to the real system so that novel
cases are correctly predicted. The prediction error
consists of an imprecision of the model and the noise.
For a linear regression model, the former component
decreases with the size of the training set since the
term (X
0
X)
−1
determines the variability of estimated
model parameters (with X being the input data matrix)
develops with
c
1
/K. The prediction is a linear combi-
nation of model parameters that amount on average to
a constant c
2
. The noise component is inevitable —
its level is identical to that encountered in the train-
ing set (if both sets are representative of the statistical
population). The resulting dependency is, with con-
stants P and M,
E = c
2
σ
2
X
0
X
−1
+ σ
2
=
c
1
c
2
σ
2
K
+ σ
2
=
P
M
c
1
c
2
σ
2
Q
+ σ
2
= σ
2
c
Q
+ 1
(3)
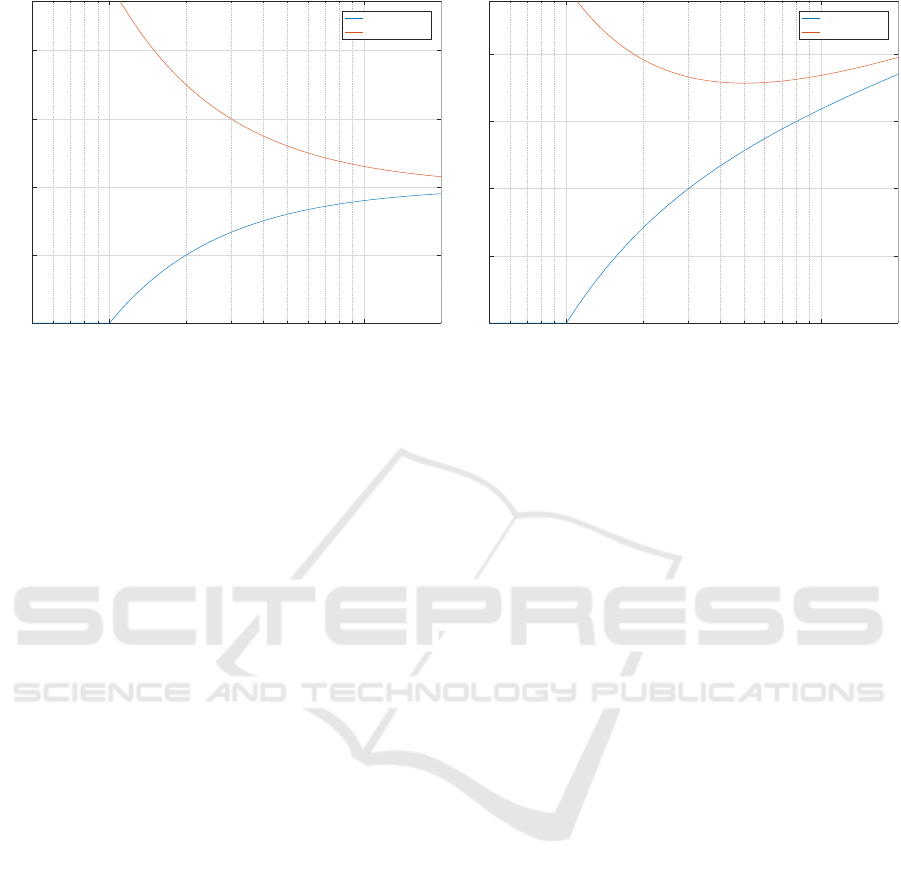
The shape of dependencies of training and test
set MSE is exemplified in fig. 1a. The coefficient of
determination on the x-axis varies as the number of
KDIR 2022 - 14th International Conference on Knowledge Discovery and Information Retrieval
316
10
0
10
1
0
0.5
1
1.5
2
Determination ratio Q=K*M/P
MSE
MSE training set
MSE test set
(a) Fixed parameter set, varying training set.
10
0
10
1
0
0.5
1
1.5
2
Determination ratio Q=K*M/P
MSE
MSE training set
MSE test set
(b) Fixed training set, varying parameter set.
Figure 1: Training and test set MSE in dependence on determination ratio.
training samples grows. The output dimension M and
the number of model parameters P are kept constant.
In summary, the MSEs for both the training set
and for the novel cases converge to the same level
determined by the variance of noise if the number
of training samples grows. The condition for this is
that the model structure is sufficiently expressive to
capture the input/output dependence of the real sys-
tem. With nonlinear systems, these laws can be ap-
proximately justified by means of linearization. Ad-
ditionally, nonlinear systems such as layered neural
networks exhibit dependencies between the parame-
ters, the best known of which are the permutations of
hidden layer units. In the Transformer architecture,
another source of redundancy are the similarity matri-
ces of the attention mechanism. This makes the num-
ber of genuinely free parameters P (as used above)
to be below the total number of parameters. However,
the number of free parameters is difficult to assess and
thus the total number can be used for a rough estimate
(or as an upper bound). Systems with Q > 1 are cer-
tain to be overdetermined while those with Q < 1 are
not necessarily underdetermined. Nevertheless, the
ratio Q is the best we have in practice.
Figure 1a corresponds to the situation where the
parameter set is kept constant while the size of the
training set varies. Frequently, the situation for choice
is inverse. There is a fixed training set and an ap-
propriate parameter set is to be determined. Varying
(in particular, reducing) the parameter set (and maybe
also the model architecture) will probably violate the
condition of the model being sufficiently expressive
to capture the properties of the real system. Reduc-
ing the parameter set represents an additional source
of estimation error — the model would not be able to
be perfectly fitted to training data even in the case of
zero noise. Then, the training and test set MSE will
develop with an additional term growing with ratio Q
(and decreasing P). The shape of this term is difficult
to assess in advance without knowledge of the real
system. The typically encountered dependence is de-
picted in fig. 1b (with arbitrary scaling of the MSE).
4 COMPUTING RESULTS
To show the contribution of the number of heads and
that of the number of transformer-encoders, a series
of model fitting experiments has been performed, for
several CV classification tasks. The data sets used
have been popular collections of images, frequently
used for various benchmarks. The data sets have been
chosen particularity for their match of determination
ratio for the experimental networks. Bigger data sets
are deliberately left out. For every task, a set of tasks
with various pairs (h,t), the number of heads being
h and the number of transformer-encoders being t,
have been optimized. Some combinations with high
numbers of both heads and transformer-encoders had
too many parameters and have thus been underdeter-
mined. The consequence has been a poor test set per-
formance. In the following, a cross-section of the re-
sults is presented:
• four transformer-encoders and any number of at-
tention heads;
• four attention heads and any number of
transformer-encoders.
These cross-sections contain mostly overdeter-
mined configurations with acceptable generalization
Number of Attention Heads vs. Number of Transformer-encoders in Computer Vision
317
properties. The performance has been measured by
mean categorical cross-entropy on training and test
sets (further referred to as loss). The x-axis of figs. 1
to 6 is the determination ratio Q of (eq. (1)), in log-
arithmic scale (so that the value 10
0
corresponds to
Q = 1). This presentation makes the dependence of
the generalization performance (as seen in the conver-
gence of the training and the test set cross-entropy)
on the determination ratio clear. This ratio grows
with the decreasing number of parameters, that is,
with the decreasing number of heads if the number
of transformer-encoders is kept to four and the de-
creasing number of transformer-encoders if the num-
ber of heads is kept to four. The rightmost configura-
tion is that with a single head or a single transformer-
encoder, respectively, followed to the left with two
heads or two transformer-encoders, etc..
The optimization was done exclusively with sin-
gle precision (float32) over a fixed number of 100
epochs by AdamW (Loshchilov and Hutter, 2019)
with a learning rate of 1 × 10
−3
and a weight decay
of 1 × 10
−4
. For consistency, the batch size was set to
256 for all experiments.
As a simple regularization during training, stan-
dard image augmentation techniques were applied:
random translation by a factor of (0.1,0.1), random
rotation by a factor of 0.2, and random cropping to
80 %.
The patches are flattened and their absolute posi-
tion is added in embedded form to each patch before
entering the first encoder.
All experiments were individually conducted on
one Tesla V100-SXM3-32GB GPU for a total number
of 60 GPU days.
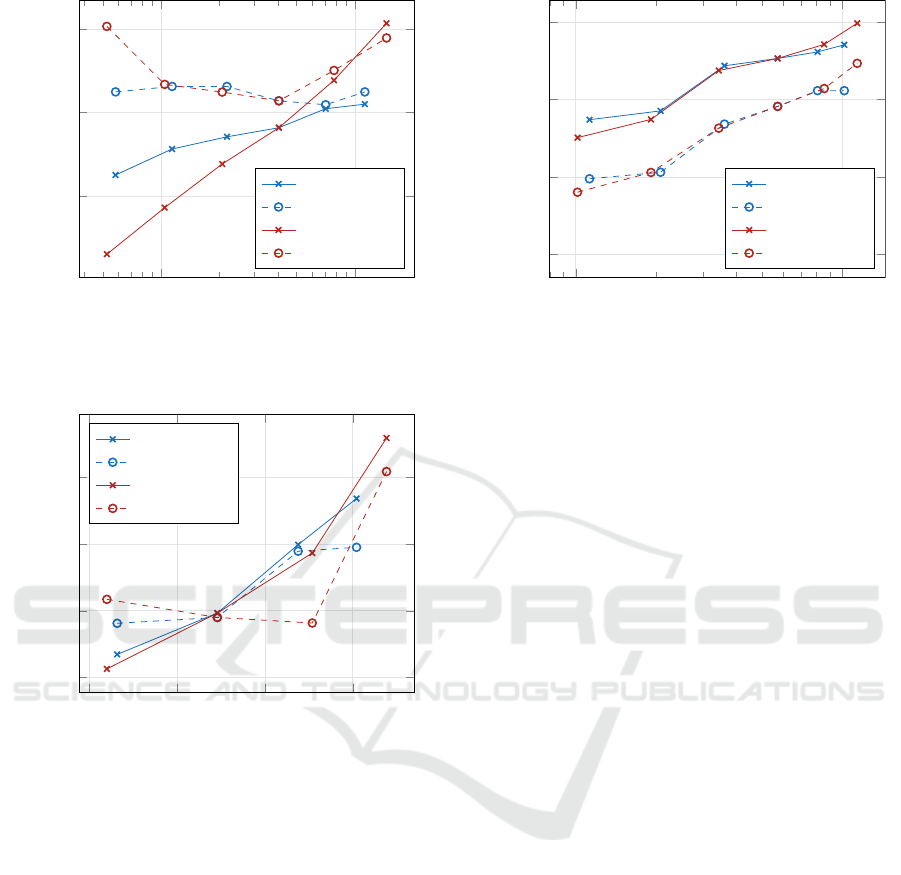
4.1 Dataset MNIST
The MNIST (Lecun et al., 1998) dataset consists of
pixel images of digits. All pairs (h,t) with number
of heads h ∈ {1,2,4, 8} and number of transformer-
encoders t ∈ {1,2,4,8} have been optimized. The re-
sults in the form of loss depending on the determina-
tion ratio Q are given in fig. 2.
The gray-scale images were resized to 32 ×32 and
the patch size was set to 2. All internal dimensions
(keys, queries, values, feedforward, and model size)
are set to 64.
The cross-entropies for the training and the test
sets are fairly consistent, due to the determination ra-
tio Q > 1. The results are substantially more sensi-
tive to the lack of transformer-encoders: the right-
most configurations with four heads but one or two
transformer-encoders have a poor performance. By
contrast, using only one or two heads leads only to a
10
0
10
0.2
10
0.4
10
0.6
10
0.8
0.2
0.4
Determination ratio Q =
KM
/P
Loss
TF = 4 train
TF = 4 test
HD = 4 train
HD = 4 test
Figure 2: Training and test set losses of model variants for
dataset MNIST.
moderate performance loss. In other words, it is more
productive to stack more transformer-encoders than to
use many heads. This is not surprising for simple im-
ages such as those of digits. The context-dependency
of image patches can be expected to be rather low and
to require only a simple attention mechanism with a
moderate number of heads.
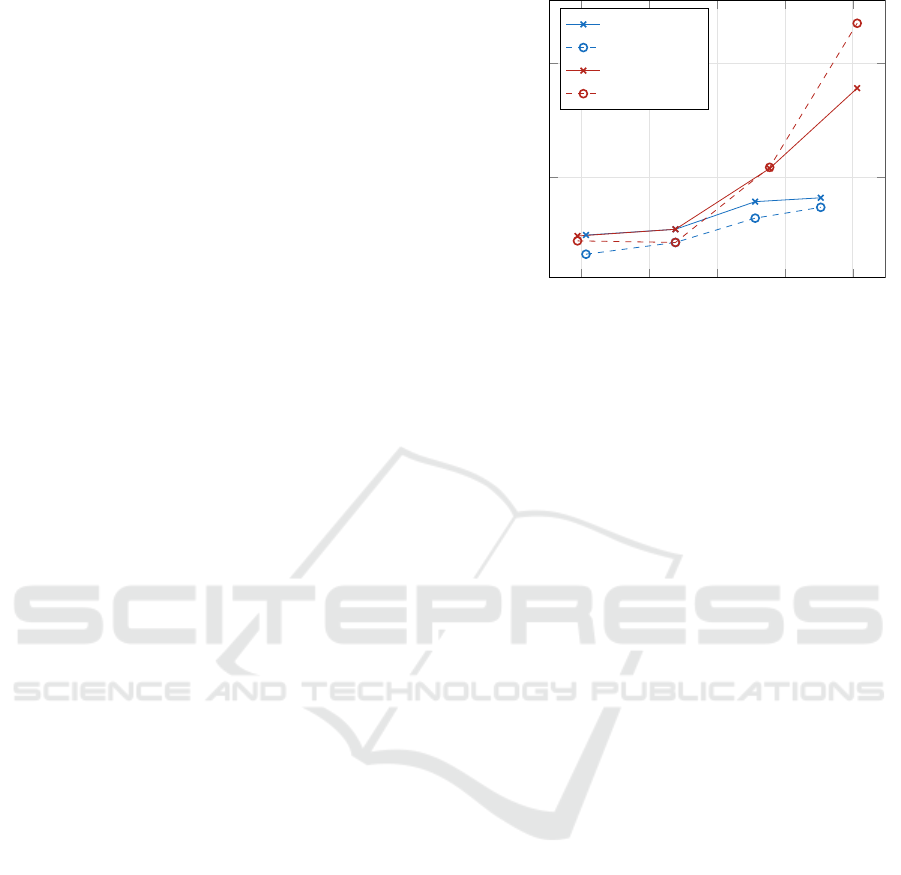
4.2 Dataset CIFAR-100
The dataset CIFAR-100 (Krizhevsky, 2009) is a col-
lection of images of various object categories such
as animals, household objects, buildings, people, and
others. The objects are labeled into 100 classes. The
training set consists of 50,000, the test set of 10,000
samples. With M = 100 and K = 50 000, the deter-
mination coefficient Q is equal to unity (100 on the
plot x-axis) for 5 million free parameters (M × K).
The results are given in fig. 3. All pairs (h,t) with
number of heads h ∈ {1,2, 4,8,16,32} and number of
transformer-encoders t ∈ {1, 2,4,8,16,32} have been
optimized.
The colored images were up-scaled to 64×64 and
the patch size was set to 8. All internal dimensions
(keys, queries, values, feedforward, and model size)
are set to 128.
The cross-entropies for the training and the test
sets converge to each other for about Q > 4, with a
considerable generalization gap for Q < 1. This can
be expected taking theoretical considerations men-
tioned in section 3 into account. The results are more
sensitive to the lack of transformer-encoders than to
that of heads. How far a high number of transformer-
encoders would be helpful, cannot be assessed be-
cause of getting then into the region of Q < 1. With
this training set size, a reduction of some transformer
KDIR 2022 - 14th International Conference on Knowledge Discovery and Information Retrieval
318
10
0
10
1
2
2.5
3
Determination ratio Q =
KM
/P
Loss
TF = 4 train
TF = 4 test
HD = 4 train
HD = 4 test
Figure 3: Training and test set losses of model variants for
dataset CIFAR-100.
10
0.8
10
1
10
1.2
10
1.4
3.7
3.8
3.9
4
Determination ratio Q =
KM
/P
Loss
TF = 4 train
TF = 4 test
HD = 4 train
HD = 4 test
Figure 4: Training and test set losses of model variants for
dataset birds.
parameters such as key, query, and value width would
be necessary.
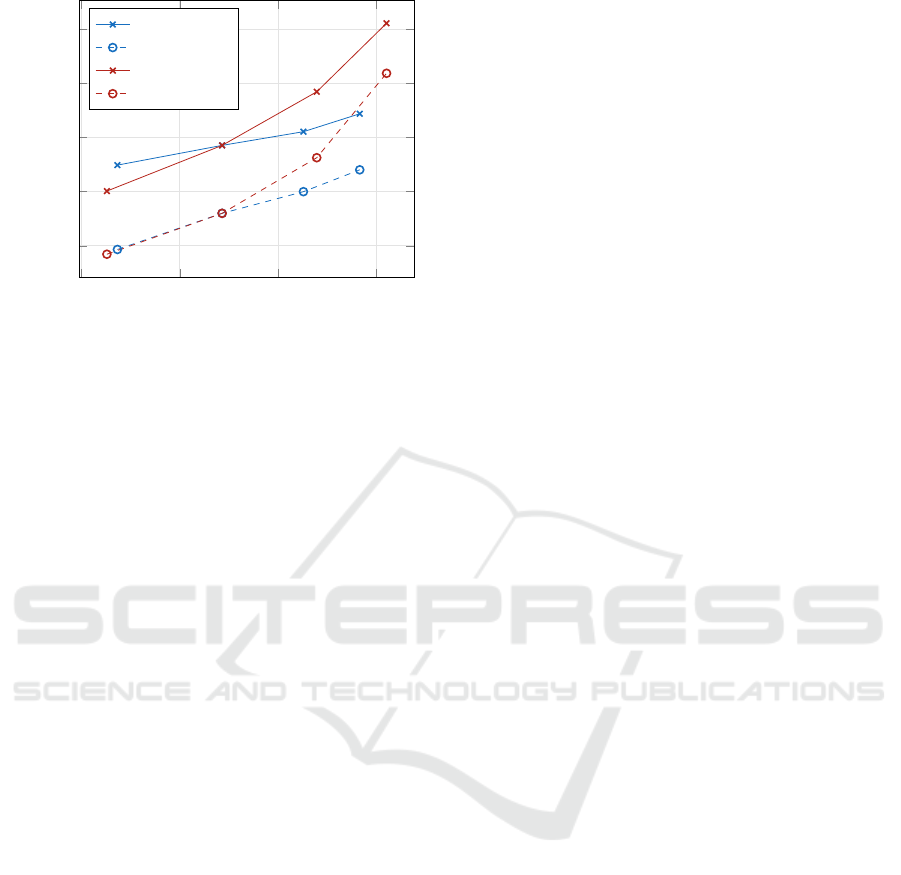
4.3 Dataset CUB-200-2011
The training set of the dataset CUB-200-2011 (Wah
et al., 2011) (birds) used for the image classification
task consists of 5,994 images of birds of 200 species.
All pairs (h,t) with number of heads h ∈ {1,2, 4,8}
and number of transformer-encoders t ∈ {1,2, 4,8}
have been optimized (fig. 4).
The colored images were resized to 128×128 and
the patch size was set to 8. All internal dimensions
(keys, queries, values, feedforward, and model size)
are set to 32.
The cross-entropies for the training and the test
sets are mostly consistent due to the high determina-
tion ratio Q. There are relatively small differences
10
3
10
4
3.5
4
4.5
5
Determination ratio Q =
KM
/P
Loss
TF = 4 train
TF = 4 test
HD = 4 train
HD = 4 test
Figure 5: Training and test set losses of model variants for
dataset places.
between small numbers of heads and transformer-
encoders. Both categories seem to be compara-
ble. This suggests, in contrast to the datasets treated
above, a relatively large contribution of context to the
classification performance — multiple heads are as
powerful as multiple transformer-encoders. This is
not unexpected in the given domain: the habitat of the
bird in the image background may constitute a key
contribution to classifying the species.
4.4 Dataset Places365
The training set of dataset places365 (Zhou et al.,
2018) consists of 1,803,460 images of various places
in 365 classes (fig. 5). Pairs (h,t) with num-
ber of heads h ∈ {1,2, 4,8, 16,32} and number of
transformer-encoders t ∈ {1, 2,4,8,16,32} have been
optimized.
The colored images were resized to 128×128 and
the patch size was set to 16. All internal dimensions
(keys, queries, values, feedforward, and model size)
are set to 32.
The cross-entropies for the training and the test
sets are parallel. Surprisingly, test set losses are lower
than those for the training set. This can be caused
by an inappropriate test set containing only easy-to-
classify samples. The reason for this training to test
consistency is the very high determination ratio Q
(over 1,000). This would allow even larger num-
bers of transformer-encoders and heads without worry
about generalization, with a corresponding high com-
puting expense.
There are hardly any differences between variants
with varying heads and those varying transformer-
encoders. With a given total number of parameters
(and thus a similar ratio Q), both categories seem to be
Number of Attention Heads vs. Number of Transformer-encoders in Computer Vision
319
10
3.2
10
3.4
10
3.6
10
3.8
5
5.2
5.4
5.6
5.8
Determination ratio Q =
KM
/P
Loss
TF = 4 train
TF = 4 test
HD = 4 train
HD = 4 test
Figure 6: Training and test set losses of model variants for
dataset imagenet.
equally important. It can be conjectured that there is
a relatively strong contribution of context to the clas-
sification performance can be assumed.
4.5 Dataset Imagenet
The training set of the popular imagenet (Krizhevsky
et al., 2012) dataset contains 1,281,167 images of
1,000 different classes of current everyday objects
(like airplanes, cars, different types of animals, etc.)
For this dataset, the pairs (h,t) with number of
heads h ∈ {1,2,4,8} and number of transformer-
encoders t ∈ {1, 2,4,8} have been optimized.
Analog to the places experiment, the colored im-
ages were resized to 128×128 and the patch size was
set to 16. All internal dimensions (keys, queries, val-
ues, feedforward, and model size) are set to 64.
For this experiment, it can be seen in the deter-
mination ratios in fig. 6 that it behaves similarly to
the dataset places (in fig. 5). Again, the test loss is
consistently lower than the training loss. The low-
est cross-entropies are comparable which means, ana-
log to places, that increasing the number of attention
heads and the number of transformer-encoder layers
is beneficial to the performance. Compared to the
other experiments, the determination ratio is very high
(10
3
to 10
4
) which means that the number of parame-
ters in the classification network is too small and even
larger stacks of transformer-encoders with more at-
tention heads could decrease the loss even further.
Looking at the varying number of attention heads,
it can be seen that their number has a low impact on
the performance.
5 CONCLUSIONS
Determining the appropriate number of self-attention
heads on one hand and, on the other hand, the number
of transformer-encoder layers is an important choice
for CV tasks using the Transformer architecture.
A key decision concerns the total number of pa-
rameters to ensure good generalization performance
of the fitted model. The determination ratio Q, as de-
fined in section 3, is a reliable measure: values signif-
icantly exceeding unity (e.g., Q > 4) lead to test set
loss similar to that of the training set. This sets the
boundaries within which the number of heads and the
number of transformer-encoders can be chosen.
Different CV applications exhibit different sensi-
tivity to varying and combining both numbers.
• If the role of context in images to be classified
can be assumed to be small, it is favorable to
“invest” the parameters into multiple transformer-
encoders. With too few transformer-encoders, the
performance will rapidly deteriorate. Simultane-
ously, a low number of attention heads (such as
one or two) is sufficient.
• In classifying objects whose class may heavily de-
pend on the context within the image (i.e., the
meaning of a patch being dependent on other
patches), the number of attention heads is equally
important as that of transformer-encoders.
This seems to be consistent with other experi-
ments like (Li et al., 2022) where the optimal number
of attention heads depends on the dataset.
Future Work. Although this study provides a sys-
tematic comparison between the number of atten-
tion heads and number of consecutive transformer-
encoders, the sheer number of different hyperparam-
eters is still underrepresented. The hyperparameters
in this study were chosen for the task at hand, e.g. the
patch size was chosen accordingly to the input image
size. However, the patch size is on its own a crucial
hyperparameter which might lead to different results
if chosen differently. Any of the listed hyperparame-
ters in the experiments (section 4) need the same sys-
tematic analysis as the current study. This is left out
for future work.
REFERENCES
Dosovitskiy, A., Beyer, L., Kolesnikov, A., Weissenborn,
D., Zhai, X., Unterthiner, T., Dehghani, M., Min-
derer, M., Heigold, G., Gelly, S., Uszkoreit, J., and
Houlsby, N. (2021). An image is worth 16x16 words:
KDIR 2022 - 14th International Conference on Knowledge Discovery and Information Retrieval
320

Transformers for image recognition at scale. In In-
ternational Conference on Learning Representations,
page 21, Vienna, Austria.
Krizhevsky, A. (2009). Learning Multiple Layers of Fea-
tures from Tiny Images. Dataset, University of
Toronto.
Krizhevsky, A., Sutskever, I., and Hinton, G. E. (2012). Im-
ageNet Classification with Deep Convolutional Neu-
ral Networks. In Advances in Neural Information Pro-
cessing Systems, volume 25. Curran Associates, Inc.
Lecun, Y., Bottou, L., Bengio, Y., and Haffner, P. (1998).
Gradient-based learning applied to document recogni-
tion. Proceedings of the IEEE, 86(11):2278–2324.
Li, F., Li, S., Fan, X., Li, X., and Chang, H. (2022). Struc-
tural Attention Enhanced Continual Meta-Learning
for Graph Edge Labeling Based Few-Shot Remote
Sensing Scene Classification. Remote Sensing,
14(3):485.
Loshchilov, I. and Hutter, F. (2019). Decoupled Weight De-
cay Regularization. 1711.05101.
Wah, C., Branson, S., Welinder, P., Perona, P., and Be-
longie, S. (2011). The Caltech-UCSD Birds-200-2011
Dataset. Dataset CNS-TR-2011-001, California Insti-
tute of Technology, Pasadena, CA.
Zhou, B., Lapedriza, A., Khosla, A., Oliva, A., and Tor-
ralba, A. (2018). Places: A 10 Million Image
Database for Scene Recognition. IEEE Transac-
tions on Pattern Analysis and Machine Intelligence,
40(6):1452–1464.
Number of Attention Heads vs. Number of Transformer-encoders in Computer Vision
321
