
Predictive Model of the Organization of Car Maintenance and Repair
Wagons using the Smoothing Algorithm the Extrapolation Method
Guzal Bubnova
Ural State University of Railway Transport, Yekaterinburg, Russia
Keywords: Railway carriage, technical maintenance, current repairs, dynamic series, extrapolation method, decision-
making structure.
Abstract: When developing a predictive organizational model for the maintenance and repair of railcars at large
marshalling yards, we take into account the multi-factor composition of variable values, many of which
should be within the required values without disrupting the order and activity of the transportation process.
In such cases, additional justification is required for the technical decisions taken to ensure normal and safe
operating conditions. The article provides a methodology for substantiating technical solutions for
improving the organization of car maintenance by determining forecast values for a given time interval. The
list of measures to improve the system within the framework of the selected factor is considered: installation
of floor-standing equipment in the form of an additional service channel for monitoring the sub-car space,
installation of SPIDER-type diagnostic equipment to provide an assessment of the technical condition of the
car according to external parameters. The effectiveness of implemented measures was evaluated.
1 INTRODUCTION
Along with the increased demand for freight
transportation, there was a problem associated with
the development of a set of tasks, the solution of
which will optimize the operation and increase the
efficiency of the use and operation of railcars. One
of these tasks is the development of up-to-date
regulatory and technical documentation for the
design of maintenance and repair technology. The
analytical solution of the problem is complex
(Zubkov, 2022; Zubkov, 2022; Zubkov, 2022;
Pershin, 2021), and in some cases is hardly feasible.
Modern approaches to solving such problems
actively use numerical modeling methods, in
particular the extrapolation method (Yushkova,
2021; Galkin, 2021; Zubkov, 2021; Zubkov, 2021;
Kamaretdinova, 2020). The article describes the
process describing the dynamics of restoring the
service life of railcars in the framework of
maintenance and repair of freight cars with various
types of technical malfunctions. The restoration
process consists of preliminary decisions on the
regulations and content of the necessary work to be
performed in order to increase the efficiency of
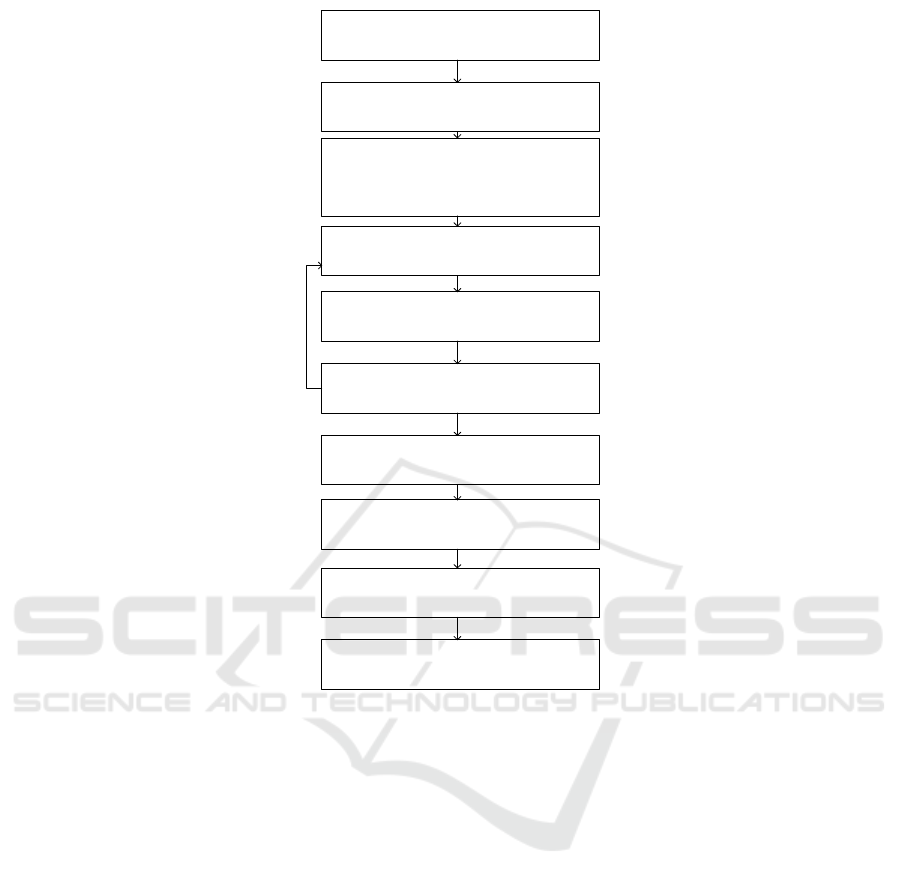
production of the car industry. A unified and adapted
structural model for decision-making development is
presented in figure 1.
The description of each block according to the
scheme shown in Figure 1 is defined as follows:
Block 1 is responsible for forming an
informative block that includes the results of an
analysis of situations that arise in the divisions of the
car industry with a problem statement based on the
multi-factor structure of events that occur, for
example, at the point of maintenance and current
uncoupling repairs.
Block 2 is aimed at forming a target function
with setting critical parameters and conditional
restrictions, for example, increasing the efficiency of
production of restoring the technical resource of
wagons in conditions of limited time and parameters
of maintenance and repair.
Block 3 determines the performance of work
related to the collection and analysis and
identification of the informative component of the
car farm division, as well as operational processing
of the obtained statistical data with subsequent
evaluation using known methods, for example,
extrapolation and fixing the distribution law of a
random variable, in order to predict the time interval
for the desired period under given conditions.
Block 4 based on the forecast values of the
324
Bubnova, G.
Predictive Model of the Organization of Car Maintenance and Repair Wagons using the Smoothing Algorithm the Extrapolation Method.
DOI: 10.5220/0011584700003527
In Proceedings of the 1st International Scientific and Practical Conference on Transport: Logistics, Construction, Maintenance, Management (TLC2M 2022), pages 324-330
ISBN: 978-989-758-606-4
Copyright
c
2023 by SCITEPRESS – Science and Technology Publications, Lda. Under CC license (CC BY-NC-ND 4.0)
multi-factor component of the car industry divisions,
a selection of the most dangerous factors affecting
the reduction of production efficiency is made.
Block 5 processes the obtained indicators in
block 4 by superimposing them on the mathematical
model of queuing with the introduction of variable
values, coefficients of alignment of future indicators
for a given time interval.
Block 6 evaluates alternative solutions based on
the model. Thus, the inverse problem of finding
effective tools for influencing current indicators is
solved, and a stochastic value of possible deviations
from the desired target function is laid. If the desired
indicators remain unchanged from the initially set
forecast parameters, the process returns to block 4.
The cycle of this process is repeated until the target
function is reached to the desired state.
Block 7 selects the optimal set of influence
coefficients, which ultimately determines the
optimal strategy for a given criterion.
Block 8 at the stage of the current block, using
expert assessment methods, the manager makes a
number of strategic decisions to choose the optimal
one, among the indicate dones. In some cases that
are particularly dangerous to security and cost-
effective, a pre-completion block is performed
aimed at developing a pilot project with an
assessment of bottlenecks.
Block 9 performing organizational and technical
work to implement the selected (from block 8)
strategic solution.
Block 10 performing an evaluation of the result
obtained that meets the criteria of economic
efficiency and safety criteria.
Based on the above, to assess the impact of
maintenance and repair on the technical condition of
rolling stock when performing work, the
extrapolation method and the queuing method were
used for predictive assessment and indicative
assessment, respectively. The article uses blocks 1-3,
so that the calculation is performed in the Excel
software package.
After setting the problem and determining the
goal of the solution, an important component of the
1. Analysis of the situation and formulation
of the problem in the organization of
production in the wagon economy
2. Determination of the purpose, criteria and
limitations in the process of repair and
maintenance of wagons
3. Collection, analysis and forecast of
information based on the parameters of the
production of restoring the resources of
wagons
5. Process modeling, research of operations
related to the restoration of the resource of
wagons
6. Evaluation of alternatives according to the
model in the organization of production in
the wagon economy
7. Choosing the optimal strategy according
to a given criterion of the process of
restoring the resource of wagons
8. Acceptance by the head of the final
decision in the organization of production in
the wagon farm
9. Organization of the implementation of the
decision taken in the organization of
production in the wagon farm
10. Evaluation of the result obtained in the
organization of production in the wagon
farm
4. Drawing up a list of alternatives in the
organization of production in the wagon
economy
Fi
g
ure 1: Decision makin
g
scheme.
Predictive Model of the Organization of Car Maintenance and Repair Wagons using the Smoothing Algorithm the Extrapolation Method
325

process of finding optimal strategies (strategic
decision) is the collection, analysis and forecasting
of information (block 1-3).
The main forecasting methods used in the railcar
industry are methods based on dynamic series. A
dynamic series is a sequence of numerical values
that characterize changes in a process over time.
When analyzing the dynamics series, statistical data
collected over a certain period of time are used to
determine the nature of the direction and intensity of
quantitative changes in processes. Distinguish
between the level of a series and a trend. Row level
– a member of the dynamics row. Trend – the main
deterministic trend of process change. The levels of
a series are considered as random variables that
change over time depending on the main and
random factors.
Forecasting – determining the probable state of
the process in the future. It is complicated by the
presence of areas of gradual, evolutionary
development, areas of abrupt, revolutionary
development, and factors that cause actual levels to
deviate from the trend. In forecasting, the process of
changing a variable is expressed by a general model:
()
() (),yt ft t
ε
=+
(1)
where
()
yt
is the production parameter under
study (the volume of production of cars with
maintenance and/or PTOR, the volume of cars that
have passed maintenance, etc.);
()
f
t
- trend, regular component.
()t
ε
- random component.
Trends are determined by numerous methods:
extrapolation method, queuing method, etc.
Extrapolation is understood as the spread of patterns,
relationships and relationships that operate in the
studied (past) period, beyond its limits (in the
future). The queuing method is understood as a
closed system with its existing service channels
(personnel, equipment, etc.) that perform the main
list of works and requests received for service
(products, rolling stock, visitors, etc.) with which or
on which work is being carried out to restore the
resource and other types of work that resemble
maintenance.
2 MATERIALS AND METHODS
2.1 Initial Data
One-step smoothing algorithm
1. The original dynamic series is formed from
statistical data for a certain period of time and
recorded as a table. We will conduct a study
of the implementation of forecasting changes
in the performance of maintenance and repair
at the point then the current uncoupling repair.
Related data are available for the period from
2019-2021 -2021 г.г, Table 1.
2. In accordance with the experimental data, one
or more functions are selected for the
procedure of smoothing equations.
Experimental data show that labor
productivity changes with time in an
approximately linear manner. Therefore, we
choose a linear function of the form 2 as a
model for smoothing and forecasting:
()
01
,vt a at=+
(2)
2.2 Design Equations and Boundary
Conditions
We determine the numerical values of the regression
coefficient estimates by forming systems of normal
equations using the least squares method. For this
purpose, we substitute the parameter ỹ(t) in equation
2 instead of the parameter ỹ (t).
As a result, we get:
2
2
1
2222
010011
1
(2 )
(2 2 2 )min.
n
î
iii
t
n
ii i
t
Fvvvv
v va vat a a at a t
=
=
=−+=
−− ++ +
To find the extremum of the function, we equate
the first partial derivatives of the objective function
with respect to the corresponding unknowns to zero,
obtaining a system of normal equations for finding
the unknowns a
0
, a
1
01
11
0
2
11
111
1
0, ;
0, .
nn
i
tt
nnn
i
ttt
F
na a t v
a
F
atat yt
a
==
===
∂
=+=
∂
∂
=+=
∂
To solve this system of equations, we apply the
matrix method X=A
1
B
where
1
11
1
1
11 1
,,.
nn
i
tt
nn n
tt t
nt y
a
AB
a
tyt vt
λ
==
== =
== =
TLC2M 2022 - INTERNATIONAL SCIENTIFIC AND PRACTICAL CONFERENCE TLC2M TRANSPORT: LOGISTICS,
CONSTRUCTION, MAINTENANCE, MANAGEMENT
326
The solution of the system was carried out using
Excel software tools.
3 RESULTS AND DISCUSSION
As a result of the calculation using the method
described above, prediction distributions are
obtained using the extrapolation method. Figure 2
shows an example of the distribution of the forecast
estimate of failures in the technical condition of
railcars in the period from 2019-2021.
Calculations show that the forecast estimate of
the output of cars with technical malfunctions does
not exceed the indicator of more than 450 cars per
year. Table 4 shows the results of calculating the
projected number of railcars released from the TOP
for the period from 2022 to 2027. figure 3.
Let's make a simulation based on Table the
values of estimated factors specified in Table 1for
the period from 2019-2021.we get the following
results:
To solve this system of equations, the matrix
method X=A
1
B is applied
where
36
.
614
A
=
The values of the vector of free values X for
matrix B are presented in Table 2.
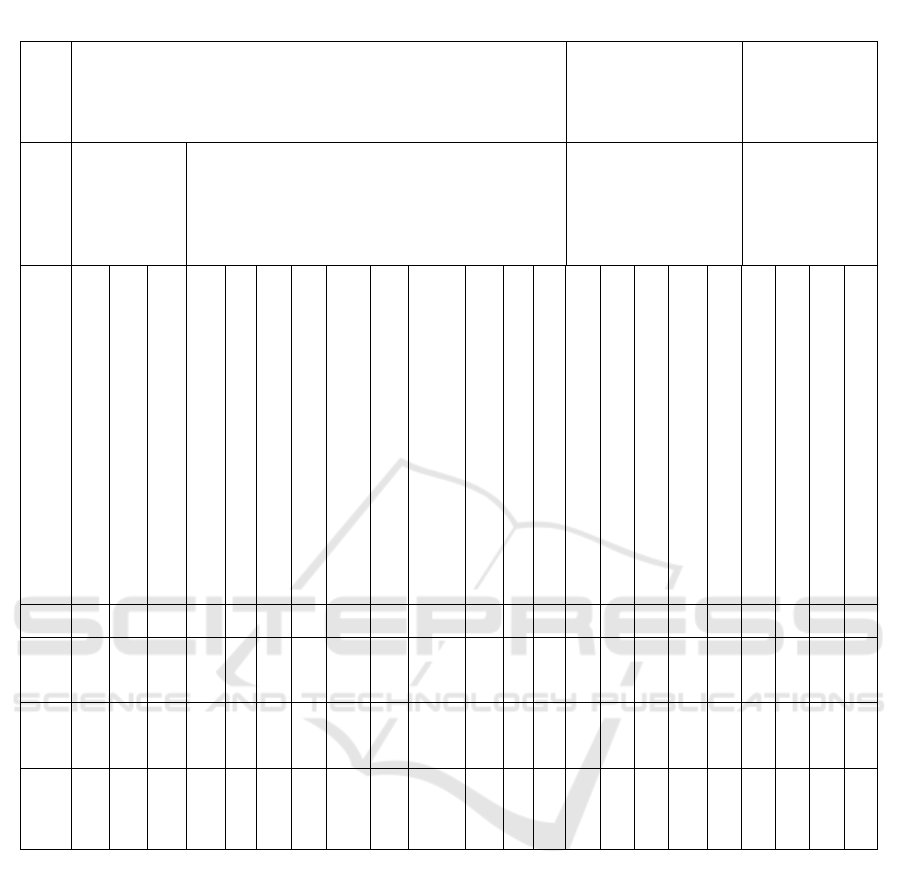
Table 1: Dynamic series for restoring the service life of faulty railcars
Map items
Rolling stock Enlarged car units Details of railcars
Time intervals
Restoration of
the technical life
of railcars in the
amount of
unplanned
repairs
Trouble shooting of rolling stock components
Digressions in current
uncoupling repair of
wagons of enlarged car
elements
Digressions in
current uncoupling
repair of wagons of
the running parts of
the car
Indicators that determine
the degree of development of factors
Number of defective freight cars in BOR
Number of defective freight cars in TR-1
Number of defective freight cars in TR-12
Disabled brakes restored
Replaced sets of air distributors
Replaced auto
modes Replaced autoregulators
Replaced рукавовR-17 hoses
Replaced end and release valves
Replaced brake pads
Replaced details auto coupler parts
Adjusting the brake lever gear
Other malfunctions
Bodywork
Frame
Auto coupler
Running gear
Brake system
Box node
Wheel crack
Side frame cracks/defects
Over the Spring beam crack
Year 1 2 3 4 5 6 7 8 9 10 11
1
2
1
3
1
4
1
5
1
6
17
1
8
1
9
2
0
2
1
2
2
2019
45
5
67
9
34
3
6
20
0
98
6
6
5
2
1
8
2
3
201
21
1
17
267
39
7
5
8
4
3
2
7
9
6
3
8
2
1
1
3
12
5
6 1 1 1
1
1
2020
42
8
15
8
66
7
6
24
6
69
9
1
9
8
9
1
7
284
29
9
25
883
57
8
7
9
8
5
3
4
1
4
3
9
1
4
2
4
21
7
6 1 2 3 0
2021
37
7
84
8
58
4
4
93
2
26
9
1
1
7
1
0
7 407
43
0
38
806
84
8
1
1
1
9
7
4
3
4
1
4
1
2
4
6
94
5
6
3
1
5
2
9
2
1
Predictive Model of the Organization of Car Maintenance and Repair Wagons using the Smoothing Algorithm the Extrapolation Method
327

Figure 2: Results of calculating the dynamic series of the distribution of body part failures: top - in the period from
2019-2021-2021 г.г.; bottom-forecast for the period from 2022-2029.
Table 2: Calculated values of unknowns
i
y
1
261
685
1
594
17
378
1
954
967 3
7
4
7
89
2
94
0
81
956
1
82
3
25
025
10
551
1
1
8
3
7
8
3
4
3
6
6
8
5 1
8
3
3
3
2
v
t
2
445
539
3
429
33
488
3
191
1
399
6
6
7
8
1
99
0
2
09
9
185
451
4
09
7
55
404
22
647
2
3
9
5
5
1
9
9
8
4
1
1
8
6
1
2
5
0
9
4
7
4
a 498
392
290 7060 136
8
857 2
0
3
2
91 94 5779 15
6
298
7
197
2
3
6
3
1
-
5
1
7
6
-
2
7
-
0
-
8
-
1
7
1
a
1
-
389
120 -634 -
358
-
267
-
4
-
8
10
3
10
9
1076
9
22
5
267
7
773 2 -
1
1
7
-
1
2
5
1 7 1
4
5
y = 1,5x + 36,333
R² = 0,9643
36
36,5
37
37,5
38
38,5
39
39,5
40
40,5
41
41,5
123
Efficiency, private carriages./person yi
Time, T
Forecast of the retreat in the repair of the car body
Fact
Line (fact)
y = 1,5x + 36,333
R² = 1
35
36
37
38
39
40
41
42
43
44
45
46
47
48
49
50
12345678
Efficiency, private carriages./person yi
Time, T
Forecast of the retreat in the repair of the railway car body
Fact
Line (Fact)
TLC2M 2022 - INTERNATIONAL SCIENTIFIC AND PRACTICAL CONFERENCE TLC2M TRANSPORT: LOGISTICS,
CONSTRUCTION, MAINTENANCE, MANAGEMENT
328
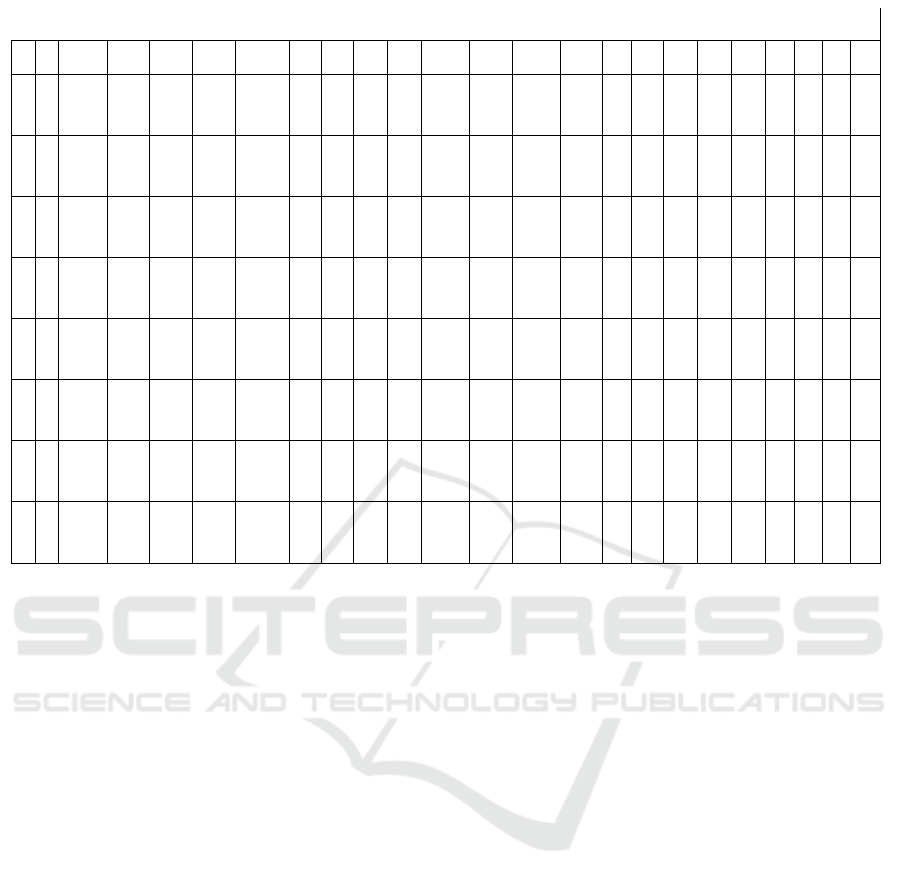
The obtained values form exponents of a
polynomial that allow us to determine the linear
distribution law of a random variable for each factor
indicated in Table 1.
Thus, it is possible to estimate the influence of
the factor on the technical condition of rolling stock
for several years in advance, the results obtained
according to linear distribution laws СВ They are
represented by Table 3.
Negative values in the tables indicate the absence
of a factor for the specified parameters of treatment
and repair of compositions, values that increase over
time in dynamics indicate the need to evaluate
alternatives according to the model.
Further studies are the implementation of blocks
4-10, the research consists in the selection of factors
that expose the organization of production of repair
and maintenance of wagons in the forecast interval
to a decrease in the efficiency of divisions. The
obtained values will be used as variable values
embedded in the mathematical queuing model, as
well as equalization coefficients for future indicators
for the period from 2023-2029. The model will be
aimed at identifying the values of possible
deviations from the desired objective function, the
purpose of which is to select the optimal set of
influence coefficients that do not threaten safety and
economic efficiency according to the decision made.
4 CONCLUSION
Based on the results of the work performed, the
following conclusions can be drawn:
1. It is revealed, that the basis of production
management in a car maintenance depot is to
make a strategic decision.
2. It is determined, that a strategic decision
consists of a number of proactive measures
combined into a decision-making scheme.
3. It is established that one of the first stages of
numerical evaluation of proactive impacts on
decision-making in the production organization
is a forecast.
4. It is determined that the forecast estimation is
performed using methods of extrapolation of
data-based indicators of the queuing method to
the HFE.
5. It is revealed that the forecast estimate for the
next five years does not exclude the need to
make a decision on increasing the capacity of
the station with the introduction of modern
maintenance and repair technologies.
Table 3: Forecast values
t 1 2 3 4 5 6 7 8 9 10 11 12 13 1
4
1
5
1
6
1
7
1
8
1
9
2
0
2
1
2
2
1
459
477
411
6 427
1 010
590
16
24
194
204
16
549
382
5 665
2 745
38
22
11
161
-2
1
-1
-3
6
2
420
562
531
5 793
651
322
12
16
297
313
27
319
608
8 342
3 517
39
12
28
145
23
2
6
11
11
3
381
646
652
5 159
293
55
8
8
400
423
38
088
833
11
019
4 290
41
3
44
130
48
3
13
25
16
4
342
731
772
4 525
-66
-213
4
0
503
532
48
858
1 059
13
696
5 062
42
-7
61
114
73
4
20
39
21
5
303
815
893
3 891
-424
-480
0
-8
606
642
59
627
1 284
16
373
5 835
44
-16
77
99
98
5
27
53
26
6
264
900
1 013
3 257
-783
-748
-4
-16
709
751
70
397
1 510
19
050
6 607
45
-26
94
83
123
6
34
67
31
7
225
984
1 134
2 623
-1 141
-1 015
-8
-24
812
861
81
166
1 735
21
727
7 380
47
-35
110
68
148
7
41
81
36
8
187
069
1 254
1 989
-1 500
-1 283
-12
-32
915
970
91
936
1 961
24
404
8 152
48
-45
127
52
173
8
48
95
41
Predictive Model of the Organization of Car Maintenance and Repair Wagons using the Smoothing Algorithm the Extrapolation Method
329

REFERENCES
Zubkov, V., Sirina, N., 2022. Influence of transport
process participants on the quality of transport services
med. j. Safety in Aviation and Space
Technologies. Select Proceedings of the 9th World
Congress "Aviation in the XXI Century". Cham. 1(1).
pp. 301-310.
Zubkov, V., Sirina, N., 2022. Automation of cargo
correspondences in railway-water communication.
Lecture Notes in Civil Engineering. Cham. 1(180). pp.
405-416.
Zubkov, V., Sirina, N., 2022. Information and intelligent
models in the management of transport and logistics
systems. Lecture Notes in Civil Engineering. Cham.
1(180). pp. 433-445.
Pershin, V., Zubkov, V., Sirina, N., 2021. Public-private
partnership as a factor in the development of the
metropolitan transport system. AIP Conference
Proceedings. Сер. "Proceedings of the Scientific
Conference on Railway Transport and Engineering,
RTE 2021". 020005.
Yushkova, S., Sirina, N., 2021. Polygon principles for
integrative digital rail infrastructure management.
Transportation research procedia. Сер. "International
scientific siberian transport forum, Transsiberia
2020". p. 208-219.
Galkin, A., Zubkov, V., Sirina, N., 2021. M.
Transportation Research Procedia. "International
Scientific Siberian Transport Forum, TransSiberia
2020". pp. 228-235.
Zubkov, V., Sirina, N., 2021. Transport services
management on transport and logistic methods.
Transportation research procedia. "International
scientific siberian transport forum, transsiberia 2020".
p. 263-273.
Zubkov, V., Sirina, N., 2021. Polygon principles for
integrative digital rail infrastructure management.
Transportation research procedia. 54. p. 208.
Kamaretdinova, G., Sirina, N., 2020. The program for
simulation modeling of the process of maintenance of
freight cars at the interstate butt point (PIM PTO GV
MGSP). Certificate of registration of the computer
program ru 2020610967, 01/22/2020. Application No.
2020610116 dated 01/09/2020.
TLC2M 2022 - INTERNATIONAL SCIENTIFIC AND PRACTICAL CONFERENCE TLC2M TRANSPORT: LOGISTICS,
CONSTRUCTION, MAINTENANCE, MANAGEMENT
330
