
Characterizing Open Government Data Available on the Web from the
Quality Perspective: A Systematic Mapping Study
Rafael Chiaradia Almeida
a
, Glauco de Figueiredo Carneiro
b
and Edward David Moreno
c
Programa de P
´
os-Graduac¸
˜
ao em Ci
ˆ
enc¸ia da Computac¸
˜
ao (PROCC), Federal University of Sergipe (UFS),
Sao Cristovao, Sergipe, Brazil
Keywords:
Open Government Data, Systematic Mapping, Data Quality Evaluation.
Abstract:
Context: Data openness can create opportunities for new and disruptive digital services on the web that has
the potential to benefit the whole society. However, the quality of those data is a crucial factor for the success
of any endeavor based on information made available by the government. Objective: Analyze the current
state of the art of quality evaluation of open government data available on the web from the perspective of
discoverability, accessibility, and usability. Methods: We performed a systematic mapping review of the
published peer-reviewed literature from 2011 to 2021 to gather evidence on how practitioners and researchers
evaluate the quality of open government data. Results: Out of 792 records, we selected 21 articles from the
literature. Findings suggest no consensus regarding the quality evaluation of open government data. Most
studies did not mention the dataset´s application domain, and the preferred data analysis approach mainly
relies on human observation. Of the non-conformities cited, data discoverability and usability outstand from
the others. Conclusions: There is also no consensus regarding the dimensions to be included in the evaluation.
None of the selected articles reported the use of machine learning algorithms for this end.
1 INTRODUCTION
With the evolution of digital technology, a large
amount of data has been publicly available (Uta-
machant and Anutariya, 2018). Among those data
is the open data, as the name reveals, is open to the
public (Yi, 2019) and can be freely used, modified,
and shared by anyone for any purpose (Vetr
`
o et al.,
2016). According to Open Data Barometer, open data
plays a relevant role in ensuring effective institutions
and securing public access to government information
(Brandusescu et al., 2018). Open government data
(OGD) refers to data provided to the public by gov-
ernment institutions (Kassen, 2013). Despite the sig-
nificant proliferation of platforms to make these data
available, quality issues are a crucial factor (Ku
ˇ
cera
et al., 2013a) for the success of OGD initiatives (Bel-
hiah and Bounabat, 2017). For example, the discrep-
ancy in the terms and data types negatively affects
reuse and its effective use (Zuiderwijk et al., 2016).
Discovering the relevant data is a prerequisite
(Ku
ˇ
cera et al., 2013a) for a user to be able to use
a
https://orcid.org/0000-0001-8349-8294
b
https://orcid.org/0000-0001-6241-1612
c
https://orcid.org/0000-0002-4786-9243
open data. When a dataset is publicly online, users
must access it without barriers (Dander, 2014), either
through a file download, a portal query, or API ac-
cess, among other possibilities. Moreover, datasets
with non-conformities like missing values, outdated
information, and inappropriate metadata, may not fit
the user needs (M
´
achov
´
a and Ln
ˇ
eni
ˇ
cka, 2017). For
those reasons, discoverability, accessibility, and us-
ability are essential dimensions for the quality evalu-
ation of open government data.
This Systematic Mapping is part of a larger joint
project whose goal is to propose a roadmap for open
government data quality evaluation. As the first step
of this project, we endeavor to analyze the current
state of the art in open government data quality eval-
uation. The Research Question (RQ) of this System-
atic Mapping is as follows: ”What techniques, frame-
works, and machine learning algorithms have re-
searchers and stakeholders used to evaluate the qual-
ity of open government data regarding its discover-
ability, accessibility, and usability”? This research
question is in line with the goal of this review. Re-
searchers have conducted several studies to evaluate
the quality of OGD (Oliveira et al., 2016) but, accord-
ing to Sadiq and Indulska (2017), there is still a gap
214
Almeida, R., Carneiro, G. and Moreno, E.
Characterizing Open Government Data Available on the Web from the Quality Perspective: A Systematic Mapping Study.
DOI: 10.5220/0011585300003318
In Proceedings of the 18th International Conference on Web Information Systems and Technologies (WEBIST 2022), pages 214-225
ISBN: 978-989-758-613-2; ISSN: 2184-3252
Copyright
c
2022 by SCITEPRESS – Science and Technology Publications, Lda. All rights reserved
in the evaluation of data quality dimensions.
To answer the proposed research question a Sys-
tematic Mapping Study (SMS) has been carried out
to gather evidence provided by papers published in
peer-reviewed conferences and journals from 2011 to
2021. We initially found 792 papers as a result of the
applied search strings in specific electronic databases
and the execution of snowballing procedure (Wohlin,
2014), from which we considered 21 studies as rele-
vant. Findings suggest that there is no standardization
in data quality evaluation, but some dimensions have
been more used in studies. We also found that there
are dimensions with different names but with related
quality evaluation purposes, and that’s the reason we
decided to create dimension groups. Those groups
can have different influences on the three main di-
mensions: discoverability, accessibility, and usability.
Regarding the data sources used in open government
data quality evaluation studies, most did not mention
the application domain of datasets used in the analy-
sis. The approach used by most of the articles in data
analysis was human observation. And most of the
non-conformities cited by the selected articles were
related to data discoverability and usability.
The remainder of this paper is organized as fol-
lows. Section 2 presents the design we adopted to
conduct this systematic mapping study. Section 3
presents the key findings to the stated research ques-
tion and Section 4 concludes this work.
2 RESEARCH DESIGN
We performed a systematic mapping review of the
published peer-reviewed literature, from 2011 to
2021, to gather existing evidence of the techniques,
frameworks, or machine learning algorithms that have
been used to evaluate the quality of open government
data (OGD). Systematic mapping is a type of sec-
ondary study that has the goal to describe the extent
of the research in a field and identify gaps in the re-
search base. It identifies gaps in the research where
further primary research is needed, and areas where
no systematic reviews have been conducted and there
is scope for future review work (Clapton et al., 2009).
Systematic mapping provides descriptive infor-
mation about the state of the art of a topic and a sum-
mary of the research conducted in a specific period
(Clapton et al., 2009). The overall process for the se-
lection of relevant studies is presented in Table 1 and
described in more detail in the following subsections.
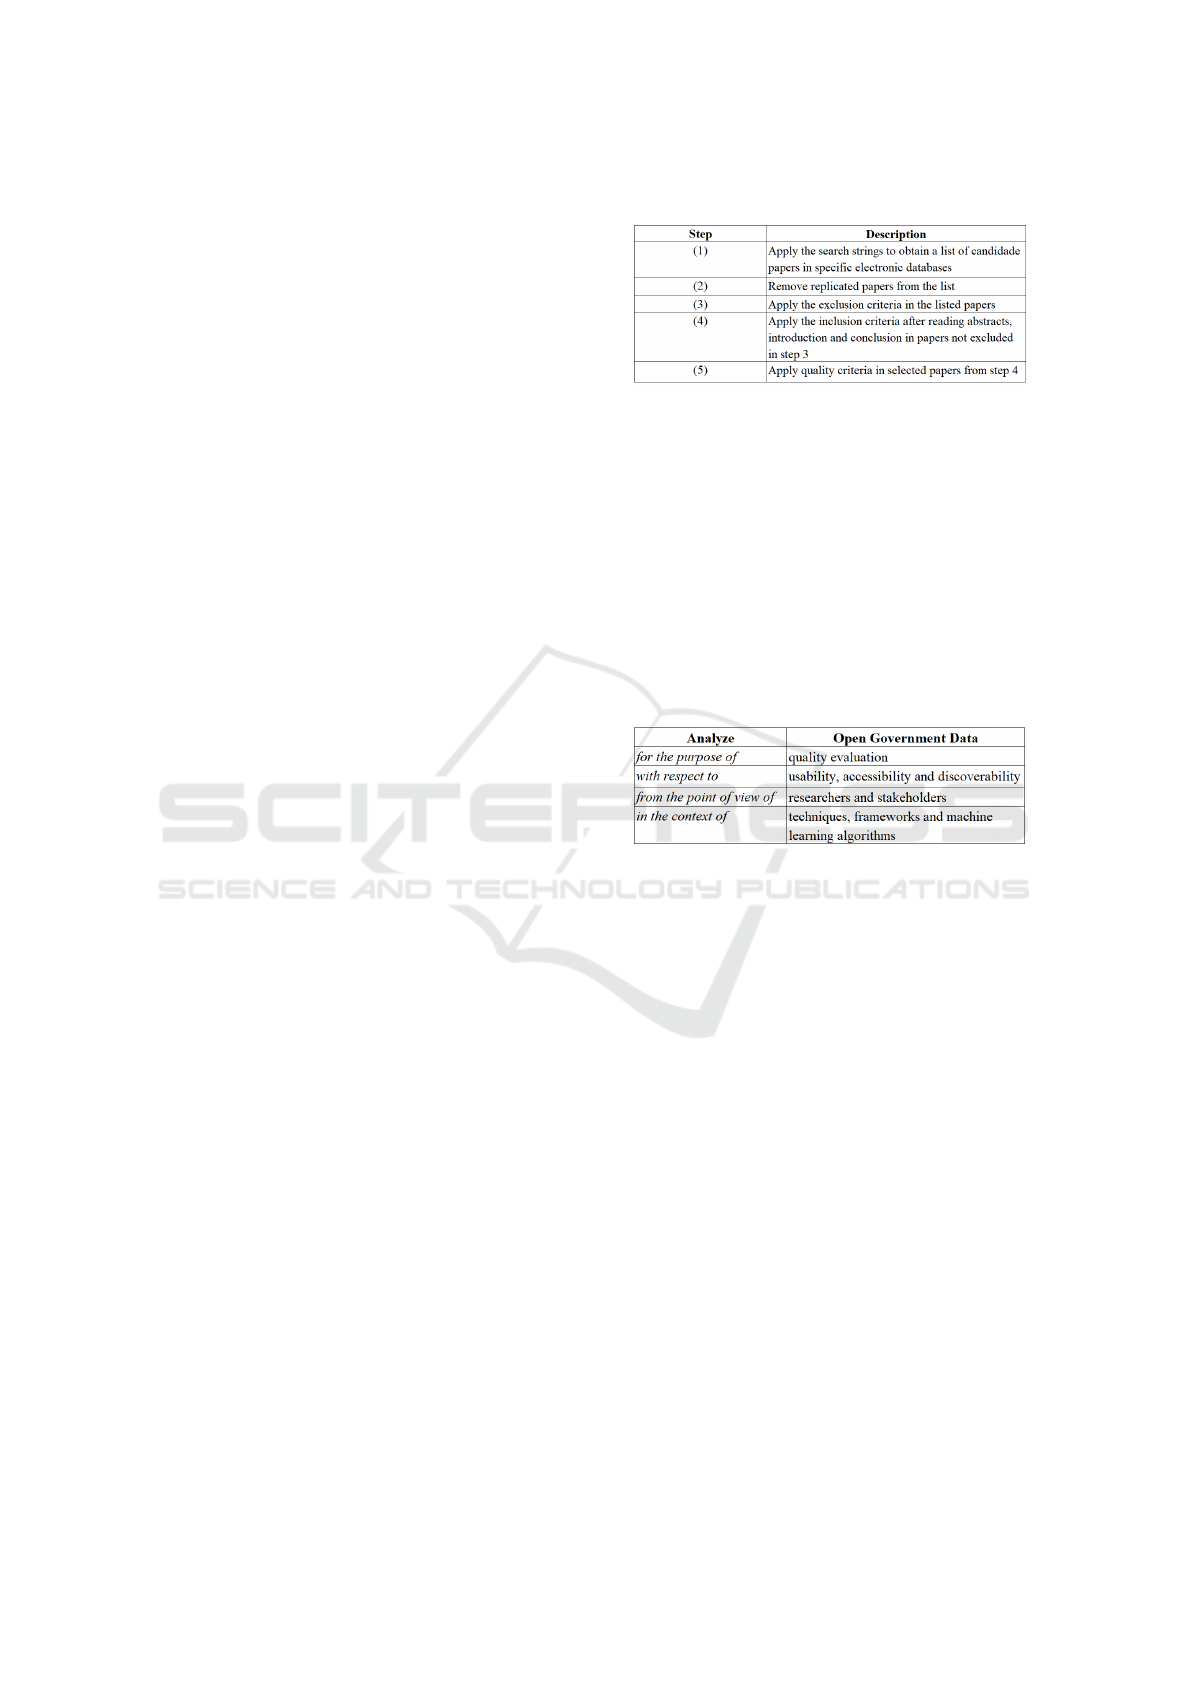
Table 1: Steps for the selection process.
2.1 Planning
We conducted this SMS based on a protocol com-
prised of objectives, research questions, selected elec-
tronic databases, search strings, and selection proce-
dures comprised of exclusion, inclusion, and quality
criteria to select studies from which we aim to answer
the stated research questions (Wohlin et al., 2012).
The goal of this study is presented in Table 2 ac-
cording to the Goal Question Metric (GQM) approach
(Basili and Rombach, 1988).
Table 2: The goal of this SMS according to the GQM ap-
proach.
The Research Question (RQ) is ”What techniques,
frameworks, and machine learning algorithms have
researchers and stakeholders used to evaluate the
quality of open government data regarding its dis-
coverability, accessibility, and usability”? The mo-
tivation behind RQ is justified by the fact that high-
quality data can be used by many institutions (public
or private) to improve business processes, make smart
decisions and create strategic advantages (Behkamal
et al., 2014). On the other hand, a government that
publishes data with low quality, such as missing meta-
data or duplicated fields, can create a bad reputation
among its citizens (Kubler et al., 2018a).
The specific research questions have the goal to
gather evidence to support the answer to the stated
RQ. This research question is in line with the goal
of this review and has been derived into four spe-
cific research questions, as follows. Specific Research
Question 1 (SRQ1): What are the key quality dimen-
sions adopted by researchers to evaluate the quality
of open government data? Data quality is a multidi-
mensional construct and can be analyzed under dif-
ferent perspectives, it is important to understand how
researchers are taking into consideration those differ-
ent angles of analysis. Specific Research Question 2
Characterizing Open Government Data Available on the Web from the Quality Perspective: A Systematic Mapping Study
215
(SRQ2): What kind of data sources are used in open
government data quality evaluation studies? The
data sources are a crucial component of any research
project from which information can be extracted to
unveil trends and patterns that otherwise would not
be known by the research community. Specific Re-
search Question 3 (SRQ3): What is the approach used
in data analysis? Understanding how the data are
being evaluated in practice is critical and will enrich
the research. Specific Research Question 4 (SRQ4):
What are the data quality non-conformities found by
researchers? It is essential to know the existing prob-
lems so that interested parties can take steps to resolve
them.
We considered the PICO criteria (Stone, 2002) to
define the search string, as shown in Table 3. The
search strings are based on this criteria for the selec-
tive process of papers for this review. The steps to
build a search string to identify studies in the target
repositories are shown in Table 4 and 5. The Table 4
refers to major terms for the research objectives. We
also considered the use of alternative terms and syn-
onyms for these major terms. For example, the term
machine learning can be associated with terms such as
artificial intelligence and deep learning. These alter-
native terms, as shown in Table 5, can be also included
in the search string. We built the final search string
by joining the major terms with the Boolean ”AND”
and joining the alternative terms to the main terms
with the Boolean ”OR”. The focus of the formed
search string is to identify studies targeting the re-
search question of this systematic mapping.
Table 3: PICO criteria for search strings.
Table 4: Major terms for the research objectives.
Table 6 presents the electronic databases from
which we retrieved the papers along with the respec-
tive search strings used in that process. The target
databases were ACM Digital Library, IEEE Digital
Library, and Scopus. All searches were performed on
October 10, 2021.
Table 5: Alternative terms from major terms.
Table 6: Electronic databases selected for this Systematic
Mapping.
Table 7 presents the criteria for exclusion, in-
clusion, and quality evaluation of papers in this re-
view. The OR connective used in the exclusion crite-
ria means that the exclusion criteria are independent,
i.e., meeting only one criterion is enough to exclude
the paper. On the other hand, the AND connective
in the inclusion criteria means that all inclusion cri-
teria must be met to select the paper under analysis.
Table 7 also presents the quality criteria used for this
review represented as questions adjusted from their
original version from Dyba and Dingsoyr (Dyb
˚
a and
Dingsøyr, 2008). We evaluated all the remaining pa-
pers that passed the exclusion and inclusion criteria
using the quality criteria presented in the same table.
All these criteria must be met (i.e., the answer must
be YES for each one) to permanently select the paper,
otherwise, the paper must be excluded. The exclu-
sion, inclusion, and quality criteria were used in the
steps for the selection process as already presented in
Table 1. According to Table 8, at the end of the selec-
tion process, all the retrieved papers were classified in
one of the three options: Excluded, Not Selected and
Selected.
2.2 Execution
The quantitative evolution of the selection process ex-
ecution is summarized in Figure 1.
The figure uses the PRISMA flow diagram (Mo-
her et al., 2009) and shows the performed steps and
the respective number of papers for each phase of the
WEBIST 2022 - 18th International Conference on Web Information Systems and Technologies
216
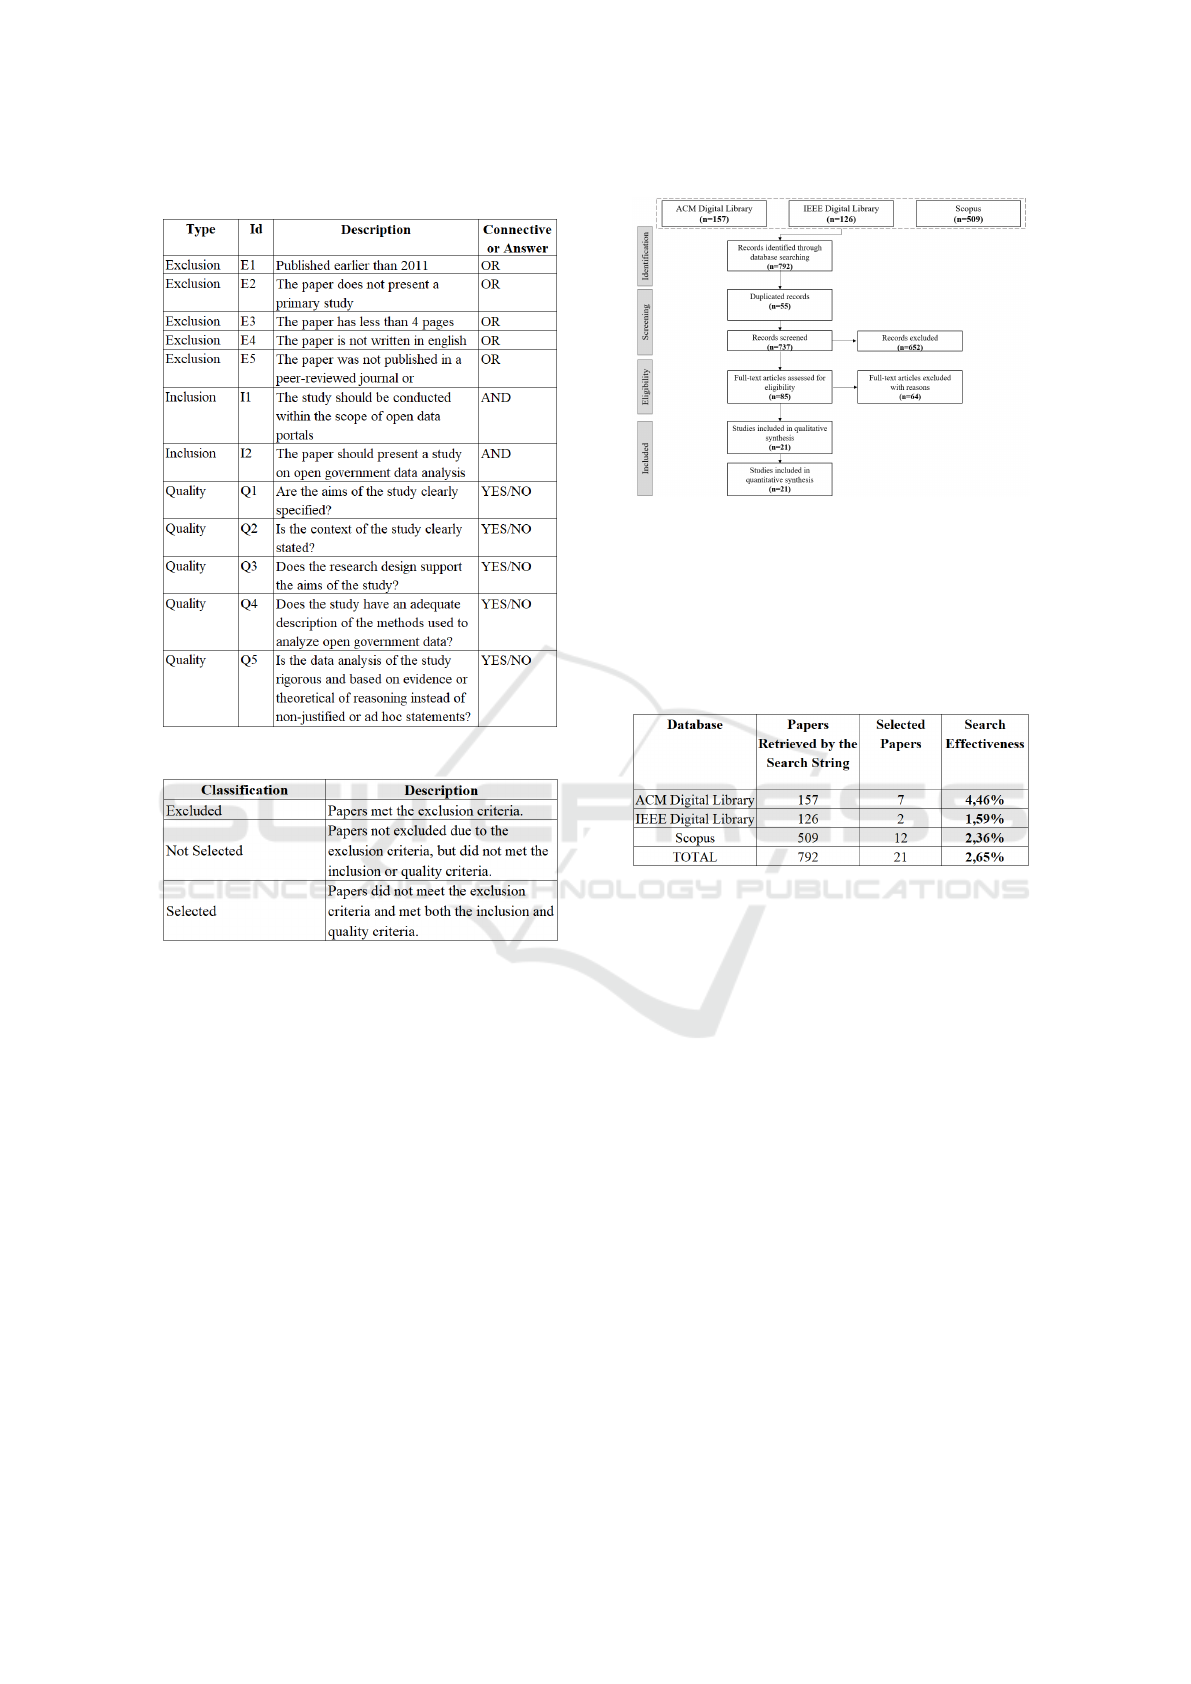
Table 7: Exclusion, inclusion and quality criteria.
Table 8: Classification options for each retrieved paper.
systematic mapping.
According to Table 1, as a result of the execution
of Step 1 (execution of the search string), we retrieved
from the three selected repositories a total of 792
papers (Identification Phase of Figure 1). Consider-
ing that 55 papers were duplicated, we evaluated 737
regarding the alignment of their titles and abstracts
to the stated specific research questions (Screening
Phase of Figure 1).
The result of this evaluation was the exclusion of
652 papers and the inclusion of 85 papers, following
the exclusion and inclusion criteria respectively al-
ready presented in Table 7. In the Eligibility Phase of
Figure 1, we evaluated 85 papers to decide that 64 pa-
pers should not have been selected due to not meeting
the quality criterion presented in Table 7. The final set
of studies to answer the specific research questions is
comprised of 21 papers (Included Phase of Figure 1).
Table 9 presents the effectiveness of the search
strings considering the 792 retrieved papers. The
repository database that most contributed to selected
Figure 1: Phases of the selection process in numbers (ad-
justed from Moher et al. (2009)).
studies was the Scopus with 12 papers, correspond-
ing to search effectiveness of 2,36%. The 21 selected
studies represented 2,65% of all 792 papers retrieved
by the search string.
Table 9: Effectiveness of the search strings.
3 RESULTS
All the relevant information that was extracted from
the 21 selected articles to answer the four specific re-
search questions (SRQ1, SRQ2, SRQ3, and SRQ4)
are presented in a form of a complete table that can
be downloaded in an Excell format through Zenodo
(https://doi.org/10.5281/zenodo.7015916). Figure 2
summarizes the evidence where each branch has the
associated SRQ. The total amount of references for
each of the four branches of Figure 2 does not corre-
spond to the total of 21 analyzed articles. The reason
for this difference is that most of the studies fall into
more than one of the available groups. The branch
named Quality Dimensions Analyzed (SRQ1) indi-
cates not only the quality dimensions that were pre-
sented in each article but also if that dimension is used
to analyze data and/or metadata which is represented
by a letter D (data) and/or M (metadata) beside each
dimension name. Also, in that same branch, the di-
mension that has different names but has the same
quality evaluation objective were placed together in
a branch.
Characterizing Open Government Data Available on the Web from the Quality Perspective: A Systematic Mapping Study
217
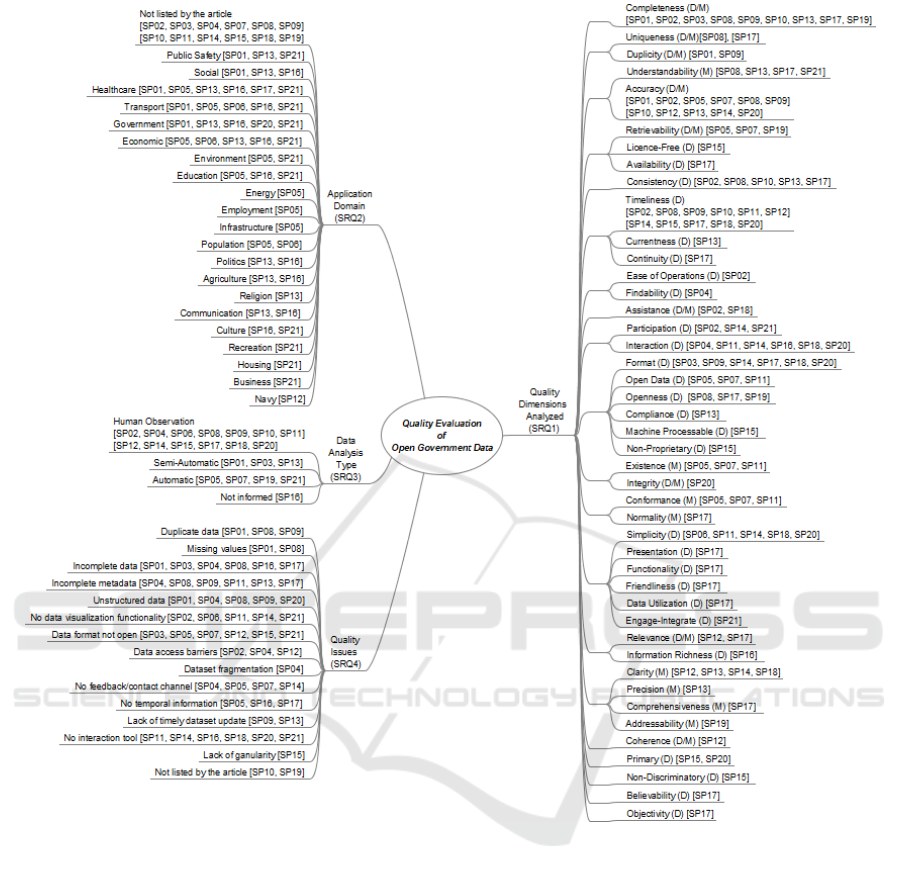
Figure 2: Evidence from the literature to answer specific research questions.
In this section we will discuss in detail those gath-
ered information and present our findings. With the
purpose to make it in a clearer and more comprehen-
sive way, we divided this section into four, each one
representing a specific research question.
3.1 SRQ1 - What Are the Key Quality
Dimensions Adopted by Researches
to Evaluate the Quality of Open
Government Data?
During the SMS we noticed that different dimensions
were being used no analyse datasets and, sometimes,
with different nomenclature but the same quality eval-
uation objective. That finding was also reported by
some of the selected articles. Sadiq and Indulska
(2017), for example, quoted that one of the challenges
in open data quality management is a common under-
standing of the data quality dimension. According to
Str
´
o
˙
zyna et al. (2018) there is no consensus among
academics regarding an approach to the assessment
of data quality.
This lack of pattern impairs the data quality anal-
ysis, but, on the other hand, it is difficult to create a
standard that embrace every scenario. Neumaier et al.
(2016) states that the selection of a proper set of qual-
ity dimensions to evaluate datasets is highly context
specific since their purposing is testing the fitness for
use of data for a specific task; and that’s the reason
why quality dimensions differ among the data quality
methodologies (Batini et al., 2009).
WEBIST 2022 - 18th International Conference on Web Information Systems and Technologies
218
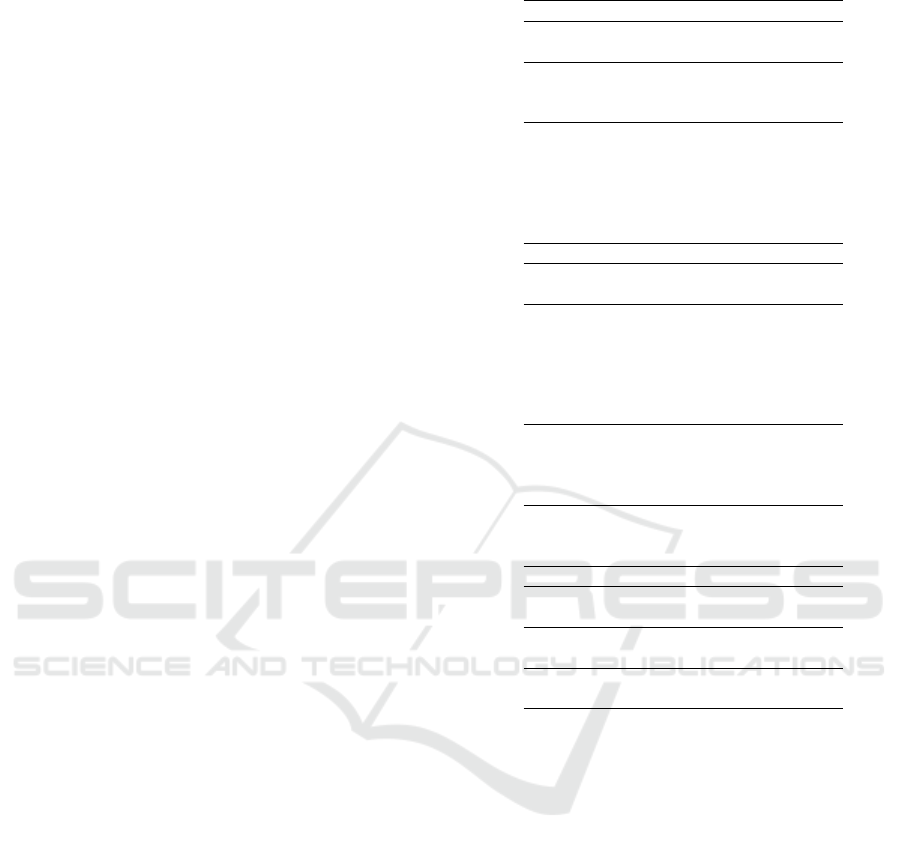
Figure 2 plots in its right side data related to the
Quality Dimensions Analyzed (SRQ1). We identi-
fied 49 different names for the quality dimensions,
but 5 of them were excluded because they are broader
terms, that is, they can not be measure without analyz-
ing other dimensions. These are: Accessibility, Us-
ability, Discoverability, Structuredness and Trust. Of
the remainder dimensions, 24 has the same data qual-
ity evaluation objective of others and for that reason
they were placed together in a branch. Eight dimen-
sions branch were cited only 3 times or less and for
that reason they were not considered relevant. These
branches and their frequency of appearance are: Rel-
evance and Information Richness (3 studies - 14%),
Primary (2 studies - 10%), Ease of Operations and
Findability (2 studies - 10%), Assistance (2 studies -
10%), Coherence (1 study - 5%), Non-Discriminatory
(1 study - 5%), Believability (1 study - 5%) and Ob-
jectivity (1 study - 5%). We ended up with 12 quality
dimensions group, each one containing one or more
related dimensions. Table 10 presents those groups in
order of most appearance in the articles.
It is important to report that 5 articles (SP09,
SP11, SP14, SP18, SP20) analyzed characteristics of
the data (or metadata) without mentioning the name
of the dimension. In that case we had to convert them
into dimensions according to the aspects that were
evaluated. Also, 5 articles (SP02, SP06, SP11, SP20,
SP21) used dimensions and metrics to evaluate gen-
eral characteristics of the open data portal, but those
were not considered because our work is about data
quality evaluation and not portal quality evaluation.
In terms of number of dimensions evaluated, all
the articles together analysed 127 dimensions, an av-
erage of 6 dimensions per article. Only one article
evaluated more than 10 dimensions (SP17 - 21 di-
mensions) and only 3 articles analysed 3 or less di-
mensions (SP01 - 3 dimensions, SP03 - 2 dimensions,
SP06 - 1 dimension).
When a dataset is being evaluated in terms of its
quality, the data itself can be the target of the analysis,
or the metadata, or both. In the selected studies, 27
dimensions used data as a primary source of analysis,
8 dimensions used metadata and 9 dimensions used
both. This happens because for some dimensions the
metadata, for example, will not give any quality infor-
mation, or vice-versa. Take Timeliness as an example,
the importance here is to analyze if the data is up to
date. But for some dimensions both data and meta-
data will be an important source of information. In
the case of Accuracy analysis, it is important to have
a data that is precise and also a metadata that correctly
describe the data that is being published.
Table 10: Dimensions groups found in the articles.
Dimension Group Frequency
Accuracy 13 studies - 62%
Understandability
Timeliness 12 studies - 57%
Currentness
Continuity
Format 11 studies - 52%
Open Data
Openness
Compliance
Machine Processable
Non-Proprietary
Completeness 9 studies - 43%
Participation 8 studies - 38%
Interaction
Simplicity 7 studies - 33%
Presentation
Functionality
Friendliness
Data Utilization
Engage-Integrate
Clarity 6 studies - 29%
Precision
Comprehensiveness
Addressability
Retrievability 5 studies - 24%
Licence-Free
Availability
Consistency 5 studies - 24%
Duplicity 4 studies - 19%
Uniqueness
Existence 4 studies - 19%
Integrity
Conformance 4 studies - 19%
Normality
We will now present the definition of the dimen-
sions presented in Table 10. Even though the dimen-
sions Accessibility, Usability, Discoverability, Struc-
turedness and Trust were not considered part of any
quality dimension group, we decided to present the
concept of those constructs and explain the reasons
behind our decision of exclusion.
Accessibility was cited by 8 articles (SP02, SP04,
SP12, SP13, SP15, SP17, SP20, SP21) and is de-
fined by Str
´
o
˙
zyna et al. (2018) as the the possibility
to retrieve data from a source. When an user find a
database, he should be able to access it without bar-
riers. Other dimensions can affect the data accessi-
bility, such as the format in which data are published,
the search tool used, and the metadata of the dataset
(Maali et al., 2010).
Usability appeared in 4 articles (SP04, SP16,
SP17, SP19). According to Magalh
˜
aes and Roseira
(2016), this dimension can take many forms. Even
though access to the data is not an issue, users can,
for example, be partially or completely unable to ex-
plore the datasets available due to lack of necessary
Characterizing Open Government Data Available on the Web from the Quality Perspective: A Systematic Mapping Study
219

resources or computational skills. That is the reason
we decided to not consider it as part of any quality
dimension group, because for a data (or metadata) to
meet the usability criteria, it has first to attend others
dimensions criteria, such as accessibility, format and
completeness.
Discoverability appeared in only one article
(SP16). At this research, Dahbi et al. (2018) high-
lights that an OGD is only really open if it can be eas-
ily discoverable, that is, users should be able to search
and access relevant data in a simple and efficient way.
The same way as Usability, to promote data Discov-
erability datasets must have other characteristics such
as structured, complete and accurate metadata, which
are other quality dimensions.
The last two broader dimensions that appeared
on the selected articles are Structuredness (1 article
- SP17) and Trust (1 article - SP21). According to
Wu et al. (2021), Structuredness indicates the degree
of organization of the dataset, and Zhu and Freeman
(2019) developed a framework where the Trust di-
mension includes criteria such as completeness, cur-
rentness, availability, granularity and relevance.
The quality dimensions group presented on Ta-
ble 10 were formed considering the quality evalua-
tion objective of each dimension. When similarities
or complementarities between those objectives were
found, the dimensions were considered as related and,
therefore, part of the same group. We will now con-
ceptualize each one of the 12 groups and the definition
of the dimensions itself will be sufficient to under-
stand their relationship. As our research question is
to analyse the dimensions used to evaluate the quality
of open government data regarding its discoverabil-
ity, accessibility and usability, it is fundamental to de-
scribe how the dimension groups affect those artefacts
and that will be discussed along with their definition.
Accuracy (11 articles) is the extent to which a
selected set of specific metadata keys accurately de-
scribe the resource (Sanabria et al., 2018), and its re-
lated dimension Understandability (4 articles) is at-
tended by a dataset, according to Li et al. (2018),
when the meaning of each column of data is clear.
If you have correct and precise metadata within the
data, it will positively affect the discoverability of
the dataset. Not only by an ordinary user that make
a search at a data portal or a search engine like
Google, but also by an expert that will use an API or a
SPARQL endpoint to find data. Usability will also be
positively affected because the name and the mean-
ing of each column, for example, is very important
to understand and correctly make use of those data.
Accessibility will not be affected.
Timeliness (11 articles) is achieved when data is
made available to the public as soon as possible after
the actual data is created, in order to preserve its value
(Wang and Shepherd, 2020), and it has two related
dimensions: Currentness (1 article), whose metrics
of evaluation chosen by Utamachant and Anutariya
(2018) were the timeliness after expiration (period be-
tween the publication of a dataset after the expira-
tion of its previous versions) and the timeliness in a
publication (period between the moment in which the
dataset is available and its publication in the portal);
and Continuity (1 article), that indicates whether there
is continuity in the release of datasets on the same
topic (Wu et al., 2021). When you have an updated
dataset it will positively affect its usability. That’s be-
cause citizens, organizations and researchers that are
using those information in their projects depend on
data that is made available in a continuous and timely
manner, otherwise the information value is compro-
mised. Discoverability can also be affected because
if you are searching for an information of the current
year, for example, and the dataset is two years out of
date, you may have problems finding it. Accessibility
will not be affected.
Format (6 articles) is a quality aspect that is at-
tended when, according to Group (2007), the data
available is machine-readable, provided in a conve-
nient form, and offered without technological barri-
ers for data consumers. Open Data (3 articles) di-
mension checks if the file format is based on an open
standard, is machine readable and has an open license
(Neumaier et al., 2016). Openness (3 articles) has the
exactly the same definition of Open Data at Li et al.
(2018). Compliance (1 article) appeared only at Neu-
maier et al. (2016) and it is a value (1-5) depending on
dataset’s file format according to Tim Berners-Lee’s
5-star open data scheme. Machine Processable (1 ar-
ticle) and Non-Proprietary (1 article) appeared in the
same work. The first is achieved when data is pub-
lished in a structured manner to allow automated pro-
cessing and the second when data is published in a
format which is not controlled exclusively by a single
entity. A data that is in a format that is not machine
readable, pdf for an example, will not have associated
metadata and that will make it difficult to be discov-
ered. Using that same example, it is not an easy task
to extract conclusions from data in a pdf format, that
is, you will have problems to make simple statistics
tasks such as calculating maximum, minimum or me-
dian of a dataset column, affecting both its accessibil-
ity and its usability.
Completeness (9 articles) is described by Kubler
et al. (2016) as the extent to which the used data (or
metadata) are non empty, that is, contain information,
WEBIST 2022 - 18th International Conference on Web Information Systems and Technologies
220

as said by Sanabria et al. (2018). As in the Accu-
racy dimension, metadata is very important not only
to explain the content of the dataset but also to make
it easier to be found. So, the lack of metadata will
affect dataset’s discoverability and usability. Accessi-
bility is not affected.
Interaction (6 articles) is measured by Chu and
Tseng (2016) using the following indicators: discus-
sion - if datasets has mechanisms such as forums or
feedback; score and rank - if users are able to score or
rank the data and the possibility to visualize the num-
ber of downloads of the dataset. It has a related di-
mension called Participation (3 articles) that analyze,
according to Zhu and Freeman (2019), criteria such
as the possibility to comment, discuss, rate, share and
make suggestions to the dataset. When users inter-
act in some way with the database, it generates infor-
mation that enhances the probability of finding this
dataset by search engines. So, discoverability is af-
fected by this group of dimension. Usability is also
affected because the participation of the users is a very
good opportunity to improve the dataset and make it
more suited to the needs of its users. Accessibility is
not affected.
Simplicity (5 articles) is a measurement of how
simple are the analysis task and the presentation of
analysis outputs (Osagie et al., 2017). It has five re-
lated dimensions: Presentation (1 article), Function-
ality (1 article), Friendliness (1 article), Data Utiliza-
tion (1 article) and Engage-Integrate (1 article). They
were all cited only once and the first four appeared
in the same article (SP17). In that work the authors
decided to divide the evaluation of the data analysis
task in more than one dimension where Presentation
indicates the type of presentation data, such as ta-
bles, images and text; Functionality indicates the de-
gree of completeness of the functionality associated
with the dataset; Friendliness indicates whether the
interface design is friendly; and Data Utilization indi-
cates whether data-related applications and interfaces
are provided. And finally, Engage-Integrate, cited by
Zhu and Freeman (2019), verify if the datasets can
be downloaded, visualized in other format such as
maps, graphics or others, and printed. It is evident
that the usability is highly affected by this group of
dimension, specially for ordinary users that may have
difficult understanding data in a raw format. Dis-
coverability will benefit with the presence of other
forms of data representation, because a data interac-
tion tool can generate web traffic that will improve
dataset’s search capabilities. Accessibility will also
be affected, because potential users may have inter-
est in only access data in a graphic format rather than
download a file, for example.
Clarity (4 articles) is a dimension whose concerns
are the conditions and modalities by which users can
obtain, use and interpret data (Str
´
o
˙
zyna et al., 2018).
Precision (1 article) was found only in Utamachant
and Anutariya (2018) and it states that the scope and
coverage to the content should be clear. Compre-
hensiveness (1 article) indicates the richness of the
dataset’s topics (Wu et al., 2021). Addressability (1
article) description by Kubler et al. (2016) is the ex-
tent to which the data publisher provides contact in-
formation via ’URL’and ’email’. Discoverability will
benefit from a dataset that is clear, precise and filled
with important information that can be useful while
performing a search. Data usability is also improved
because users will comprehend better the meaning of
each dataset column and line. Accessibility will not
be affected.
Retrievability (3 articles) is, according to Kubler
et al. (2018b), the extent to which the described
dataset can be retrieved by an agent. Licence-Free (1
article) and Availability (1 article) are the other two
related terms and they´re achieved when data is not
subject to any limitation on its use due to copyright,
patent, trademark or trade secret regulations (Wang
and Shepherd, 2020) and when data are available and
have attributes that enable them to be retrieved by au-
thorized users and/or applications (Wu et al., 2021),
respectively. It is evident that accessibility will be
highly affected by this group. Discoverability and us-
ability won´t be influenced.
Consistency (5 articles) dimension is attended by
a dataset, according to Li et al. (2018), when the for-
mat of a column of data is consistent, such as date
format, null expression format, etc. This dimension
will affect data usability because null values, for ex-
ample, are harmful to data analysis and must be cor-
rectly treated. Discoverability and accessibility will
not be affected.
Duplicity (2 articles) metrics used by Sanabria
et al. (2018) are the percentage of record with du-
plicate records and Uniqueness (2 articles) dimension
cited by Li et al. (2018) evaluate if data records are
unique and not repeated. As well as null or miss-
ing values, duplicate data also needs to be corrected
handled, otherwise they can harm data analysis and,
consequently, its usability. Discoverability and acces-
sibility will not be affected.
Existence (3 articles) is the extent to which infor-
mation about dataset´s license, format, size, update
frequency, owner is provided (Kubler et al., 2018b).
Integrity (1 article) is achieved by a dataset, accord-
ing to Chu and Tseng (2016), when there are enough
data content and metadata. The more metadata you
have, better are the chances to find data, improving its
Characterizing Open Government Data Available on the Web from the Quality Perspective: A Systematic Mapping Study
221
discoverability. Usability is also improved when there
are more information about the dataset. Accessibility
is not affected.
Conformance (3 articles) is a dimension that an-
alyzes if the information available in the dataset are
valid and adhere to a certain format (Neumaier et al.,
2016). Normality (1 article), cited only by Wu et al.
(2021), indicates whether the metadata values are
standardized and consistent. When a dataset contains
metadata in a certain standard it will make it easier to
be found during a search, therefore affecting its dis-
coverability. Usability is also improved because users
can better understand the meaning and the content of
a dataset column, for example, if it has a name that is
self explanatory or that follows a recognized standard.
Accessibility is not affected.
Figure 3 presents the three broad dimensions ob-
ject of this study (discoverability, accessibility and us-
ability) in a mathematical representation of sets and
the 12 group of dimensions placed according to their
influence on them. We decided to use only one dimen-
sion representing each group in order to do not pollute
the image. The group that have more than one dimen-
sion, we choose as the representative of the group the
dimension that was most cited by the selected arti-
cles, or randomly, if they were cited equal times. The
groups that affect the three broad dimensions are in
the middle of the figure, in the area of intersection of
the three sets. When the group affect only two dimen-
sions it is placed in the intersection of those two sets.
And if it affect only one dimension it is placed in the
area that has no intersection with other set.
Figure 3: Dimension groups and their influence on the Dis-
coverability, Accessibility and Usability.
Figure 3 shows that only retrievability group do
not affect data usability, all of the remaining 11
groups of dimensions have some influence on the us-
ability of the dataset. Most of the dimensions groups
(7) influence both discoverability and usability, and
2 dimensions affect discoverability, accessibility and
usability.
3.2 SRQ2 - What Kind of Data Sources
Are Used in Open Government Data
Quality Evaluation Studies?
Most of the articles (12 articles - 57%) did not men-
tion the application domain of the dataset used on the
analysis. Healthcare data were the most used (6 ar-
ticles). Transport, Government and Economic data
were analysed by 5 articles each. Datasets includ-
ing Public Safety, Social and Education information
were used by 3 articles each. Environment, Popula-
tion, Politics, Agriculture, Communication and Cul-
ture data appeared only in 2 articles. Energy, Employ-
ment, Infrastructure, Religion, Recreation, Housing,
Business and Navy data were evaluated by 1 article
each.
We believe that the reason because most of the
articles did not cite the type of data that were being
evaluated was the fact that the main concern of these
studies are the evaluation of open government data in
general. So, when the researches selected a portal to
extract datasets, they´re first concern was not the ap-
plication domain of those data but its quality aspects
according to the chosen dimensions. And that is also
reflected on the title and introduction of most of the
articles where there is no direct quote to a certain gov-
ernment area. Only two of the selected articles (SP12
and SP17) presented an application domain of inter-
est that guided the selection of the datasets that were
analyzed.
3.3 SRQ3 - What Is the Approach Used
in Data Analysis?
Human Observation is the approach used by most of
the articles (13 articles - 62%). 3 articles chose a
Semi-Automatic data analysis type and 4 articles used
an Automatic approach. Only 1 article did not men-
tion the way datasets were evaluated.
In the data analysis type that we called human ob-
servation, researchers used participants to perform a
predefined set of tasks within the dataset and then an-
swer a questionnaire that was used to evaluate data
quality. Some works selected ordinary users to par-
ticipate, others chose users with IT background and
there were also a mixed selection of participants. In
the semi-automatic approach there were at least one
automatic stage in the data quality evaluation process.
This automatic stage may be at the data collection step
(SP03) or at the quality assessment stage (SP01 and
WEBIST 2022 - 18th International Conference on Web Information Systems and Technologies
222
SP13). An automatic approach is the one who has
no human intervention all over the data quality eval-
uation process, since the data download through the
quality metrics analysis of those data and finally ag-
gregating and presenting the results in a friendly form.
3.4 SRQ4 - What Are the Data Quality
Non Conformities Found by
Researchers?
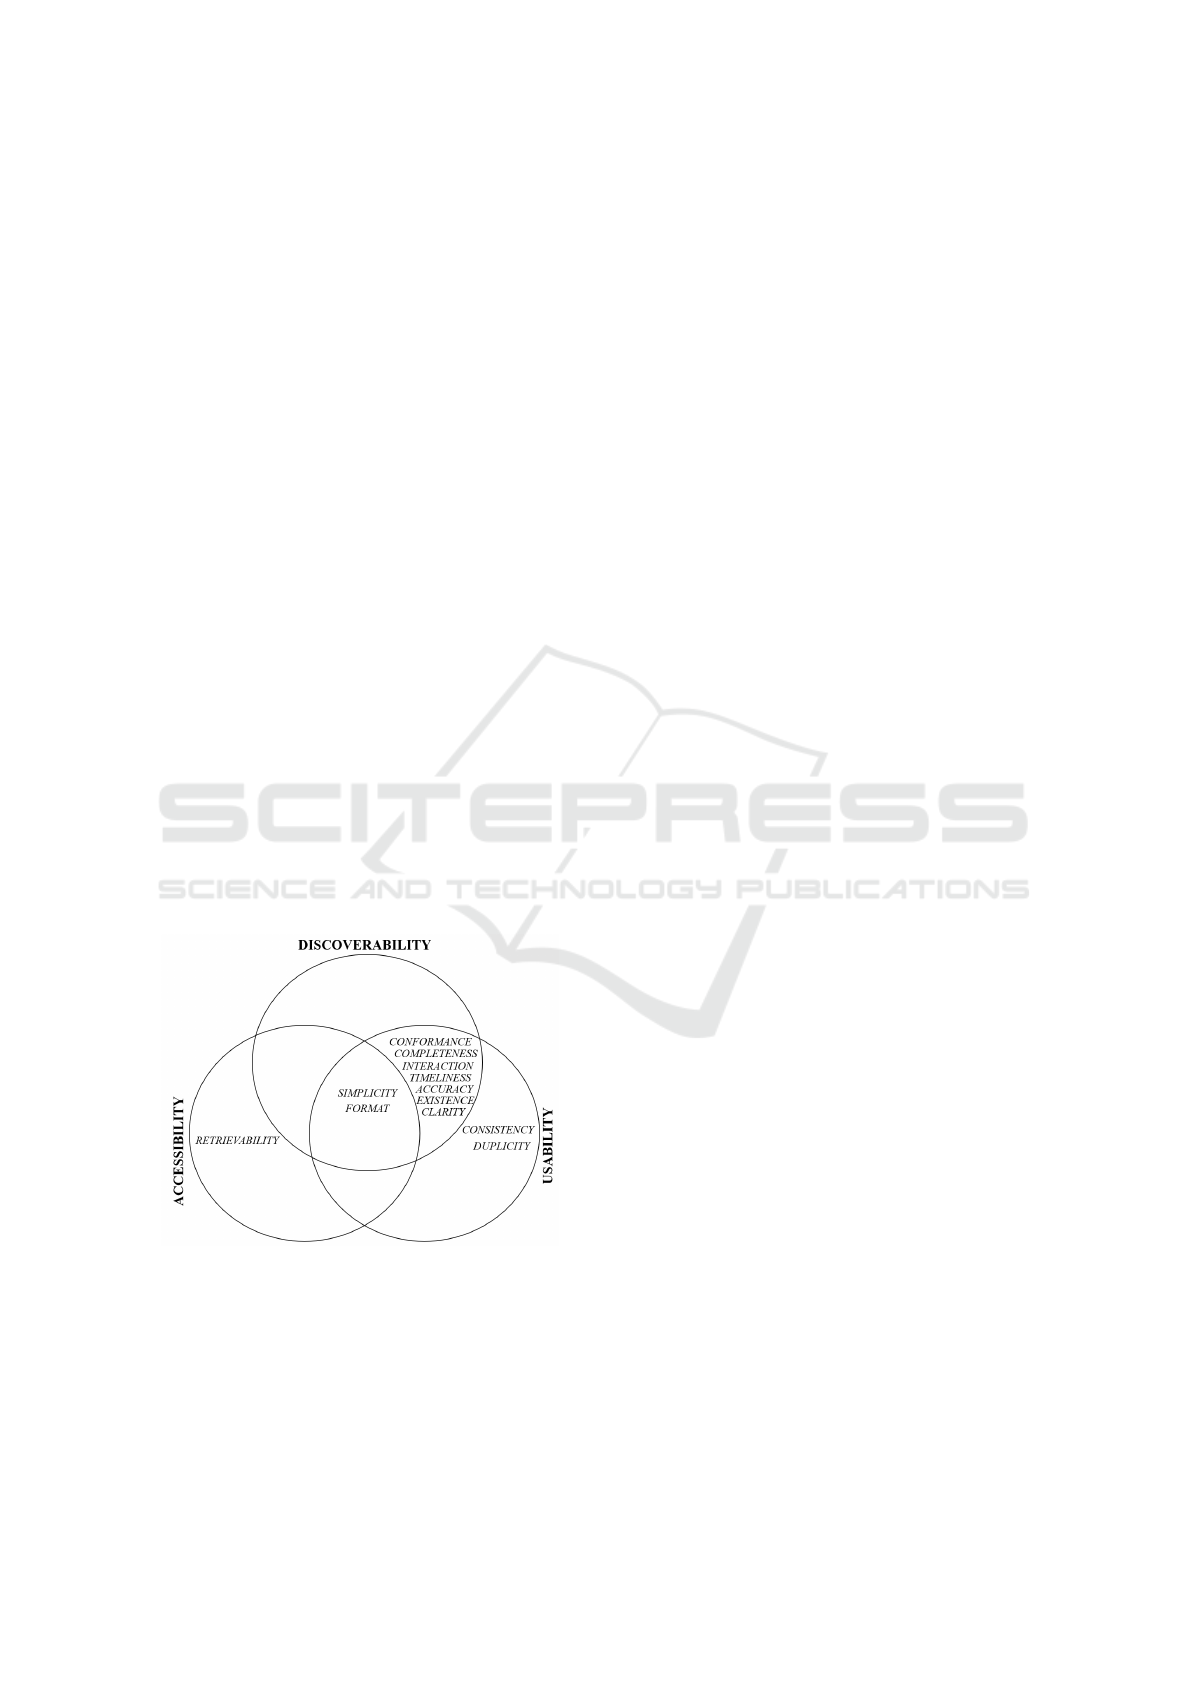
There were 14 main quality issues reported by the se-
lected articles. Only 2 articles did not mention the
problems found in the data quality evaluation. Incom-
plete Data, Incomplete Metadata, Data Format Not
Open, No Interaction Tool were problems reported by
6 articles each. Unstructured Data and No Data Vi-
sualization Functionality were found by 5 articles. 4
articles cited No Feedback/Contact Channel as a qual-
ity concern. Duplicated Data, Data Access Barriers
and No Temporal Information appeared in 3 articles.
Missing Values and Lack of Timely Dataset Update
was cited by 2 articles. Dataset Fragmentation and
Lack of Granularity were quality issues found in only
1 article.
Incomplete data/metadata is related with the di-
mension group of Completeness which will affect
data discoverability and usability. A dataset that is
published in a not open format will affect the dimen-
sion group of Format and therefore harm data discov-
erability, accessibility and usability. When dataset has
no interaction tool it is prejudicial for the quality di-
mension of Interaction and will negatively affect data
discoverability and usability.
Unstructured data is intimately related with the di-
mension group represented by Consistency and will
affect data usability. The absence of a data visualiza-
tion functionality may difficult the analysis task af-
fecting the Simplicity dimension which is not good
for data discoverability, accessibility and usability.
No feedback/contact channel represents a lack of
Interaction, which is a dimension that is directly re-
lated with data discoverability and usability.
Duplicated data is quality metric of the dimen-
sion Duplicity and can influence data usability. Data
access barriers impacts the dimension called Non-
Discriminatory, affecting data accessibility. And data
with no temporal information is measured by the di-
mension group represented by Timeliness and will af-
fect data discoverability and usability.
Missing Values affects data Completeness which
is related with data discoverability and usability. A
lack of timely dataset update affects data quality di-
mension represented by Timeliness which has a neg-
ative influence on data discoverability and usability.
Dataset fragmentation and lack of granularity are
a concern of the quality dimension called Primary that
affects both data discoverability and usability.
Figure 4 presents the three broad dimensions ob-
ject of this study (discoverability, accessibility and us-
ability) in a mathematical representation of sets and
the data quality non conformities found on the se-
lected articles, placed according to their influence on
the 3 broad dimensions.
Figure 4: Data quality non conformities and their influence
on the Discoverability, Accessibility and Usability.
4 CONCLUSIONS
An effective use of open government data requires
minimum quality standards. The evaluation of such
requirements is not a trivial task. Several dimensions
have been used by authors to evaluate data quality, but
three of them cover all the aspects needed for trans-
forming a dataset into value by any stakeholder in-
volved. First, Discoverability, the user must be able
to find these dataset on the internet; second, Acces-
sibility, once found it must be accessed without bar-
riers; and finally, Usability, the user must be able to
understand and make use of this information.
Even though those three broad dimensions repre-
sent all the important aspects of data quality, to evalu-
ate them requires many others dimensions depending
on the context or the depth level required by the study.
This paper, through a systematic mapping, aimed to
describe the different dimensions used by the selected
articles to evaluate data quality regarding it´s discov-
erability, accessibility and usability, and, as already
quoted by other authors, we found that there is still no
standard or consent about the dimensions that shall be
used. And also, some dimensions are used with differ-
ent nomenclature but with related quality evaluation
objectives. For that reason we decided to group these
related dimensions and analyse how those dimension
groups affect the three broad dimensions object of this
Characterizing Open Government Data Available on the Web from the Quality Perspective: A Systematic Mapping Study
223

study. This may serve as a tool for a future standard-
ization in the field of data quality evaluation.
The evidence provided by the selected studies also
showed that the author´s main concern while doing a
data quality evaluation of a dataset is not the appli-
cation domain of those information but the analysis
itself according to the dimensions that are being used.
We also noticed that Human Observation is the ap-
proach used by most of the articles, and we believe
that´s why this approach is effective and easiest than
a semi-automatic or automatic data analysis. None
of the selected articles reported the use of a machine
learning algorithm while analysing the datasets. Data
non conformities that were cited was related most
with data discoverability and usability. Dimensions
related with the form which data is presented to the
user (Simplicity) and how the user can interact with
the dataset (Interaction) were cited by most of the ar-
ticles and should be considered while making an open
government data available to the public.
There are some threats to validity in our study.
First, our research questions may not encompass a
full study of the current state of the art of quality
evaluation of open government data available on the
web. We use the GQM approach to better define the
study objective and research questions. It is possible
that the search strings we use do not allow the iden-
tification of all studies in the area. We mitigate this
threat by expanding the number of electronic reposi-
tories searched to three. All repositories used are spe-
cific of the area of Computing. We cannot guarantee
that all relevant primary studies available in electronic
repositories have been identified. Some relevant stud-
ies may not have been covered by search strings. We
mitigate this threat by using alternative search terms
and synonyms of major terms in search strings. Each
searched electronic repository has its own search pro-
cess and we don’t know how they work or if they
work identically. We mitigate this by adapting the
search string for each electronic repository and as-
sume that equivalent logical expressions work con-
sistently across all electronic repositories used. The
studies were selected according to the defined inclu-
sion, exclusion and quality criteria, but under our
judgment. Thus, some studies may have been selected
or not selected incorrectly.
REFERENCES
Basili, V. R. and Rombach, H. D. (1988). The tame
project: Towards improvement-oriented software en-
vironments. IEEE Transactions on software engineer-
ing, 14(6).
Batini, C., Cappiello, C., and Francalanci (2009). Method-
ologies for data quality assessment and improvement.
ACM computing surveys (CSUR), 41(3).
Behkamal, B., Kahani, M., Bagheri, E., and Jeremic, Z.
(2014). A metrics-driven approach for quality assess-
ment of linked open data. Journal of theoretical and
applied electronic commerce research, 9.
Belhiah, M. and Bounabat, B. (2017). A user-centered
model for assessing and improving open government
data quality.
Brandusescu, A., Iglesias, C., Robinson, K., Alonso, J. M.,
Fagan, C., Jellema, A., and Mann, D. (2018). Open
data barometer: global report.
Chu, P.-Y. and Tseng, H.-L. (2016). A theoretical frame-
work for evaluating government open data platform.
In Proceedings of the International Conference on
Electronic Governance and Open Society: Challenges
in Eurasia.
Clapton, J., Rutter, D., and Sharif, N. (2009). Scie system-
atic mapping guidance. London: SCIE.
Dahbi, K. Y., Lamharhar, H., and Chiadmi, D. (2018). Ex-
ploring dimensions influencing the usage of open gov-
ernment data portals. In Proceedings of the 12th Inter-
national Conference on Intelligent Systems: Theories
and Applications.
Dander, V. (2014). How to gain knowledge when data are
shared? open government data from a media pedagog-
ical perspective. In Seminar. net, volume 10.
Dyb
˚
a, T. and Dingsøyr, T. (2008). Empirical studies of agile
software development: A systematic review. Informa-
tion and Software Technology, 50(9).
Group, O. G. W. (2007). Eight principles of open govern-
ment data. https://opengovdata.org/. Accessed in 20-
March-2022.
Kassen, M. (2013). A promising phenomenon of open data:
A case study of the chicago open data project. Gov-
ernment information quarterly, 30(4).
Kubler, S., Robert, J., Neumaier, S., Umbrich, J., and
Le Traon, Y. (2018a). Comparison of metadata qual-
ity in open data portals using the Analytic Hierarchy
Process. Government Information Quarterly, 35(1).
Kubler, S., Robert, J., Neumaier, S., Umbrich, J., and
Le Traon, Y. (2018b). Comparison of metadata qual-
ity in open data portals using the analytic hierarchy
process. Government Information Quarterly, 35(1).
Kubler, S., Robert, Y., Umbrich, J., and Neumaier, S.
(2016). Open data portal quality comparison using
ahp. In Proceedings of the 17th international digi-
tal government research conference on digital govern-
ment research.
Ku
ˇ
cera, J., Chlapek, D., and Ne
ˇ
cask
`
y, M. (2013a). Open
government data catalogs: Current approaches and
quality perspective. In International conference on
electronic government and the information systems
perspective. Springer.
Ku
ˇ
cera, J., Chlapek, D., and Ne
ˇ
cask
`
y, M. (2013b). Open
government data catalogs: Current approaches and
quality perspective. In International conference on
electronic government and the information systems
perspective. Springer.
WEBIST 2022 - 18th International Conference on Web Information Systems and Technologies
224

Li, X.-T., Zhai, J., Zheng, G.-F., and Yuan, C.-F. (2018).
Quality assessment for open government data in
china. In Proceedings of the 2018 10th International
Conference on Information Management and Engi-
neering.
Maali, F., Cyganiak, R., and Peristeras, V. (2010). Enabling
interoperability of government data catalogues. In
International Conference on Electronic Government.
Springer.
M
´
achov
´
a, R., Hub, M., and Lnenicka, M. (2018). Usabil-
ity evaluation of open data portals: Evaluating data
discoverability, accessibility, and reusability from a
stakeholders’ perspective. Aslib Journal of Informa-
tion Management.
M
´
achov
´
a, R. and Ln
ˇ
eni
ˇ
cka, M. (2017). Evaluating the qual-
ity of open data portals on the national level. Jour-
nal of theoretical and applied electronic commerce re-
search, 12(1).
Magalh
˜
aes, G. and Roseira, C. (2016). Exploring the bar-
riers in the commercial use of open government data.
In Proceedings of the 9th International Conference on
Theory and Practice of Electronic Governance.
Moher, D., Liberati, A., Tetzlaff, J., Altman, D. G., and
Group, P. (2009). Preferred reporting items for sys-
tematic reviews and meta-analyses: the prisma state-
ment. PLoS medicine, 6(7).
Neumaier, S., Umbrich, J., and Polleres, A. (2016). Au-
tomated quality assessment of metadata across open
data portals. Journal of Data and Information Quality
(JDIQ), 8(1).
Nikiforova, A. and McBride, K. (2021). Open government
data portal usability: A user-centred usability analysis
of 41 open government data portals. Telematics and
Informatics, 58.
Oliveira, M. I. S., de Oliveira, H. R., Oliveira, L. A., and
L
´
oscio, B. F. (2016). Open government data portals
analysis: the brazilian case. In Proceedings of the 17th
international digital government research conference
on digital government research.
Osagie, E., Waqar, M., Adebayo, S., Stasiewicz, A., Por-
wol, L., and Ojo, A. (2017). Usability evaluation of
an open data platform. In Proceedings of the 18th An-
nual International Conference on Digital Government
Research.
Sadiq, S. and Indulska, M. (2017). Open data: Quality over
quantity. International Journal of Information Man-
agement, 37(3).
Sanabria, M. A. O., Fern
´
andez, F. O. A., and Zabala, M.
P. G. (2018). Colombian case study for the analysis
of open data government: A data quality approach. In
11th International Conference on Theory and Practice
of Electronic Governance, ICEGOV ’18, New York,
NY, USA. Association for Computing Machinery.
Stone, P. (2002). Popping the (pico) question in research
and evidence-based practice. Nurs Res, 15(3).
Str
´
o
˙
zyna, M., Eiden, G., Abramowicz, W., Filipiak, D.,
Małyszko, J., and We¸cel, K. (2018). A framework
for the quality-based selection and retrieval of open
data-a use case from the maritime domain. Electronic
Markets, 28(2).
Utamachant, P. and Anutariya, C. (2018). An analysis of
high-value datasets: a case study of thailand’s open
government data. In 2018 15th international joint con-
ference on computer science and software engineering
(JCSSE). IEEE.
Vetr
`
o, A., Canova, L., Torchiano, M., and Minotas (2016).
Open data quality measurement framework: Defini-
tion and application to open government data. Gov-
ernment Information Quarterly, 33(2).
Wang, D., Richards, D., Bilgin, A., and Chen, C. (2021).
Advancing open government data portals: a compara-
tive usability evaluation study. Library Hi Tech.
Wang, V. and Shepherd, D. (2020). Exploring the extent of
openness of open government data–a critique of open
government datasets in the uk. Government Informa-
tion Quarterly, 37(1).
Wohlin, C. (2014). Guidelines for snowballing in system-
atic literature studies and a replication in software en-
gineering. 18th international conference on evalua-
tion and assessment in software engineering.
Wohlin, C., Runeson, P., H
¨
ost, M., Ohlsson, M. C., Reg-
nell, B., and Wessl
´
en, A. (2012). Experimentation in
software engineering. Springer Science & Business
Media.
Wu, D., Xu, H., Yongyi, W., and Zhu, H. (2021). Qual-
ity of government health data in covid-19: definition
and testing of an open government health data quality
evaluation framework. Library Hi Tech.
Yi, M. (2019). Exploring the quality of government open
data: Comparison study of the uk, the usa and korea.
The Electronic Library.
Zhu, X. and Freeman, M. A. (2019). An evaluation of us
municipal open data portals: A user interaction frame-
work. Journal of the Association for Information Sci-
ence and Technology, 70(1).
Zuiderwijk, A., Janssen, M., and Susha, I. (2016). Improv-
ing the speed and ease of open data use through meta-
data, interaction mechanisms, and quality indicators.
Journal of Organizational Computing and Electronic
Commerce, 26(1-2).
Characterizing Open Government Data Available on the Web from the Quality Perspective: A Systematic Mapping Study
225
