
Empirical Evaluation of BPMN Extension Language
Azeem Lodhi, Gunter Saake
a
and Klaus Turowski
Institute of Technical and Business Information Systems (ITI),
Faculty of Computer Science, University of Magdeburg,
Magdeburg, Germany
Keywords:
Business Process Modelling, Business Process Analysis, BPMN Extension, Business Process Evaluation.
Abstract:
Business process modelling is essential for knowledge management and business process improvement. Pri-
marily, business process modelling is investigated for communication between stakeholders and information
system development. On the other hand, business process performance analysis and its representation are less
investigated. Moreover, different visualization techniques present the data perspective, not the process per-
spective. As a result, enterprises find it challenging to decide where to start and what changes should be made
for improvement. This paper evaluates a BPMN extension for business process performance representation.
We evaluate different modelling patterns empirically using a case study in a company.
1 INTRODUCTION
Global socio-economic changes and technological de-
velopments bring new opportunities and threats for
enterprises. Different mergers, standardization ini-
tiatives and best practices are common in this com-
petitive environment (Bider and Lodhi, 2020). Pro-
cess understanding and its evaluation are crucial steps
for process standardization and improvement in enter-
prises (Reijers, 2021). For this purpose, business pro-
cess modelling is widely used for the graphical rep-
resentation of processes and communication between
different stakeholders.
In enterprises, different silo systems exist that sup-
port fragmented parts of business processes. In prac-
tice, the communication between silos is not seamless
and hinders the smooth execution of business pro-
cesses. Different other applications, interfaces and
macros are used to fulfil this task. The situation is
more challenging in larger organizations at the manu-
facturing level, where process chains are lengthy, and
most of the processes are executed manually as dis-
cussed in (Lodhi et al., 2018). Different customized
applications support these processes. As a result, en-
terprises find it challenging to decide where to start
and what changes should be implemented for im-
provement. Complexity in a business process is due to
various factors like inter-dependencies between activ-
ities, stakeholders, involved elements, attributes, and
a
https://orcid.org/0000-0001-9576-8474
applications.
Business process models can be annotated with
performance information which can be used to iden-
tify deficiencies. In practice, annotation-based mod-
els are used; however, they are not designed for
this purpose and do not sufficiently support the post-
execution analysis and improvement of business pro-
cesses (del R
´
ıo-Ortega et al., 2019). Therefore, the
gap will occur when existing models are used for eval-
uation and improvement, as these models will not pro-
vide complete details. Therefore, there is a need to
fulfil this gap and offer process models for business
process improvement (evaluation and analysis).
Performance evaluation with business process
model is undermined research area. Our goal is to ad-
dress this challenge and focus on the relationship be-
tween evaluation of business processes and their rep-
resentation at the process level. For this purpose, we
proposed the modelling constructs for performance
evaluation by extending BPMN modelling language.
Furthermore, we evaluate the proposed extension em-
pirically in a company. Finally, we discuss the limi-
tation of our case study and the results in this paper’s
discussion part. At the end, we conclude our paper
and provide the outlook of the research.
Lodhi, A., Saake, G. and Turowski, K.
Empirical Evaluation of BPMN Extension Language.
DOI: 10.5220/0011590700003335
In Proceedings of the 14th International Joint Conference on Knowledge Discovery, Knowledge Engineering and Knowledge Management (IC3K 2022) - Volume 3: KMIS, pages 239-247
ISBN: 978-989-758-614-9; ISSN: 2184-3228
Copyright
c
2022 by SCITEPRESS – Science and Technology Publications, Lda. All rights reserved
239

Descriptive
Analytics
Data Mining
Predictive Analytics
Prescriptive
Analytics
What has
happened?
What is
happening?
Why did it
happen?
What will
happen?
What should
happen?
Business Value
Complexity
ControlForecasting
Offline
Machine
Learning
Online
Reporting
Reporting
Figure 1: Business Analytics with Value.
2 BUSINESS PERFORMANCE
ANALYSIS
Different information systems play an essential role
in business process execution, like ERP (enterprise
resource planning) systems and MES (manufacturing
execution system) (Lodhi et al., 2018). These sys-
tems record the interaction between humans, business
objects (materials), and organisational elements (ma-
chines) and also store other data (like process/product
quality during their execution. Information systems
has undergone various research disciplines like infor-
mation system development (requirement engineer-
ing, software engineering, graphical models), data
management (data modelling, data storage, ware-
house systems), and then later for knowledge manage-
ment (like data mining, knowledge documentation).
Evaluation of business processes is vital for the
analysis and improvement of an organisation. Infor-
mation systems provide excellent means to record and
extract performance details. They provide quantita-
tive (like operating time, overall cost) and qualita-
tive (like first pass yield, satisfaction of customers
and employees) aspects of the process. These eval-
uation attempt to answer business questions as shown
in Figure 1. Here, the focus is on two types of analyt-
ics such as descriptive and predictive analytics, often
known as business intelligence technologies. Figure 1
is adopted from (Davenport and Harris, 2007; Ecker-
son, 2007; Lustig et al., 2010). However, mere data
perspective is not enough for operational improve-
ments in the business.
The knowledge extracted by descriptive and pre-
dictive analytics must be applied in business opera-
tions. The prescriptive analytics attempts to find the
answer which changes should be carried out to get
the desired results, as shown in Figure 1. In order
to carry out such changes, users are interested in the
performance details of processes in an organisation.
These details are necessary in order to identify defi-
ciencies and improve processes. Therefore, a deep
understanding of processes is required for improve-
ment purposes (Klimecka-Tatar, 2021). The field fo-
cusing on process analysis is known as business pro-
cess intelligence (van der Aalst, 2016; Grigori et al.,
2004). The post-execution analysis of business pro-
cesses uses the results of the evaluation phase and
analyse the performance of business processes in a
broader context. In this phase, focus shifts toward
process aspects and their performance rather than data
perspective as in the evaluation phase.
The knowledge is presented to end-users using
different methods and visualisation techniques. Most
of the modelling methods address only the needs
of information system development purposes. This
view is also strengthened by a study (Alotaibi, 2016),
where authors review papers over 13 years. The au-
thor positions different process modelling tools and
techniques only till the execution phase of the busi-
ness process lifecycle. Therefore, business process
modelling has to be investigated for adequate repre-
sentations of business processes, especially after exe-
cution. We address the main research challenge in this
paper to provide representational support for business
process improvement. The research question (RQ) is
stated as follows.
RQ: How to represent the knowledge and
performance of a business process in order to
improve them?
3 MODELLING PATTERNS FOR
PERFORMANCE ANALYSIS
We considered the limitation of modelling languages
for performance analysis in (Lodhi et al., 2011). We
follow the principles of diagram notations defined
in (Moody, 2009) to improve the process performance
visualization in (Lodhi et al., 2014; Lodhi et al.,
2018). To accommodate different requirements, we
combine constructs to build models for analysis from
different perspectives and call them as patterns. Dif-
ferent allowed combinations are explained here which
also define the method of constructing the models in
a particular way. Depending on the user’s require-
ments, models are built at different levels of granu-
larity to facilitate the understanding of processes. In
the following, we describe these patterns briefly and
provide their representation by extending Business
Process Model and Notation (BPMN) (OMG, 2014)
KMIS 2022 - 14th International Conference on Knowledge Management and Information Systems
240

Table 1: Pattern and Characteristics.
Evaluation Pattern Purpose Constructs
Time Pattern analyse the performance of resources and
activities with respect to time
Swimlanes, activities
Cost Pattern analyse the performance from the cost per-
spective like material and resources
Swimlanes, activities,
colours
Path Pattern To understand the activities which will be
fruitful
Edges, activities,
colours
Colours Pattern To represent which activities are distinct in
a process
Activities, swimlanes,
connecting objects
History Pattern To understand which activities are fre-
quently executed in process
Edges, thickness, activ-
ities
Information Pattern To provide further information along busi-
ness process models
Gateway with rules,
contents
Low
Medium
High
Operating time
Low
Medium
High
Idle time
A
A
Low
Medium
High
Cycle
time
A
Figure 2: Process Model in the Time Dimension.
Low
Medium
High
Operating
cost
Low
Medium
High
Delay cost
A
A
Low
Medium
High
Fixed cost
A
Figure 3: Process Model in Cost Dimension.
(which is a ISO standard (ISO19510, 2013)) as an ex-
ample modelling language.
3.1 Time Pattern
The time dimension is an essential factor in business
process analysis. In this pattern, we focus on repre-
senting the process element’s performance from time
perspective like idle time and operating time. It is
interesting to know for process analysis which activi-
ties are time intensive or take much time in execution.
Different classes can be used for this alignment and
categorization. Such alignment can identify the defi-
ciencies in predecessor activities to improve the effi-
ciency of the successor activity. This pattern is shown
in Figure 2 using BPMN Swimlanes.
3.2 Cost Pattern
Cost is also a vital factor in business process anal-
ysis. This pattern observes the performance of pro-
cess elements from cost and other related aspects like
material and other resources. Like time pattern, pro-
cess elements can be classified like high cost, medium
and low cost. Similarly, process elements can also be
grouped or aligned based on the cost incurred by them
as shown in Figure 3.
3.3 Path Pattern (Time-cost Dimension)
The time-cost analysis is helpful in deciding which
activities should be further investigated. The activi-
ties together create a path of process execution which
may not be that efficient or beneficial for an organiza-
tion. In the case of different possible paths, a path can
be defined as a best practice which contributes to the
organizational goals with limited expenses (in terms
of time and costs). This path can be distinguished
from other paths using different techniques (like size
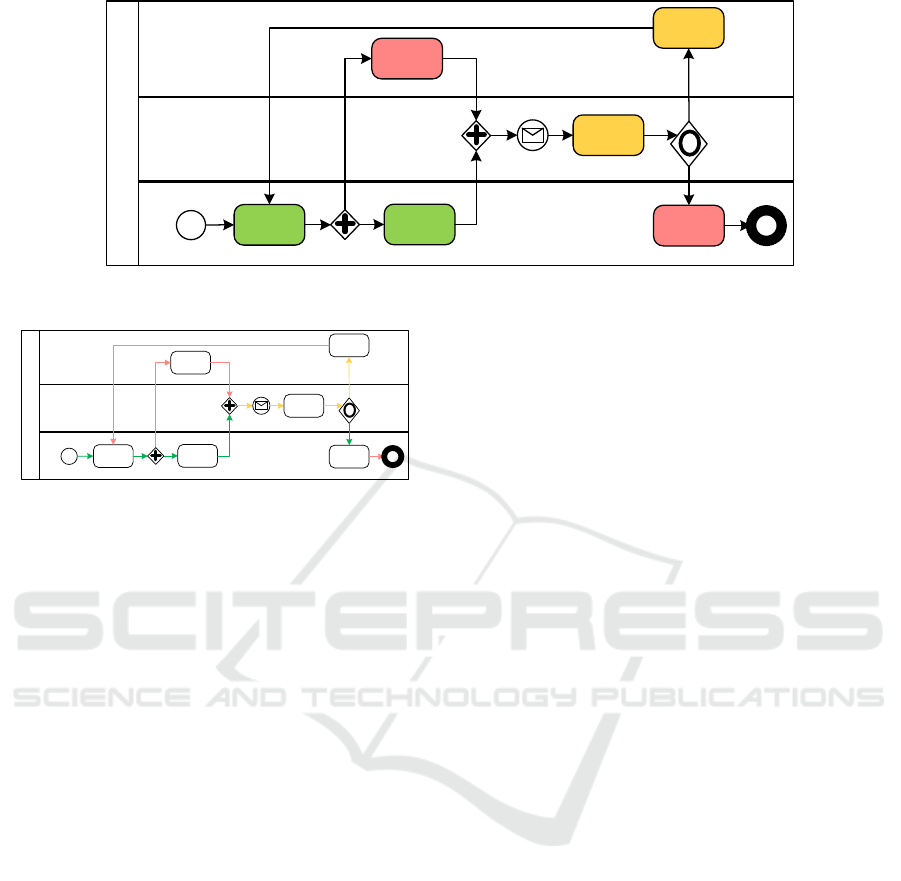
and colour as shown in Figure 6). Similarly, difficult
paths (incurring costs and problems) can also be dis-
tinguished from the other paths. The time and cost di-
mensions in this pattern are just an example of some
dimensions influencing the path pattern; it can also be
different from other dimensions as well like the or-
ganizational dimension and quality dimension which
define the success of business process executions.
3.4 Colour Pattern
Colours have a significant cognitive effect on percep-
tion and analysis. For example, red colour is noticed
quickly by users. The classes can be codified into
colours to distinguish the performance of process el-
ements in process executions. Different colours indi-
cate the effect of the business objects, like green for
optimal cost, yellow for high cost, and red for a very
high cost. A legend is necessary for such representa-
tions as a reference.
In this pattern, swimlanes can also be coloured as
shown in Figure 4. Different activities can also be
coloured based on their performance to highlight as
represented in Figure 5. Similarly, the paths can also
Empirical Evaluation of BPMN Extension Language
241

Lane1
Lane2
Lane3
Pool
A
C
B
F
D
E
Lane1
Lane2
Lane3
Pool
Lane1
Lane2
Lane3
Pool
A
C
B
F
D
E
Lane1
Lane2
Lane3
Pool
A
C
B
F
D
Quality=’unsatisfied’
Quality=’satisfied’
E
Lane1
Lane2
Lane3
Pool
A
C
B
F
D
Quality=’unsatisfied’
Quality=’satisfied’
E
65% Cases
Attribute values
Attr. 1 = x
Attr. 2 = y
material
Lane1
Lane2
Lane3
Pool
A
C
B
F
D
Quality=’unsatisfied’
Quality=’satisfied’
E
Logistics
Figure 4: Swimlanes in Colour.
be coloured as discussed in the previous section.
3.5 History Pattern
History pattern represents which process elements are
interesting from a statistical point of view in pro-
cess execution. For example, elements are often exe-
cuted and which path is taken in most process execu-
tions. This pattern can be represented in modelling
languages using specific constructs (like shape and
size) or represented as additional information.
3.6 Information Pattern
Different decisions are made in process executions.
These decisions are implicitly represented in program
logic or explicitly stated in the documentation. Infor-
mation pattern provides performance-related or deci-
sion related data as text on a process model. Process
states, conditions and rules about process control, and
different statistical measures can be added to a pro-
cess model when we use this pattern. In process ex-
ecution, the explicit representation will help users to
understand the rationale behind these decisions. For
example, BPMN artefacts or text boxes can describe
the condition near the control elements.
The proposed patterns, their elements, and mean-
ings are summarized in Table 1. In these patterns,
different other attributes of the dimensions can be
added and correspondingly represented using our pro-
posed modelling language and its cognitive aspects
(like colour, shape, and size). This extension serves
not only for evaluation and improvement purposes but
also for knowledge management purposes like train-
ing new employees and knowledge transfer.
4 EMPIRICAL EVALUATION
USING CASE STUDY
This paper presents the empirical evaluation of our
proposed modelling language. Furthermore, in this
empirical study, we also assess the understandability
aspects of the proposed extension, i.e. how well it is
perceived and understood by the users. In such eval-
uations, feedback from the participants is collected
over the presented content. In this case study, we fol-
low certain aspects of the Quality Framework as de-
fined in ISO/IEC 25010:2011 (ISO2011, 2011) (last
reviewed and confirmed in 2017, based on older ver-
sion ISO/IEC 9126 (ISO2001, 2001)), such as func-
tional suitability (functional appropriateness), usabil-
ity (learnability) and maintainability (analyzability).
We take them as evaluation criteria and ask partici-
pants for feedback from these perspectives. Although
such empirical evaluations provide valuable insights,
however, they are time-consuming.
4.1 Questionnaire Design
We considered a real-world simple production pro-
cess for the questionnaire and presented it to the par-
ticipants via a web link (Questionnaire Link, 2022).
The questionnaire design is divided into four parts. In
the first part of the questionnaire, general information
is collected. The second part of the questionnaire fo-
cuses on participants’ professional experience.
The third part of our questionnaire is the cen-
tral part introducing a simple organizational process.
This part describes the production scenario of product
manufacturing in an organization using the BPMN.
Here, the focus is to compare two methods for analy-
sis and improvement of a business process. The first
method uses traditional graphical charts, whereas the
second method is a short demonstration of our pro-
posed extensions of BPMN representation) as pre-
sented in Section 3. In this Section, we ask five main
questions, each focusing on a particular pattern and its
comparison to the traditional approach. To get feed-
back from the participants, we applied a four-level
Likert scale (Joshi et al., 2015), ranging from very
dissatisfied (score 1) to very satisfied (score 4).
The fourth part of the questionnaire focuses on
participant feedback on proposed modelling patterns
based on criteria like understandability, support in
decision-making, application in other areas and orga-
nizational hierarchy level. For this purpose, we again
ask five questions as of our proposed patterns, further
containing sub-questions from four mentioned crite-
ria to evaluate them from these perspectives (score 1
as strongly disagree to score 4 as strongly agree).
4.2 Conduction of Case Study
In the empirical study, 38 participants from differ-
ent organizations and domains have participated. We
conducted the empirical study in two separate groups
by presenting the same questionnaire. The first group
KMIS 2022 - 14th International Conference on Knowledge Management and Information Systems
242
Lane1
Lane2
Lane3
Pool
A
C
B
F
D
E
Lane1
Lane2
Lane3
Pool
Lane1
Lane2
Lane3
Pool
A
C
B
F
D
E
Lane1
Lane2
Lane3
Pool
A
C
B
F
D
Quality=’unsatisfied’
Quality=’satisfied’
E
Lane1
Lane2
Lane3
Pool
A
C
B
F
D
Quality=’unsatisfied’
Quality=’satisfied’
E
65% Cases
Attribute values
Attr. 1 = x
Attr. 2 = y
material
Lane1
Lane2
Lane3
Pool
A
C
B
F
D
Quality=’unsatisfied’
Quality=’satisfied’
E
Logistics
Figure 5: Activities in Colour.
Lane1
Lane2
Lane3
Pool
A
C
B
F
D
E
Lane1
Lane2
Lane3
Pool
Lane1
Lane2
Lane3
Pool
A
C
B
F
D
E
Lane1
Lane2
Lane3
Pool
A
C
B
F
D
Quality=’unsatisfied’
Quality=’satisfied’
E
Lane1
Lane2
Lane3
Pool
A
C
B
F
D
Quality=’unsatisfied’
Quality=’satisfied’
E
65% Cases
Attribute values
Attr. 1 = x
Attr. 2 = y
material
Lane1
Lane2
Lane3
Pool
A
C
B
F
D
Quality=’unsatisfied’
Quality=’satisfied’
E
Logistics
Figure 6: Connecting Objects in Colour.
is from one particular organization (manufacturing
company, referred as Case Study 1). Although we
asked more than 30 participants in the first group to
fill out the questionnaire, only 14 participants pro-
vided their feedback. The same questionnaire was
asked to the second group (referred as Case Study 2),
which was very generic as it was intended for profes-
sionals from different companies, academic staff, and
students. In this group, 24 participants filled out the
questionnaire. In this group, five students participated
as well. In (H
¨
ost et al., 2000; Svahnberg et al., 2008),
authors have shown that students are a proper substi-
tute for professionals in empirical studies as they will
be future professionals. For the sake of space con-
straints in this paper, we discuss only the results of
the first case study (i.e. in a company).
4.3 Analysis Method
In order to analyse responses and test our hypothe-
sis, we used Wilcoxon signed-rank test from inferen-
tial statistics. Wilcoxon test is used if the experiment
participants are low (Gehan, 1965; Hollander et al.,
2013), as is the case in our case study. Since we do not
have a large set of responses, we use statistical infer-
ence to infer the characteristics of different analysts
based on the responses we have received in this case
study. We want to analyse the scores of participants
by comparing the two methods. For this purpose, we
made null and alternative hypotheses related to our
patterns. Then, based on the participant’s feedback,
we test our hypothesis.
H
q
0
: µ ≤ δ
with the alternative hypothesis
H
q
1
: µ > δ ,
where δ describes the median in a survey question q.
H0: There is no significant difference be-
tween these two approaches (traditional and extended
BPMN) from a particular perspective.
H1: There is a significant difference between
these two approaches from the a particular perspec-
tive.
We will use the Wilcoxon signed-rank test as it is
used to compare two sets of scores that came from
the same participants. This method is more powerful
than the sign test as it uses the magnitudes of the dif-
ferences rather than just their signs. The Formula of
Wilcoxon signed-rank method is as follows
W =
N
r
∑
i=1
[sgn[x
2,i
− x
1,i
) · R
i
] (1)
5 RESULTS OF THE CASE STUDY
For the sake of space constraints in this paper, we skip
the demographical information of participants and fo-
cus on the survey results. We divide the results into
two parts. The first is the comparison between the
traditional approach and our proposed extension. The
second part is the questionnaire results that evaluate
the proposed extensions from different perspectives.
5.1 Time Perspective Comparison
From the time perspective, we wanted to test the null
and alternative hypothesis as mentioned above. Based
on the feedback from the participants, there is a sig-
nificant difference between these two approaches, as
concluded by Wilcoxon signed-rank test as mentioned
Empirical Evaluation of BPMN Extension Language
243
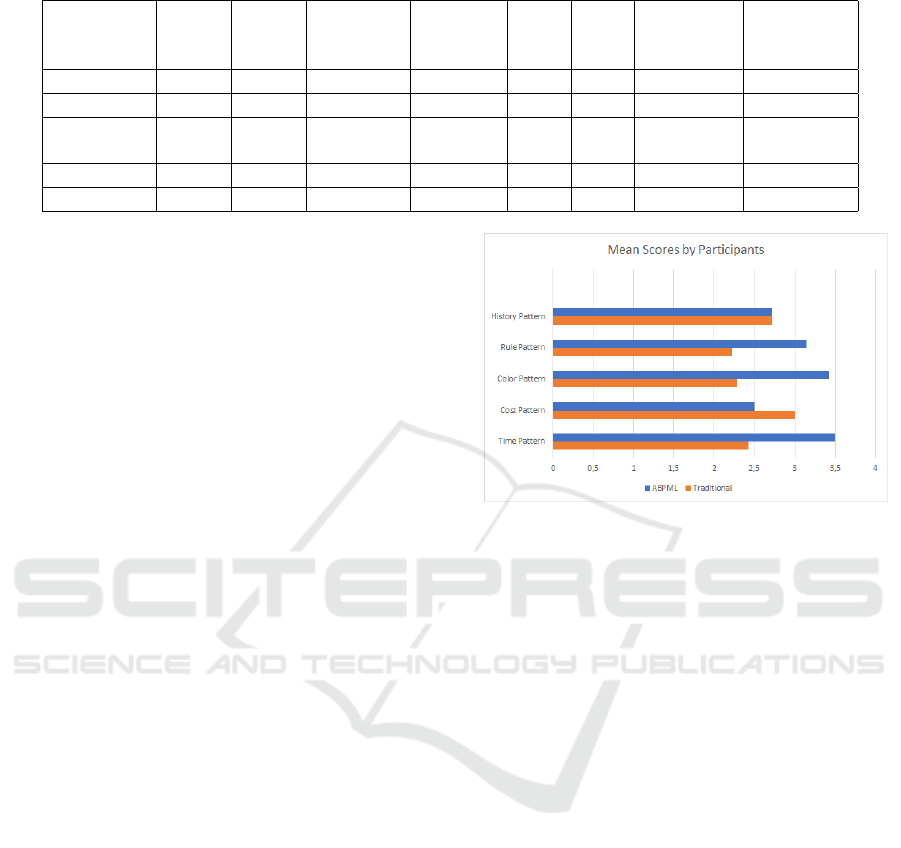
Table 2: Case Study 1: Descriptive and Inferential Statistics of Two Methods.
Patterns
& Values
W+ W- W (n) p-value H0 H1 Average
Rating
Trad.
Average
Rating
ABPML
Time 4.5 73.5 13 (12) 0.0068 0 1 2.42 3.5
Cost 36 9 5 (9) 0.11 1 0 3 2.5
Time-Cost
(Colour)
3.5 74.5 13 (12) 0.005 0 1 2.29 3.43
Rule 4 62 10 (11) 0.01 0 1 2.21 3.14
History 18 18 3 (8) 1 1 0 2,71 2,71
in Table 2. This is also confirmed by the descriptive
statistics method where an average rating of ABPML
is 3.5, which is above than satisfied level. In contrast,
the traditional method got an average score of 2.42.
5.2 Cost Perspective Comparison
From the cost perspective, participants responded
with mixed feedback on these methods. The feed-
back is also shown in Table 2. Based on Wilcoxon
signed-rank method, there is no significant difference
between these two approaches. However, based on
the descriptive statistics, it can be seen that most
of the participants showed satisfactory behaviour to-
wards the traditional approach. The results show that
the average score of the traditional method is more
than the ABPML. We will discuss these results fur-
ther in Section 6 of this paper.
5.3 Time-cost Perspective Comparison
In this pattern, we combine different KPIs and repre-
sent them in colours. The feedback from the partici-
pants and their corresponding Wilcoxon signed-rank
test is shown in Table 2. Since our test statistics is less
than the critical value, we can reject the null hypoth-
esis; that is, there is a significant difference between
these two approaches. It is also supported by p value
that is less than 0.05.
5.4 Rule Perspective Comparison
From the rule perspective, the participants’ feedback
and their corresponding Wilcoxon signed-rank test is
shown in Table 2. Since our test statistic is less than
the critical value, therefore, we reject the null hypoth-
esis. This is also supported by the p-value. Based
on this feedback, we can conclude that there is a sig-
nificant difference between these two approaches and
end-users like the explicit representation of rules.
Figure 7: Case Study: Mean Scores of Two Methods.
5.5 History Perspective Comparison
Representing history in ABPML also got mixed
responses like cost perspective, where participants
showed almost the same feedback. The Wilcoxon
signed-rank method and its result for the history pat-
tern is shown in Table 2.
The positive and negative signed-ranks got iden-
tical scores, and our test statistic is not less than the
critical value; therefore, we accept null hypothesis.
The overall summary of patterns with Wilcoxon
scores and their hypothesis is already summarized in
Table 2. The mean score of each pattern with respect
to traditional and proposed approaches is shown in
Figure 7. The coding of values with their categorical
score was discussed in Section 4.1, where we men-
tioned the score 1 as very dissatisfied and the score 4
as very satisfied.
5.6 Feedback over Patterns
The fourth part of the questionnaire evaluates patterns
from the participants’ viewpoint. We evaluate the pat-
terns based on four criteria: understandability, sup-
port for decision-making (for correct and timely deci-
sions), ability to apply in different domains or areas,
and support at different managerial levels (like aggre-
gating values on different levels).
KMIS 2022 - 14th International Conference on Knowledge Management and Information Systems
244

The time pattern is rated very high in all men-
tioned criteria compared to all other patterns. All
participants agreed that it was easy to understand.
Similarly, more than 90% of participants agreed that
it helps in decision-making and flexibility to apply
in different domains. On its usage at different lev-
els, participants were divided as 65% of participants
agreed that it can be used at different managerial lev-
els; however, at the same time, 35% disagreed with
that perspective.
The cost pattern also got more than 90% of agree-
ment on the understandability perspective. Regarding
decision-making support, 78% of participants were
satisfied with that perspective. However, more than
50% of participants disagreed with its ability to apply
in different areas and its usage at different managerial
levels (precisely 71% of participants). We will dis-
cuss their feedback and reasons later in Section 6 of
this paper.
The time-cost pattern with colour representation is
also appreciated by the participants as all participants
agreed on its understandability perspective (57% with
strongly agreed feedback). More than 90% of partic-
ipants agreed on its ability for decision-making (50%
with strongly agreed feedback). In addition, 78% of
participants agreed upon its ability to apply in differ-
ent domains. However, 57% of participants disagreed
on its ability to apply at different managerial levels.
The rule perspective also received similar feed-
back as the time-cost pattern where all participants
agreed the perspective of understandability. Similarly,
more than 90% agreed on its ability for decision-
making, however, only 42% strongly agreed. The
feedback of 71% of participants favoured its applica-
bility in different areas, whereas 28% of participants
disagreed. More than 60% of participants disagreed
with its applicability at different managerial levels as
underlying rules and regulations will be complex in
representation.
From the understandability point of view, all par-
ticipants agreed on the history pattern as it is easy to
understand. More than 78% of participants favoured
its support in decision-making, whereas 21% dis-
agreed in this perspective. We received mixed re-
sponses in other criteria as well. For example, 57% of
participants agreed, while the same percentage have
disagreed on its applicability in different domains at
managerial levels.
6 DISCUSSION
The case study was carried out in a company where
participants had experience with different evaluation
techniques and production environments. We have re-
ceived feedback from different participants not only
about the method but also about the questionnaire. In
addition, some feedback was related to questions and
the terms, such as their definitions and the method
used. We discuss the results and the feedback in the
following.
The time pattern received the most positive feed-
back compared to other patterns, as can be seen from
the Wilcoxon scores and mean value. Aligning ac-
tivities in time dimension based on their KPIs make
the analysis easier, especially in understanding the re-
lationship with other activities. Other methods like
Pareto charts and Gantt charts can also be used for
this purpose. However, these representations do not
show the relation of activities with one another. This
provides us with the first justification of the limitation
of existing methods and representational benefits of
our proposed extension for analysis and improvement
of a business process.
Regarding cost pattern, no statistically significant
difference could be observed by the feedback of par-
ticipants, as shown in the results. The cost pat-
tern receives the highest dissatisfaction scores of our
proposed patterns. Since the response data “points
towards” the positive influence of the traditional
method, it means that participants are comparatively
satisfied with traditional analysis methods from a cost
perspective. This raises the question of whether there
is no impact on the proposed pattern at all or if there
can be another way to explain the missing impact. To
this end, a detailed look at the scenario example and
feedback from a few participants provide a plausible
explanation: Cost is always related to some values
with activities. In our questionnaire, it is related to
some categories like low, high, and medium. How-
ever, it was not mentioned about the definition of cat-
egories and their thresholds. Whereas in a traditional
method, it can be quantified and analyse each activity
accordingly.
Similarly, one feedback was that production pro-
cess activities are too broad in their abstraction. These
activities can be further specified and their corre-
sponding cost can be assigned. Once they are at
the detail level with cost, then the proposed cost pat-
tern can show a better advantage over the traditional
method. However, abstraction and specification of ac-
tivities can also be related to the evaluation of patterns
themselves, where it is least rated that the pattern can
be applied on different managerial levels. Therefore,
a further demonstration of cost and hierarchy levels is
required.
After the time pattern, most positive feedback is
received to the colour pattern. Colour is an important
Empirical Evaluation of BPMN Extension Language
245
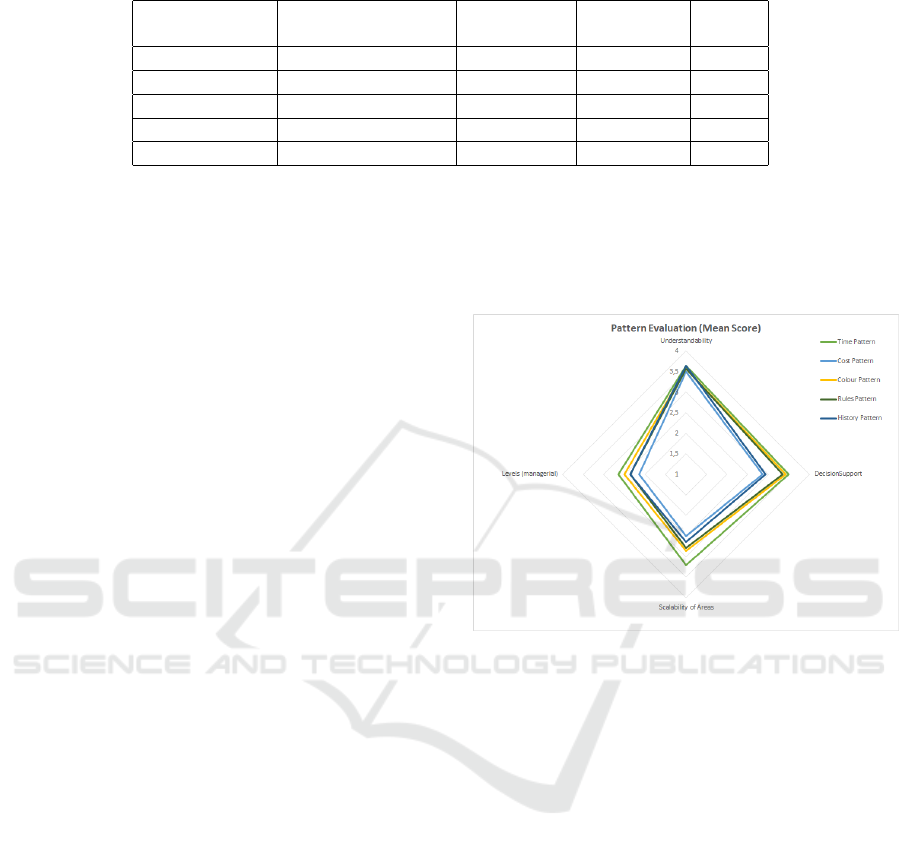
Table 3: Case Study 1: Evaluation of Patterns under Quality Criteria.
Patterns Understandability Decision
Support
Scalability Levels
Time Pattern 3.64 3.5 3.21 2.64
Cost Pattern 3.5 2.86 2.5 2.14
Colour Pattern 3.57 3.43 2.86 2.5
Rules Pattern 3.57 3.36 2.79 2.36
History Pattern 3.64 2.93 2.64 2.36
element in visualizations, as represented in different
cock-pit or dashboard charts. Aligning activities in
one perspective (roles, time) and representing colours
for other dimensions (like cost) is positively rated.
Activities can be highlighted with different colours
to get attention based on their performance. This is
also interesting from an analytical perspective as it is
considered one of the limitations of BPMN. Techno-
logical development (from a hardware and software
perspective) encourages using colours as a standard
in business process models (rather than merely black-
white representations).
When we traditionally describe rules and condi-
tions, most of the participants are not satisfied. On the
other hand, the explicit description of rules in process
models for analysis and improvement is appreciated
by participants, as discussed in Section 5. Moreover,
we provide additional information on model edges,
which is a better way to explain why a particular path
is taken. However, if models are at an abstract level,
then the description of underlying rules and condi-
tions could be challenging.
The history pattern received mixed feedback from
the participants, and no significant difference was ob-
served between these two methods. One possible rea-
son for no significant difference is the same as of cost
pattern; that is, the process model is too easy and
small so that no benefits can be foreseen as communi-
cated by the end-user in feedback. On the other hand,
the increased number of activities and complexity can
help to present the limitation of traditional methods
or the benefits of new proposed patterns. Similarly, a
legend can explain the relationship between the thick-
ness of connectors and the frequency of their activities
if there are different thickness of arrows that exists in
the process.
In Table 3, we summarize the mean score of pat-
terns evaluation of the case study (here 1 is strongly
disagree, and 4 as strongly agree as discussed in Sec-
tion 4.1). These are correspondingly represented in
Radar chart in Figure 8. It can be seen that all pat-
terns are suitable for understanding the point of view.
Time, colour, and rule patterns are also good for pro-
viding decision support. However, time and colour
patterns are rated high in application in different ar-
eas. In contrast, all patterns have less mean scores to
be applied at different managerial levels. The reason
is again the same as we discussed in the case of cost
and history pattern; that process is too simple in the
case study.
Figure 8: Case Study 1: Mean Scores of Patterns Evalua-
tion.
Our empirical evaluation and its case studies face
certain limitations. The example process introduced
in the case study was small and simple without involv-
ing many activities and different levels. Due to this,
the benefits of the proposed modelling language were
not apparent in cost and history patterns. A detailed
process with more activities and aggregation levels
can help to evaluate the proposed modelling language
better.
Since most of the patterns are rated well (like time,
colour pattern, rule), therefore, it will be adapted as a
standard in modelling business process for analysis
and improvement with a performance perspective at a
certain point.
Before the empirical evaluation, we assumed that
traditional methods are insufficient, especially from
a time and cost perspective. However, empirical re-
sults did not statistically confirm the developed hy-
pothesis. Instead, the results show that most partici-
pants favoured the traditional method in cost dimen-
sion analysis and history perspective. Similarly, we
thought our proposed model extension is very helpful
KMIS 2022 - 14th International Conference on Knowledge Management and Information Systems
246

for analysis and improvement; however, the experts
see the need for data preparation work and tool sup-
port as necessary step for its realization.
7 CONCLUSIONS & OUTLOOK
In this paper, we have propagated the demand for
modelling language to analyse and improve the busi-
ness process. The modelling language is not only
necessary for the performance perspective of business
processes but also knowledge management. We pro-
posed the extension of the BPMN modelling language
for this purpose. We also evaluate the proposed exten-
sion on empirical basis. The feedback collected from
the experiments will be accommodated in further im-
provement of the proposed modelling language. We
also want to extend the proposed modelling language
with other constructs. Similarly, it has to be evalu-
ated in different organization, their processes, and the
general public. This will further improve the effec-
tiveness of proposed extension.
REFERENCES
Alotaibi, Y. (2016). Business Process Modelling Challenges
and Solutions: A Literature Review. Journal of Intel-
ligent Manufacturing, 27(4):701–723.
Bider, I. and Lodhi, A. (2020). Moving from Manufactur-
ing to Software Business: A Business Model Trans-
formation Pattern. In Filipe, J.,
´
Smiałek, M., Brodsky,
A., and Hammoudi, S., editors, Enterprise Informa-
tion Systems, pages 514–530, Cham. Springer Inter-
national Publishing.
Davenport, T. H. and Harris, J. G. (2007). Competing on An-
alytics: The New Science of Winning. General Man-
agement. Harvard Business School Press.
del R
´
ıo-Ortega, A., Resinas, M., and Ruiz-Cort
´
es, A.
(2019). Business Process Performance Measurement,
pages 416–422. Springer International Publishing,
Cham.
Eckerson, W. (2007). Predictive Analytics. Extending the
Value of Your Data Warehousing Investment. Techni-
cal Report Q1, TDWI Best Practices.
Gehan, E. A. (1965). A Generalized Wilcoxon Test
for Comparing Arbitrarily Singly-Censored Samples.
Biometrika, 52(1-2):203–224.
Grigori, D., Casati, F., Castellanos, M., Dayal, U., Sayal,
M., and Shan, M.-C. (2004). Business Process Intelli-
gence. Computers in Industry, 53(3):321–343.
Hollander, M., Wolfe, D., and Chicken, E. (2013). Non-
parametric Statistical Methods. Wiley Series in Prob-
ability and Statistics. Wiley.
H
¨
ost, M., Regnell, B., and Wohlin, C. (2000). Using Stu-
dents as Subjects - A Comparative Students and Pro-
fessionals in Lead-Time Impact Assessment. Empiri-
cal Software Engineering, 5(3):201–214.
ISO19510 (2013). ISO/IEC 19510:2013 Information tech-
nology - Object Management Group Business Pro-
cess Model and Notation reviewed 2022. Standard,
https://www.iso.org/standard/62652.html. The Inter-
national Organization for Standardization.
ISO2001 (2001). ISO/IEC 9126-1:2001 Software Engineer-
ing - Product Quality -Part 1: Quality Model. The
International Organization for Standardization.
ISO2011 (2011). ISO/IEC25010: 2011 Systems and Soft-
ware Engineering–Systems and Software Quality Re-
quirements and Evaluation (SQuaRE)–System and
Software Quality Models. The International Organi-
zation for Standardization.
Joshi, A., Kale, S., Chandel, S., and Pal, D. K. (2015). Lik-
ert scale: Explored and explained. British Journal of
Applied Science and Technology, 7:396–403.
Klimecka-Tatar, D. (2021). Analysis and Improvement of
Business Processes Management – Based on Value
Stream Mapping (VSM) in Manufacturing Com-
panies. Polish Journal of Management Studies,
23(2):213–231.
Lodhi, A., K
¨
oppen, V., and Saake, G. (2011). Business
Process Modeling: Active Research Areas and Chal-
lenges. Technical Report 1, University of Magdeburg.
Lodhi, A., K
¨
oppen, V., Saake, G., and Turowski, K. (2018).
Streamlining Processes for Digitalization. In 11th
IADIS International Conference Information Systems
2018, IADIS Series, pages 95–104, Lisabon, Portu-
gal. International Association for Development of the
Information Society IADIS.
Lodhi, A., K
¨
oppen, V., Wind, S., Saake, G., and Turowski,
K. (2014). Business Process Modeling Language for
Performance Evaluation. In 2014 47th Hawaii Inter-
national Conference on System SciencesHICSS, vol-
ume 00, pages 3768–3777.
Lustig, I., Dietrich, B., Johnson, C., and Dziekan, C. (2010).
The Analytics Journey: An IBM View of the Struc-
tured Data Analysis Landscape: Descriptive, Predic-
tive and Prescriptive Analytics. INFORMS Analytics
Magazine, pages 11–18.
Moody, D. (2009). The Physics of Notations: Toward a
Scientific Basis for Constructing Visual Notations in
Software Engineering. IEEE Transactions on Soft-
ware Engineering, 35(6):756–779.
OMG (2014). Business Process Model
and Notation (BPMN), Version 2.0.2.
http://www.omg.org/spec/BPMN/2.0.2.
Questionnaire Link (2022). BPMN Extension Survey Ques-
tionnaire. https://tinyurl.com/abpmlquestionnaire.
Reijers, H. A. (2021). Business Process Management: The
Evolution of a Discipline. Computers in Industry,
126(C).
Svahnberg, M., Aurum, A., and Wohlin, C. (2008). Using
Students as Subjects - an Empirical Evaluation. In
Proceedings of the Second ACM-IEEE International
Symposium on Empirical Software Engineering and
Measurement, ESEM ’08, pages 288–290, New York,
NY, USA. Association for Computing Machinery.
van der Aalst, W. M. (2016). Process Mining: Data Science
in Action. Springer Berlin Heidelberg.
Empirical Evaluation of BPMN Extension Language
247
