
An Interaction Effort Score for Web Pages
Juan Cruz Gardey
1,2
, Juli
´
an Grigera
1,2,3
, Andr
´
es Rodr
´
ıguez
1
, Gustavo Rossi
1,2
and Alejandra Garrido
1,2
1
LIFIA, Facultad de Inform
´
atica, Universidad Nacional de La Plata, Argentina
2
CONICET, Argentina
3
CICPBA, Argentina
Keywords:
User Interaction, User Experience, UX Refactoring, A/B Testing.
Abstract:
There is a lack of automatic evaluation models to measure the user experience (UX) of online systems, espe-
cially in relation to the user interaction. In this paper we propose the interaction effort score as a factor that
contributes to the measure of the UX of a web page. The interaction effort is automatically computed as an
aggregation of the effort on each interactive widget of a page, and for all users that have interacted with them.
In turn, the effort on each widget is predicted from different micro-measures computed on the user interaction,
by learning from manual UX expert ratings. This paper describes the evaluation of the interaction effort of
different web forms, and how it compares to other metrics of usability and user interaction. It also shows
possible applications of the interaction effort score in the automatic evaluation of web pages.
1 INTRODUCTION
Although there are different definitions of User Ex-
perience (UX), the most accepted one considers two
main aspects: the hedonic factors that influence the
user’s emotions, comfort, and pleasure, and the in-
strumental factors related to usability, interaction, etc.
(ISO, 2019). Many research studies highlight the rel-
evance of the UX for the success of an online system
(Badran and Al-Haddad, 2018; Luther et al., 2020;
Yusof et al., 2022)). Thus, companies with sufficient
resources invest in frequent UX evaluation through
user testing, interviews, surveys and expert inspec-
tions (Sauro and Lewis, 2016). However, these meth-
ods are usually too costly for small and medium-sized
companies; evaluations involving users are specially
challenging to organize in the typical short iterations
of a product’s life-cycle, while experts are not always
available for frequent inspections. The result is that,
for most online systems, UX is neglected after the ini-
tial design phase (Larusdottir et al., 2018).
Therefore, to answer the need for frequent deliv-
eries with current development methods, its imper-
ative to incorporate some automation in UX evalu-
ation. Kohavi and Longbotham (2017) suggest that
controlled experiments like A/B testing are specially
useful in the context of agile software development.
In A/B or split tests, the universe of users is randomly
exposed to one of different variants of a system. To
select the best alternative or variant, it is important to
define a single metric, which is called Overall Evalu-
ation Criterion (OEC). Typical metrics used are rev-
enue, conversions, loyalty (Kohavi and Longbotham,
2017). However, UX is rarely evaluated in the context
of A/B testing (Speicher et al., 2014).
We are specially interested in defining a metric
that could be used to compare different designs in the
automatic evaluation of UX. With that goal, in this
paper we propose using the concept of “interaction
effort” (Grigera et al., 2019). The interaction effort
has been defined as a score that a UX expert assigns
to the user’s interaction with a particular web ele-
ment or widget. The important aspect is that it may
be predicted from micro-measures that are automati-
cally captured while a user interacts with a web page
(Gardey et al., 2022).
While the interaction effort has been proposed to
evaluate how each individual UI element performs,
our hypothesis in this work is that it may also be used
to provide a “global picture” of the effort demanded
by a complete design. Thus, we propose aggregating
the interaction effort of different users and widgets to
compose a global effort score on a web page. Having
a single effort score should be useful to easily assess
and communicate a measure of the overall UX of a
web page, and it also facilitates the comparison of al-
Gardey, J., Grigera, J., Rodríguez, A., Rossi, G. and Garrido, A.
An Interaction Effort Score for Web Pages.
DOI: 10.5220/0011591400003318
In Proceedings of the 18th International Conference on Web Information Systems and Technologies (WEBIST 2022), pages 439-443
ISBN: 978-989-758-613-2; ISSN: 2184-3252
Copyright
c
2022 by SCITEPRESS – Science and Technology Publications, Lda. All rights reserved
439

ternative designs.
In this paper we show a preliminary evaluation of
our hypothesis. To this end, we have compared the
global effort score with measures of perceived usabil-
ity and predicted task completion times. In particular,
we use the single usability metric (SUM) from Sauro
et al. Sauro and Kindlund (2005) and KLM-GOMS
Card et al. (1980), a quantitative modeling method for
predicting the time that an expert user takes to com-
plete a specific task without errors. Since its origi-
nal formulation by Card, KLM has been implemented
many times to automate its application. We use the
KLM-Form Analyzer proposed for web forms by Kat-
sanos et al. (2013). The results show that the global
interaction effort bears a relationship with SUM and
satisfaction scores, suggesting that it is a viable met-
ric to be used in the context of controlled experiments
for automatic UX evaluation.
2 RELATED WORK
A key component of the measure of success of an in-
teractive product is the level of UX that is provides,
and how it relates to the initial UX requirements (Hin-
derks et al., 2019a). Thus, it is essential to include UX
evaluation in software development, and this is espe-
cially challenging in agile teams that work in short
development cycles.
An established method for UX evaluation involves
the use of questionnaires (Hinderks et al., 2019b).
With this method, participants must be recruited, ex-
posed to the system under evaluation, after which
they choose the suitable value for different statements
within a value range. Some well known question-
naires are the User Experience Questionnaire (UEQ)
(Laugwitz et al., 2008), the Standardized User Ex-
perience Percentile Rank Questionnaire (SUPR-Q)
(Sauro, 2015) and UMUX-Lite (Lewis et al., 2013).
The advantage of questionnaires is that they may
reach a high level of accuracy in measuring the sub-
jective attitude of the user towards the evaluated sys-
tem. The disadvantage is that they are costly in that
they require recruiting participants and paying for
their time and feedback.
We are motivated to provide some automated so-
lution to small and medium-size development teams,
especially agile teams working under time pressure
and scarce resources, to assess the UX of their prod-
ucts. There are a few related works that propose to
automate the assessment of different aspects of the
UX. For instance, Speicher et al (2014), developed
a tool with machine learning models to predict seven
usability aspects (confusion, distraction, readability,
etc.) from user interaction logs. These aspects are
predicted separately, which means that the user of the
tool has to decide how to combine them.
Regarding the methods to get a measure of the UX
in a single score, one of the best known works is that
of Sauro and Kindlund (2005), which combines the
three usability factors (efficiency, effectiveness and
satisfaction) in a single score. Although the method
does not strictly state which measures to use to esti-
mate each factor, the original work uses task-centered
measures that cannot be easily calculated in a real
context of use. There are also other works that fo-
cus on obtaining a score from web pages such as Dou
et al. (2019) and Michailidou et al. (2021), but they
are concerned with aesthetics and visual complexity
respectively, instead of dynamic interaction.
3 INTERACTION EFFORT
3.1 From Widgets to Sessions and Pages
Interaction effort is a score assigned by a UX expert
to a specific user interaction with a target UI widget
(Gardey et al., 2022). Based on their subjective anal-
ysis, UX experts rate a widget interaction from 1 (ef-
fortless) to 4 (demanding). To avoid the need for a UX
expert, different models were developed to automat-
ically predict the effort score from micro-measures
captured from user interaction logs.
The interaction effort on widgets was proposed
with the aim of evaluating small portions of a UI, mo-
tivated by the concept of UX refactorings, which are
concrete UI transformations intended to improve the
user interaction (Gardey and Garrido, 2020). Since
there are different refactorings that can solve a given
problem, there is a need to evaluate the performance
of them in terms of UX and select the best alternative.
Having a fine-grained measure of a UI is useful to
precisely determine where users are struggling with
it, but on the other hand, when there are multiple wid-
gets under analysis, it could be hard to get an overall
measure of how the target UI works. In this way, we
propose aggregating the interaction effort score of all
the widgets included in a UI, in order to have a single
score for assessing the user effort of a complete UI.
As calculating the effort score requires collecting
user interaction data on the target UI, we carried out
a data collection process on five selected websites to
get the interaction data with the underlying widgets.
Then, this data was fed into the prediction models to
obtain the widget effort score for each user interac-
tion.
WEBIST 2022 - 18th International Conference on Web Information Systems and Technologies
440
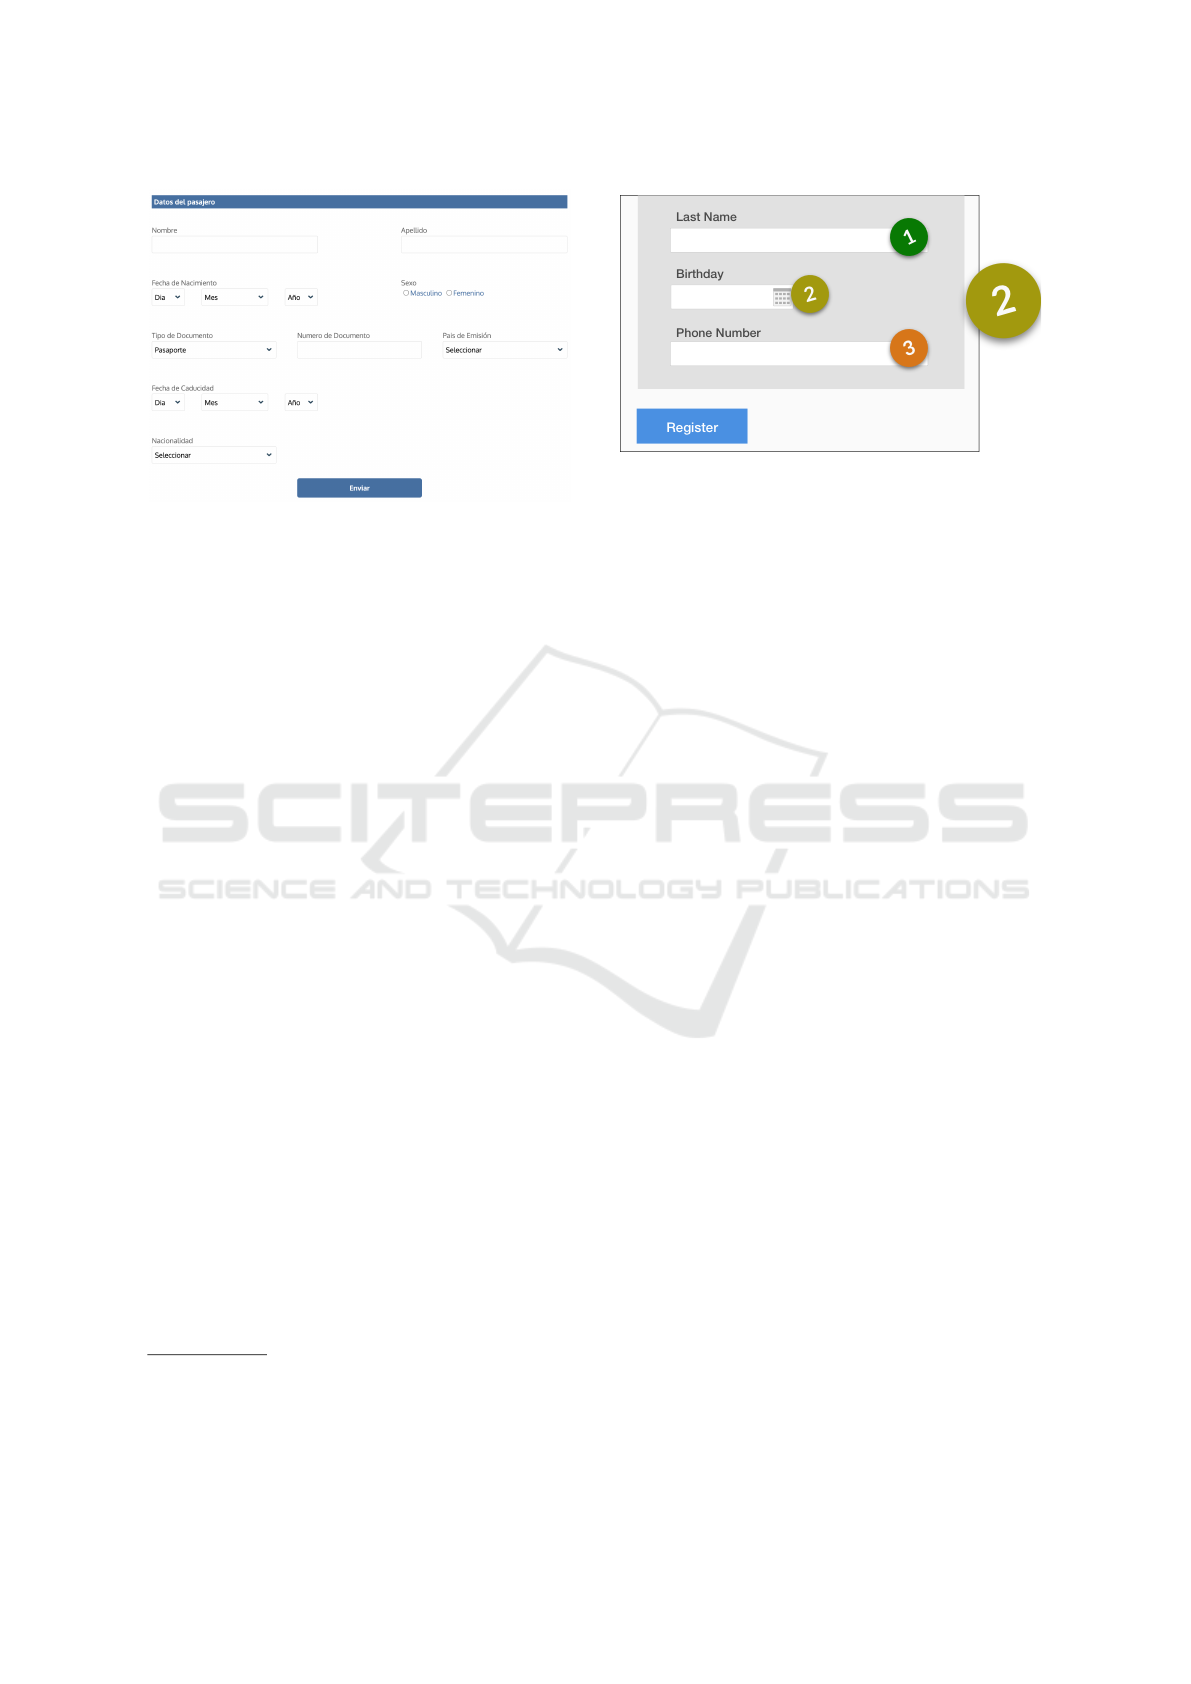
Figure 1: Webpage of task (a). Participants filled in a form
with the information required for a check-in.
3.2 Data Collection
We collected interaction data to calculate the interac-
tion effort score for five web pages containing forms
with multiple widgets. To this end, we recruited
23 participants that were instructed to complete a
small demographics questionnaire and a specific task
on each of the five web pages. Subjects were aged
from 22 to 49 (mean=33.8, SD= 9.1), had different
backgrounds, and most of them reported Internet use
greater than 4 hours per day (85%).
We provided participants with phony passport
numbers and credit card information to complete the
tasks, which were the following:
(a) Complete the check-in on an airline website (see
Figure 1).
(b) Book an appointment to get the passport in a given
city
1
.
(c) Complete the checkout process on an e-shop, en-
tering shipping details and payment information,
to finish an order
2
.
(d) Calculate the monthly payments of a loan for a
given amount
3
.
(e) Sign-up in an event ticketing e-shop
4
.
The web pages were recreated (including all the
form validations) to avoid sending sensitive informa-
tion to a real website. Participants were allowed to al-
ter their personal data but they were asked to not enter
invalid characters. A capturer was embedded in each
page to record the widget micro-measures, as well as
other metrics such as task effectiveness, time on task,
and satisfaction questionnaires.
1
https://bit.ly/3S3vNhW
2
https://bit.ly/3xsZlO2
3
https://bit.ly/3qH9CCw
4
https://bit.ly/3QN5vzF
Figure 2: Interaction effort score on a sample form.
The test was completely remote and online. Par-
ticipants received a link to a page with the instruc-
tions for the tasks that they had to carry out on each
page. When they entered on each page, they had
to turn on screen recording before starting to fill in
the form. After successfully submitting the target
form, the recording stopped automatically. An “aban-
don” option was provided to be used in case the user
could not complete the task. At the end of each task,
whether it was successfully completed or not, the user
answered a UMUX-Lite questionnaire Lewis et al.
(2013). UMUX-lite is an efficient two-item ques-
tionnaire that provides a comparable measure of user-
perceived usability. We decided to use UMUX-lite
over the most commonly used SUS because the for-
mer is more concise. This is important to not over-
whelm the participants as they had to complete one
questionnaire per task.
3.3 Effort Score Calculation
In order to get the interaction effort score of each ana-
lyzed page, we first calculated the score for each user
session. We call ‘session’ to each of the generated
recordings by the participants, which contain the logs
of the user interaction with one of the target pages.
We fed the micro-measures gathered from a user ses-
sion into the models that predict the interaction effort
of each widget Gardey et al. (2022).
These scores were then averaged (giving each one
the same weight) to obtain a single score for the user
session (see Figure 2). The global effort score for
a page was calculated as the average of all the user
sessions performed on it. Column ”Effort” in table 1
shows the resulting score for each page.
3.4 Results
We ran an evaluation to compare our combined ef-
fort metric to other established metrics in the litera-
An Interaction Effort Score for Web Pages
441
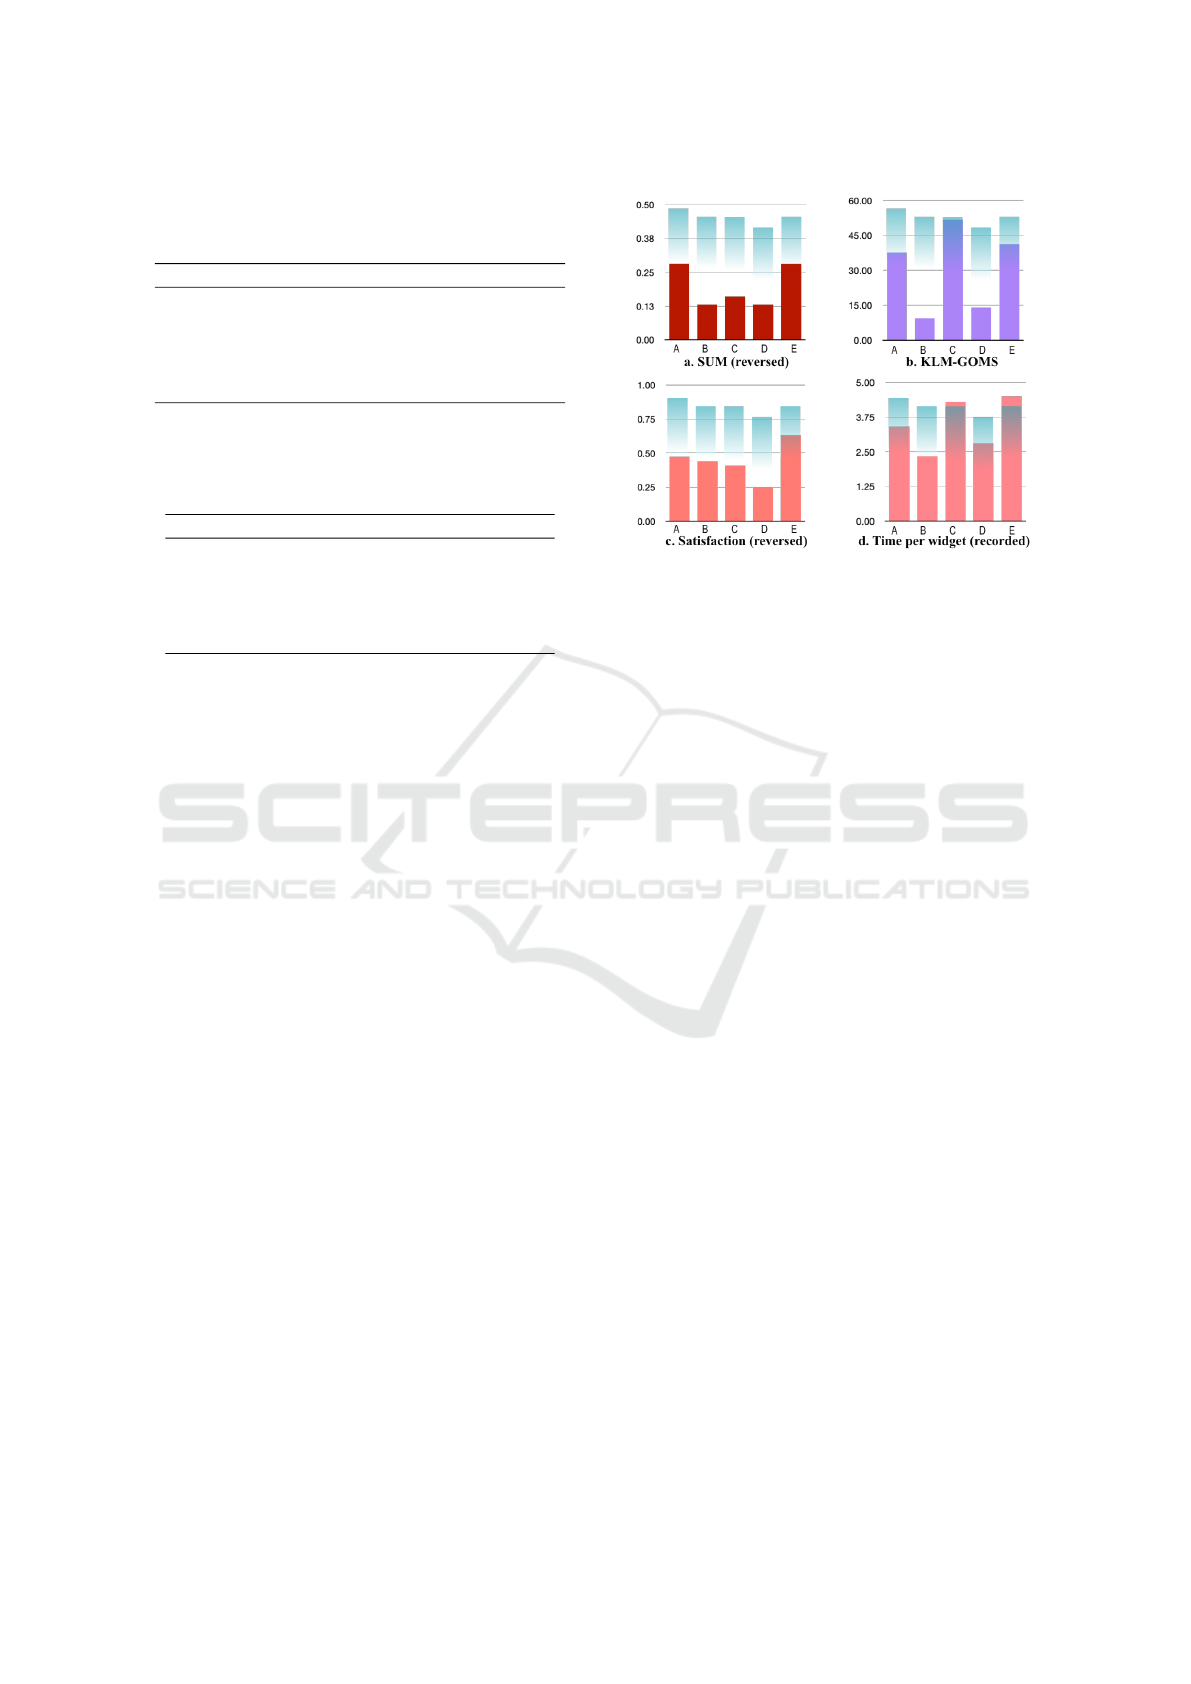
Table 1: Effort is the interaction effort score of each page.
Time, Satis., and Errors are the coefficients averaged to get
the SUM score.
Web Effort Time Satis. Errors SUM
(a) 1.34 0.95 0.55 0.66 0.72
(b) 1.25 0.94 0.56 1 0.87
(c) 1.25 0.93 0.53 0.9 0.84
(d) 1.09 0.77 0.72 0.99 0.87
(e) 1.26 0.95 0.42 0.34 0.72
Table 2: Results of KLM-GOMS. First column shows the
estimated time given by the KLM-Form Analyzer. Last col-
umn contains the time normalized by the amount of wid-
gets.
Web KLM time #widgets time/widget
(a) 37.6” 11 3.42”
(b) 9.39” 4 2.34”
(c) 51.6” 12 4.3”
(d) 14.06” 5 2.8”
(e) 41.3” 9 4.5”
ture. We calculated for each page the Single Usability
Metric (SUM) (see column ”SUM” in Table 1) and
the optimal task time using the KLM-Form Analyzer
tool (Table 2). The SUM score is the average of the
standarized task time, task completion, number of er-
rors and satisfaction. Task time was obtained from
the duration of target page sessions, and it was stan-
darized by subtracting an optimal time from the mean
task time and dividing it by the standard deviation
of the task times. With respect to the optimal time,
since the SUM authors do not provide a practical way
to calculate it, we used the one given by the KLM-
Form Analyzer (”KLM time” in Table 2). Task com-
pletion proportion was 100% because all the task at-
tempts were successfully finished. The errors propor-
tion was given by the total amount of errors made on
the form fields divided by the number of form fields
(error opportunities). Regarding the satisfaction, the
UMUX-Lite responses were averaged, subtracted 4 (a
mean rating for systems with “good” usability) and
divided by the standard deviation. The SUM score
ranges from 0 to 1 and a higher score means a better
usability.
KLM-GOMS times were averaged by the number
of widgets in each form for normalization purposes,
since the other metrics (Effort and SUM) do not de-
pend on the size of the forms.
Comparing our combined effort score to SUM
(Figure 3a), we found that they may be correlated as
the websites with the highest effort ((a) and (e)) have
the lowest SUM value, which suggests that a higher
effort means worse usability. Although websites (b)
and (c) do not follow this tendency, observing each
Figure 3: Effort score compared per-site (A to E) to differ-
ent metrics. SUM (a) satisfaction (c) are reversed to follow
effort score meaning - i.e. lower is better.
SUM component separately, we found that satisfac-
tion show similarities with the effort score: higher ef-
fort matches lower satisfaction (Figure 3c / d).
Times do not seem to keep a relationship with ef-
fort scores, as can be seen in both KLM-GOMS esti-
mation in Figure 3b, and recorded times averaged per
widget in Figure 3d.
4 CONCLUSIONS AND FUTURE
WORK
We have shown how an interaction effort metric can
be used to evaluate interactive web pages. This ef-
fort is based on user behavior and can be automati-
cally predicted. We ran an evaluation to look for sim-
ilarities with other established metrics and these pre-
liminary results suggest that higher effort scores can
be correlated with lower SUM scores, and also lower
satisfaction levels. We believe that this apparent rela-
tionship of the interaction effort score with other well-
established metrics makes it a promising metric that
can contribute to the UX assessment of a web page.
We are planning to expand this evaluation with
more samples, and other kinds of comparisons, in or-
der to find potential uses for the effort metric. Having
an overall effort score of a webpage facilitates the UX
team to track the “UX status” of a system and to com-
municate it to the product owners. Since the score can
change as more users interact with the target page, the
UX team can analyze design changes if they observe
that the effort increases.
We are also running new evaluations with alter-
natives for the same UI. This will allow us to vali-
WEBIST 2022 - 18th International Conference on Web Information Systems and Technologies
442

date whether a single interaction effort score can be
used as a metric to compare the performance of design
variations, for instance in an A/B testing approach.
With respect to the effort score calculation, our
current approach assigns the same weight to all the
widgets that are part of the target page. However, not
all elements of a UI have the same importance and
this should be considered when calculating the global
effort score. In this regard, we are studying different
strategies to weigh the widgets of a UI based on the
interaction logs captured from the users.
ACKNOWLEDGEMENTS
The authors wish to acknowledge the support from
the Argentinian National Agency for Scientific and
Technical Promotion (ANPCyT), grant number PICT-
2019-02485.
REFERENCES
Badran, O. and Al-Haddad, S. (2018). The impact of soft-
ware user experience on customer satisfaction. Jour-
nal of Management Information and Decision Sci-
ences, 21(1):1–20.
Card, S. K., Moran, T. P., and Newell, A. (1980). The
keystroke-level model for user performance time with
interactive systems. Communications of the ACM,
23(7):396–410.
Dou, Q., Zheng, X. S., Sun, T., and Heng, P.-A. (2019).
Webthetics: Quantifying webpage aesthetics with
deep learning. International Journal of Human-
Computer Studies, 124:56–66.
Gardey, J. C. and Garrido, A. (2020). User experience eval-
uation through automatic a/b testing. In Proceedings
of the 25th International Conference on Intelligent
User Interfaces Companion, IUI ’20, page 25–26,
New York, NY, USA. Association for Computing Ma-
chinery.
Gardey, J. C., Grigera, J., Rodr
´
ıguez, A., Rossi, G., and Gar-
rido, A. (2022). Predicting interaction effort in web
interface widgets. International Journal of Human-
Computer Studies.
Grigera, J., Gardey, J. C., Rodriguez, A., Garrido, A., and
Rossi, G. (2019). One metric for all: Calculating in-
teraction effort of individual widgets. In Extended Ab-
stracts of the 2019 CHI Conference on Human Factors
in Computing Systems, pages 1–6.
Hinderks, A., Schrepp, M., Mayo, F. J. D., Escalona, M. J.,
and Thomaschewski, J. (2019a). Developing a ux kpi
based on the user experience questionnaire. Computer
Standards & Interfaces, 65:38–44.
Hinderks, A., Winter, D., Schrepp, M., and
Thomaschewski, J. (2019b). Applicability of
user experience and usability questionnaires. Journal
of Universal Computer Science, 25 (13), 1717-1735.
ISO (2019). ISO 9241-210:2019 - Ergonomics of human-
system interaction — Part 210: Human-centred de-
sign for interactive systems. ISO/TC 159/SC 4.
Katsanos, C., Karousos, N., Tselios, N., Xenos, M., and
Avouris, N. (2013). Klm form analyzer: automated
evaluation of web form filling tasks using human
performance models. In Ifip conference on human-
computer interaction, pages 530–537. Springer.
Kohavi, R. and Longbotham, R. (2017). Online controlled
experiments and a/b testing. Encyclopedia of machine
learning and data mining, 7(8):922–929.
Larusdottir, M. K., Nielsen, L., Bruun, A., Larsen, L. B.,
Nielsen, P. A., and Persson, J. S. (2018). Ux in ag-
ile before and during development. In Proceedings of
the 10th Nordic Conference on Human-Computer In-
teraction, pages 984–987.
Laugwitz, B., Held, T., and Schrepp, M. (2008). Construc-
tion and evaluation of a user experience questionnaire.
In Symposium of the Austrian HCI and usability engi-
neering group, pages 63–76. Springer.
Lewis, J. R., Utesch, B. S., and Maher, D. E. (2013). Umux-
lite: when there’s no time for the sus. In Proceedings
of the SIGCHI conference on human factors in com-
puting systems, pages 2099–2102.
Luther, L., Tiberius, V., and Brem, A. (2020). User ex-
perience (ux) in business, management, and psychol-
ogy: A bibliometric mapping of the current state of
research. Multimodal Technologies and Interaction,
4(2):18.
Michailidou, E., Eraslan, S., Yesilada, Y., and Harper, S.
(2021). Automated prediction of visual complexity
of web pages: Tools and evaluations. International
Journal of Human-Computer Studies, 145:102523.
Sauro, J. (2015). Supr-q: A comprehensive measure of the
quality of the website user experience. Journal of us-
ability studies, 10(2).
Sauro, J. and Kindlund, E. (2005). A method to standardize
usability metrics into a single score. In Proceedings of
the SIGCHI Conference on Human Factors in Com-
puting Systems, CHI ’05, page 401–409, New York,
NY, USA. Association for Computing Machinery.
Sauro, J. and Lewis, J. R. (2016). Quantifying the user expe-
rience: Practical statistics for user research. Morgan
Kaufmann.
Speicher, M., Both, A., and Gaedke, M. (2014). Ensur-
ing web interface quality through usability-based split
testing. Icwe, LNCS 8541, pages 93–110.
Yusof, N., Hashim, N. L., and Hussain, A. (2022). A con-
ceptual user experience evaluation model on online
systems. International Journal of Advanced Com-
puter Science and Applications, 13(1).
An Interaction Effort Score for Web Pages
443
