
Do Top Higher Education Institutions' Social Media Communication
Differ Depending on Their Rank?
Alvaro Figueira
1a
and Lirielly Vitorugo Nascimento
2
1
CRACS/INESCTEC and FCUP, University of Porto, Porto, Portugal
2
Department of Computer Science, FCUP, University of Porto, Porto, Portugal
Keywords: Higher Education Institutions, Social Media Communication, Twitter, Ranking Analysis, Publishing
Strategies.
Abstract: Higher Education Institutions use social media as a marketing channel to attract and engage users so that the
institution is promoted and thus a wide range of benefits can be achieved. These institutions are evaluated
globally on various success parameters, being published in rankings. In this paper, we analyze the publishing
strategies and compare the results with their overall ranking positions. The results show that there is a
tendency to find a particular strategy in the top ranked universities. We also found cases where the strategies
are less prominent and do not match the ranking positions.
1 INTRODUCTION
Year after year, there are more rankings available so
that people can make more informed decisions.
Higher Education Institutions (HEI) are no exception,
university rankings are becoming not only more
numerous as also more commonly used. The goal in
creating these rankings is to measure and evaluate
success in various areas or criteria. The metrics used
are improving, as are the methods to determine them
more accurately. Generically, HEI have been
evaluated on factors such as student success, research
volume, funding and awards, internationalization,
employment, and connections to industry, among
others.
There are several leading indexes today for HEI.
Probably the best known and most widely used are
the CWUR
2
, QS
3
, Leiden
4
, ARWU (also known as the
Shanghai ranking
5
), and URAP
6
. It has been shown
(Olcay, 2017) that the correlation between these
indices has been strong over the years. Therefore,
despite some small variations in the indexes, the
a
https://orcid.org/0000-0002-0507-7504
2
https://www.cwur.org
3
https://www.topuniversities.com/
4
https://www.leidenranking.com/
5
https://www.shanghairanking.com/
6
https://urapcenter.org/
overall picture given by one does not differ much
from the others.
The comparison of these rankings, the inherent
challenges and what is means for a HEI to be in a rank
have been already studied in Aguillo et al. (2010),Van
Raan (2005), and Liu (2009), to name a few. In this
article, we want to take a different approach by not
discussing the ranking itself, but by comparing the
ranking of the HEIs with their posting strategies in
Twitter in order to analyze to what extent the external
communication of HEI differs from each other. Our
motivation is that at a time when the recruitment of
new students, distinguished researchers and funding
depends heavily on the image that each HEI conveys,
external communication becomes a crucial element
for these tasks (Gajić, 2012). Since the Twitter
network (and also Facebook) is one of the most
widely used networks in academia, we believe it is
important to review the performance and strategies of
higher education institutions in this network.
Ultimately we want to understand if the rankings also
reflect some difference on the way a HEI projects its
messages.
Figueira, A. and Nascimento, L.
Do Top Higher Education Institutions’ Social Media Communication Differ Depending on Their Rank?.
DOI: 10.5220/0011592500003318
In Proceedings of the 18th International Conference on Web Information Systems and Technologies (WEBIST 2022), pages 355-362
ISBN: 978-989-758-613-2; ISSN: 2184-3252
Copyright
c
2022 by SCITEPRESS – Science and Technology Publications, Lda. All rights reserved
355

There have been some studies regarding the
analysis of the social media publications in HEI
(Dumpit and Fernandez, 2017), of methods to analyse
their postings (Figueira, 2018a and 2018b) and of
inspecting the publication strategy in top-ranked HEI
(Coelho, 2021). In our approach we take a
longitudinal perspective by analysing and comparing
more HEIs and not only those close to the top of the
ranking. We want to identify and compare how their
external communication varies as we vary the ranking
position signifificatively.
In the remainder of this paper, Section 2 explains
our analysis for selecting a particular ranking and the
premises for sampling higher education institutions.
In Section 3, we conduct an analysis of the data
collected. In Section 4, we compare all HEI using a
vector space model and analyze the results. Finally,
in Section 5, we summarize the research process and
draw our final conclusions.
2 DATA RETRIEVAL
In this study we chose to use four of the most used
rankings’ pages (CWUR, Shanghai, US News and
QS). Despite acknowledging the results from (REF)
we intended to confirm that there are small variations
between the four rankings. We used the Kendall
distance and the Kendall correlation coefficient
(“Kendall’s τ”) metrics (Kendall, 1938) and (Field,
2005). Kendall Distance is 0 for identical, in the sense
of top-k, lists and 1 if completely different ones.
Kendall Tau is a measure of the correspondence
between two rankings, where values close to 1
indicate strong agreement and values close to -1
indicate strong disagreement. Another metric
frequently used in comparing ranked lists is the Rank
Biased Overlap (“RBO”), where 1 means identical
ranking and 0 means disjoint lists. The RBO is more
robust to cope with top weighted-ness (Webber,
2010).
Our goal was to test if one ranking has no
significant variations when compared with the other
ones. The results obtained for Kendall distances was
zero for all combination comparison between the
university rankings. The Kendall τ (and RBO) results
were 0.64 (0.95) for CWUR versus Shanghai, 0.63
(1.00) for CWUR versus USNews and 0.47 (0.05) for
CWUR versus QS. Despite a less strong similarity
between CWUR and QS, the general conclusion is
that there is not a significant variation in the rankings.
Therefore, we proceeded considerign just the CWUR
ranking.
We intended to collect posts from HEIs in ranking
positions 1 to 10. Then, in positions 100, 200, 300,
400 and 500. This wide-span on the ranking would
give simultaneously as a perspective on top-
performing HEI, as well as the eventual differences
on a wide extent of the ranking list. These positions
and their respective ranking in the fours indexes are
depicted in the Table 1. As it can be seen, for the
selected HEI, the differences in the ranking are not
significant for the goal of this paper.
Table 1: HEIs rankings on the four rankings.
High Education Institution CWUR Shanghai USNews QS
Harvard University 1 1 1 5
Massachusetts Institute of
Technolo
gy
2 3 2 1
Stanford University 3 2 3 3
University of Cambridge 4 4 8 3
University of Oxford 5 7 5 2
Princeton University 6 6 16 20
University of Chicago 7 10 15 10
Columbia University 8 8 6 19
University of Pennsylvania 9 15 13 13
California Institute of
Technolo
gy
10 9 9 6
Boston University 99 101-150 65 112
University of Lisbon 200 201-300 197 356
University at Buffalo 300 301-400 280 338
University of Porto 308 201-300 255 295
University of Oklahoma,
Norman
400 501-600 425
651-
700
Federal University of Minas
Gerais
500 401-500 456
651-
701
Some changes for the list of HEI to retrieved
tweets were made: the ranking position 99 have been
chosen instead of position 100, because Keio
University (position 100) has stopped tweeting after
April 2020. University of Porto was included in the
analysis, by curiosity, because it is the University of
the authors.
We built an in-house tweet collector for retrieving
the most recent 2500 tweets from the official Twitter
account of each HEI, setting the last possible post at
31 July 2022. Tweets were extracted in two periods at
the 5
th
and the 17
th
of August, 2022. Unfortunately,
the Twitter API did not return all the 2500 tweets for
University of Lisbon (only 1583) and for University
of Buffalo (only 1235). For the retrieval we excluded
any retweet. The reason behind this is that these two
HEI still do not have posted 2500 tweets.
As different HEI have different posting
frequencies, the time span for the 2500 tweets is also
different for each HEI. In Figure 1, we can see the
common period for the tweets posts between all the
WEBIST 2022 - 18th International Conference on Web Information Systems and Technologies
356
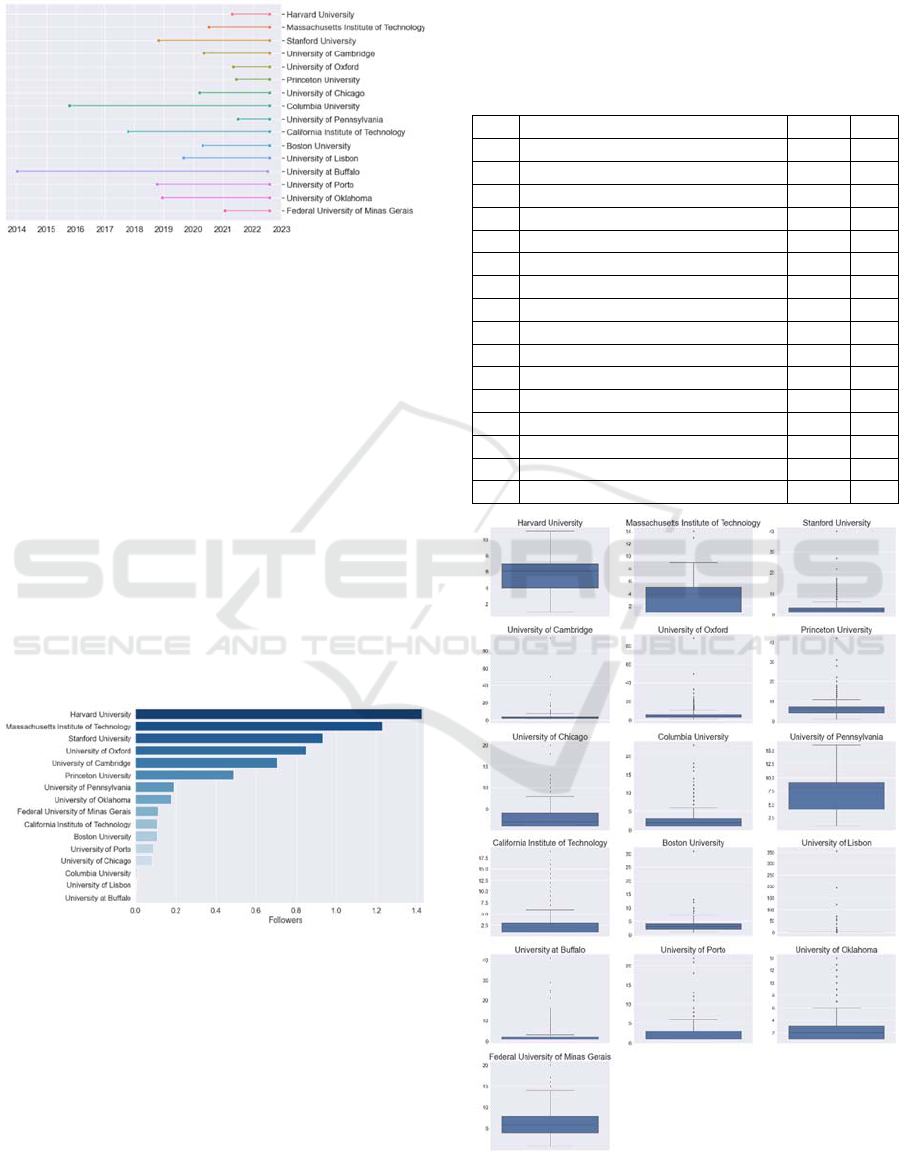
HEI. As depicted in the figure the biggest common
period is between February 2022 to July 2022.
Figure 1: Collected period for each HEI.
In the next section we will inspect the retrieved
data and perform a more in detail analysis of
publishing time and content.
3 DATA ANALYSIS
There have been some studies regarding the analysis
of the social media publications in HEI (Figueira,
2018a and 2018b) and of analysing the publication
strategy in top-ranked HEI using machine learning
methods (Coelho, 2021). In our approach we take a
longitudinal perspective by analysing a bigger set of
HEI and not only those on the top of the ranking, as
we expect to see changes as we go further in the
ranking list. We begin by analysing the number of
followers for each HEI using Figure 2.
Figure 2: Number of followers as of July 2022.
Looking at Figure 2 we can see that Harvard has
the greatest number of followers with more than 1.4
million, followed by MIT with more than 1.2 million,
Stanford with more than 900K, Cambridge with more
than 700K, Princeton with more than 400K,
Pennsylvania and Oklahoma with more than 190K
and 177K respectively, Federal University of Minas
Gerais, California Institute of Technology, Boston,
Porto and Chicago each one with more than 114K,
109K, 108K, 86K and 80K respectively, and with less
than 11K is Columbia, Lisbon and Buffalo, in this
sequence. Table 2, below, depicts the mean and
maximum number of posts for the daily tweet
frequency for all the High Education Institutions.
Table 2: Posting daily frequency (decreasing order).
Rank Higher Education Institution Mean Max
9 University of Pennsylvania 6.87 16
6 Princeton University 6.19 42
500 Federal University of Minas Gerais 6.11 20
5 University of Oxford 5.66 88
1 Harvard University 5.46 11
4 University of Cambridge 3.43 95
2 Massachusetts Institute of Technology 3.42 14
200 University of Lisbon 3.40 355
99 Boston University 3.14 31
7 University of Chicago 3.04 20
3 Stanford University 2.63 40
8 Columbia University 2.59 23
400 University of Oklahoma - Norman 2.59 14
308 University of Porto 2.32 22
300 University at Buffalo 2.26 41
10 California Institute of Technology 2.09 19
Figure 3: Boxplots of daily posting for each HEI.
Do Top Higher Education Institutions’ Social Media Communication Differ Depending on Their Rank?
357
We notice that Harvard has the smaller standard
deviation in posting frequency, and Oxford the
highest. This leads us to believe the strategy in
Harvard is more consolidated, around 5-6 posts a day.
On the other hand, we can see that Stanford,
Columbia, Oklahoma-Norman, Porto, Buffalo, and
California Institute of Technology publish between 2
to 3 posts a day.
We note the incredible number of posts (355) for
a single day in University of Lisbon on September
25
th
, 2021. Figure 3 depicts the box-plot graph for the
universities tweets daily frequency. Interpreting the
plots, it is easy to see that University of Pennsylvania
tweets daily frequency have a normal distribution
with mean of 6 tweets a day and there are no outliers.
Similarly, Harvard University has almost the same
aspect of a normal distribution with only two outliers,
one above the superior limit and one below the
inferior limit. The same behaviour happens for
Massachusetts Institute of Technology and Federal
University of Minas Gerais with a normal distribution
with outliers above the superior limit.
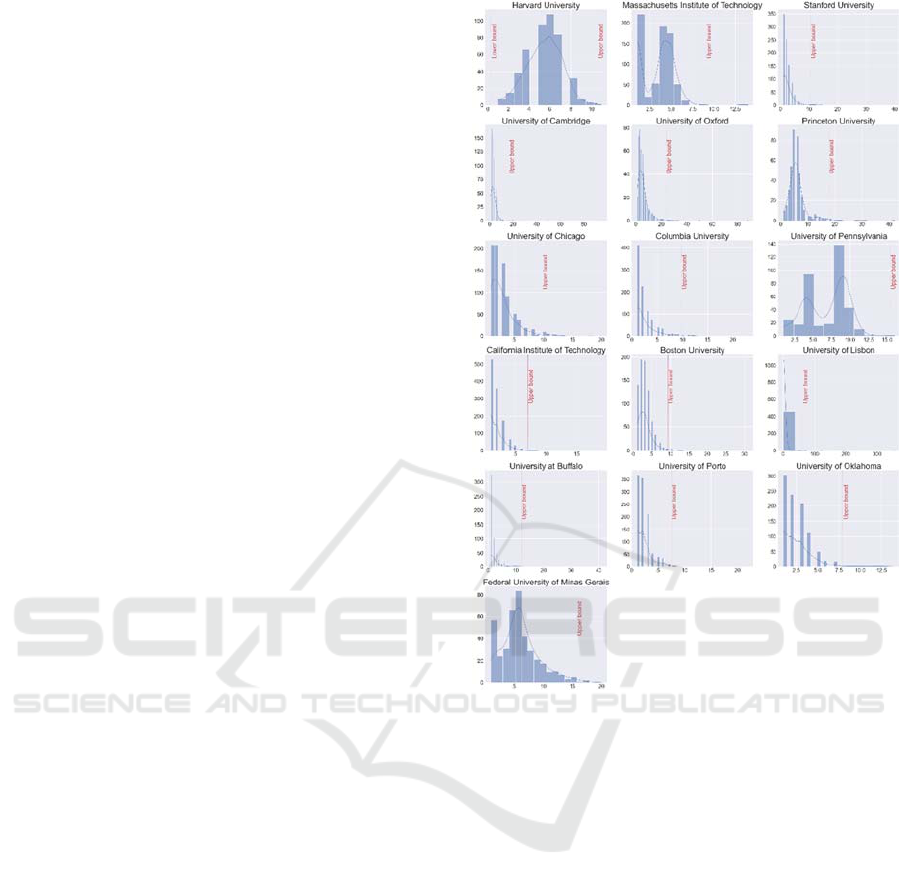
A common pattern can be seen in the California
Institute of Technology, Columbia, Stanford,
Buffalo, Lisbon, and Porto in which there is a very
squeezed distribution (Figure 4) with a large tail of
outliers which shows that there is not a constancy in
the tweets of those universities.
Another similar pattern can be seen at the plots of
Oxford, Princeton and, Boston where the
visualization of the mean is clear, above one post,
showing that these universities have some constancy
in the daily tweets. In Harvard, Pennsylvania, and
Minas Gerais we still have that pattern, but at a
smaller level presenting a not so balanced Gaussian
distribution.
Looking into all HEI posts, and framing into the
intersection period, we built a tweet frequency table,
crossing the weekday with the posting hour. This
results in the heat map (Figure 5) bellow. Inspecting
it, we see there is a common pattern for the
Universities of Pennsylvania and Oklahoma, in which
posts are concentrated between 2 PM to 9 PM of
weekdays.
We can also see that in Harvard, Princeton, Chicago,
and Boston, posting is a all-week activity, despite
being done on working hours only (which,
generically, all HEI do). However, we can also notice
that in MIT, Pennsylvania, Oklahoma and Minas
Gerais, high frequency posting is condensed in a short
period of time and weekdays. This situation leads us
to believe there is regular and systematic line of work
in external communication, which may be seen as an
editorial approach.
Figure 4: Distribution of posting frequencies.
Continuing the analysis, we created a set of word
clouds for each HEI in respect to all retrieved posts,
as well as for the common posting period. In Figure 6
we present the word clouds using all available
retrieved posts for each HEI.
We can notice that HEI do invest in the projection
of their image: most HEI have as the most used term
their name. Therefore, it is interesting to see that
Columbia, Boston, Lisbon, and Oklahoma differ from
this pattern. We can also see that the terms ‘student’
and ‘research’ are common on almost all HEI,
showing their concern for these topics and respective
focus on specific segments of readers.
Notably, University of Lisbon, does not present a
high relevance of these terms. University of Porto and
of Minas Gerais present the Portuguese counterparts
‘estudante’ and ‘pesquisa’. We can also observe traits
of engagement actions directed to newcomers in all
HEI, many times by congratulating them as we see
the terms ‘first’, ‘year’, and ‘new’. Finally, the terms
‘pandemic’ and ‘vaccine’ still are common in posts
WEBIST 2022 - 18th International Conference on Web Information Systems and Technologies
358
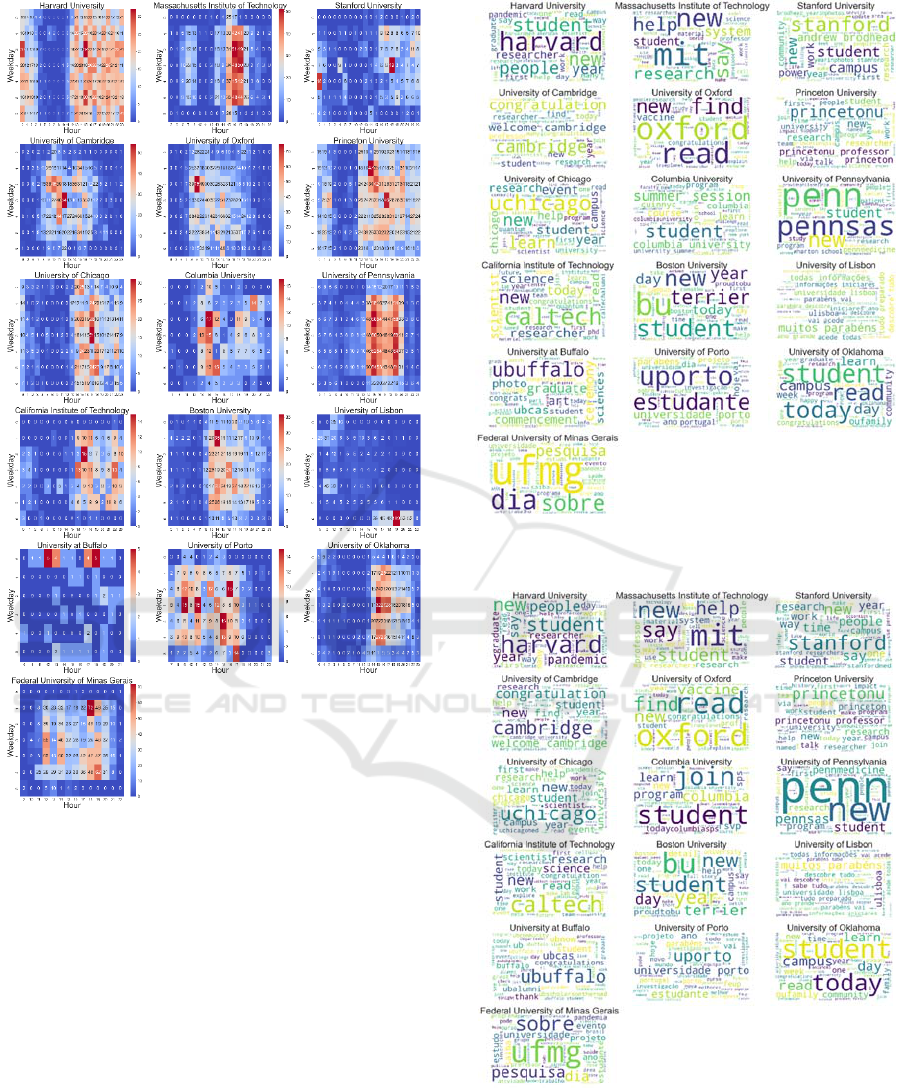
Figure 5: Publication weekday and time.
from Harvard and Oxford (and not in the other HEI,
which reflects an important editorial difference).
When we frame the analysis on the common
publishing period (Figure 7) we notice just two minor
changes: a) an increase of engagement actions in
Columbia when comparing to the other terms, b) a
reduction of importance of branding and projecting
the institutional image at University of Porto.
Hence, as we see it, despite different HEI
publishing at different periods and in different
frequencies, they use very small variations on their
strategies in what concerns the textual content.
Therefore, it remains unclear whether there is a
generical mapping between the ranking lists and the
strategies and publishing patterns that each HEI
adopts.
Figure 6: Word cloud for each HEI considering all retrieved
posts.
Figure 7: Word cloud for each HEI considering the
common period.
We also inspected the sentiment of the posts from
each HEI. For that we used the TextBlob library
(0.16.0), in a Python implementation, which returns
one of three possible values for each text: positive,
Do Top Higher Education Institutions’ Social Media Communication Differ Depending on Their Rank?
359
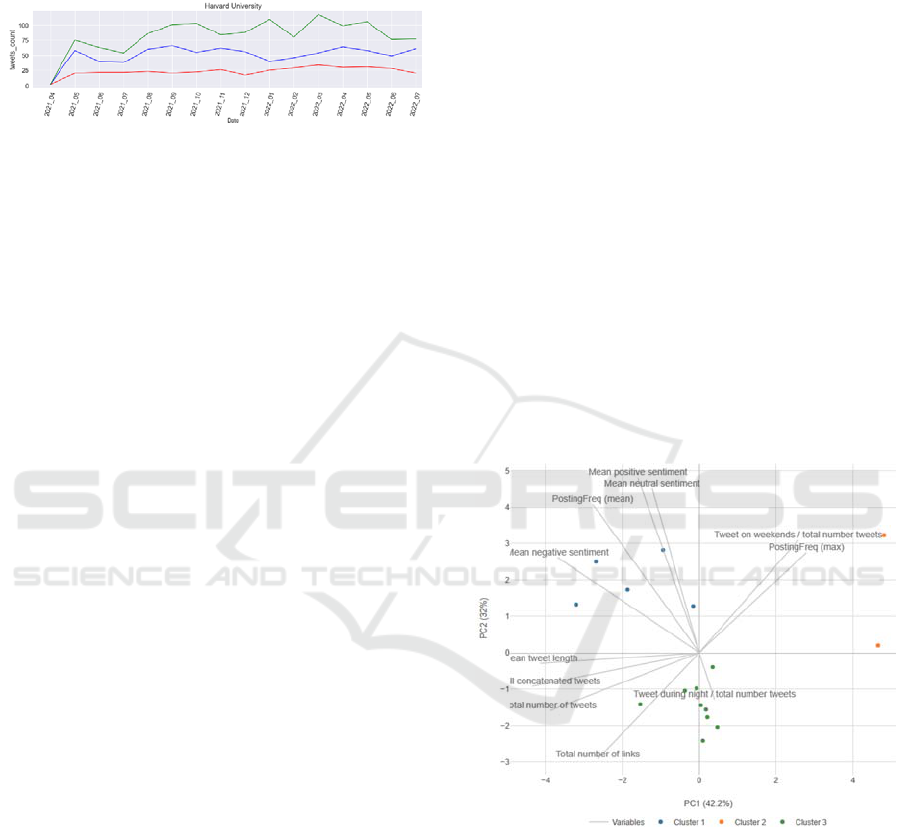
neutral, or negative sentiment. The value returned
corresponds to the result of the analysis of the text. To
better understand we present the evolution of
sentiment in the posts from Harvard in Figure 8,
where we group tweets in months.
Figure 8: Monthly evolution of sentiment form Harvard
posts. Negative sentiment in red, neutral in blue and
positive in green.
For the sake of saving space, we do not present the
graphs for all HEI in this section. However, we will
use the computed values to compare HEI in the next
section.
4 GROUPING THE STRATEGIES
To deepen our analysis, we decided to compare
quantitatively the publication strategies of HEI. As
we will be using numerical quantities, we can make
the comparisons of all at once. Our intention will be
to perform an unsupervised classification which my
group the HEI according to the metrics we will use.
As we are interested in the publication patterns,
features like employment, student success, research
funding, etc. will not be of our concern. We just want
to use metrics acquired from inspecting the retrieved
tweets, group the HEI according to these metrics, and
compare the result with the rankings.
4.1 The Feature Space Vector Model
To reflect most of the analysis we have done
previously, we choose 10 features to represent the
publishing behaviour of each HEI. Those are:
Mean daily posting frequency
Max daily posting frequency
Ratio of publishing in weekends (Saturday +
Sunday)
Ratio of publishing during night period (9pm to
7am)
Mean positive sentiment
Mean neutral sentiment
Mean negative sentiment
Mean tweet length (text)
Length of all concatenated tweets (text)
Total number of links used in the text
These features represent most of the analysis
described previously and now are used together to
represent a signature of each HEI posting behaviour.
4.2 Clustering the HEI
We are representing each HEI as a vector in a 10-
dimensional vector space model. In this
representation we can compute the distances between
HEIs and check which ones are closer to the others.
Then, using a grouping algorithm we are able
associate closer HEIs together. For that we use the
standard k-means algorithm. We experimented
generic k-means (MacQueen, 1967) with the Floyd
algorithm (Linde et al., 1980) and with the Hartigan-
Wong (Hartigan and Wong, 1979) algorithms, but the
results were almost identical. We tried to minimize
the inter-cluster distances using different number of
clusters while comparing them using the ‘elbow
method’. Finally, using the best results, we decided to
use 3 clusters for grouping the HEIs. In Figure 9 we
present a mapping of each HEI coloured according to
the assigned cluster. This representation uses a PCA
transformation (Abdi, 2010) in order to represent 10-
dimensional points in 2 dimensions.
Figure 9: Positioning of each HEI in a 2D projection of the
feature space. Also clustering the HEI in three groups using
colour.
We can confirm this clustering makes sense
because there is a clear distinction of the 3 groups:
HEI in blue in the second quadrant (cluster 1), HEI in
orange in the first quadrant (cluster 2), and HEI in
green (mostly around the separation between the third
and the fourth quadrants (cluster 3).
To complete the analysis, we checked the
distribution of the normalized values of the 10 features
in each cluster (Figure 10, bellow) using boxplots.
WEBIST 2022 - 18th International Conference on Web Information Systems and Technologies
360
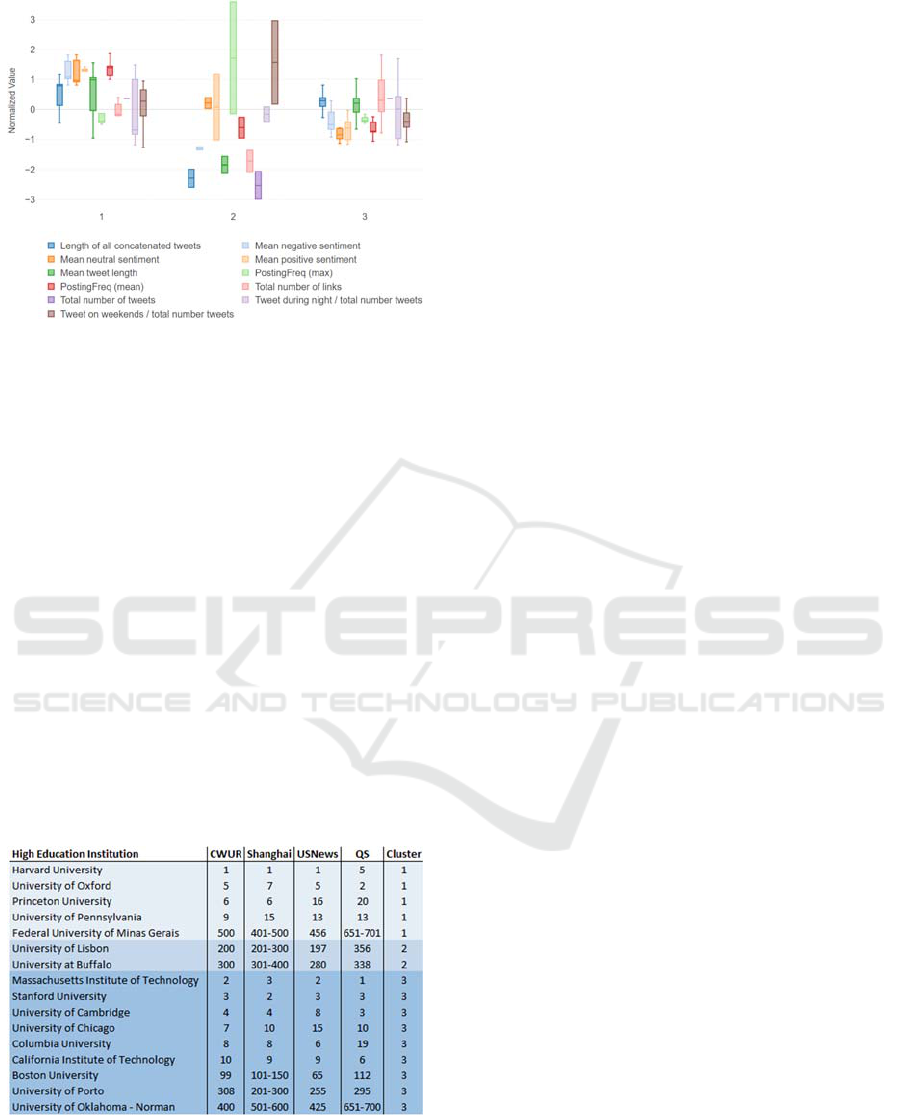
Figure 10: Distribution of each variable in each cluster.
As can be seen, clusters 1 and 3 have a dense
distribution of the variables, and they mainly differ in
the sentiment values (positive on cluster 1 and
negative on cluster 3), on the mean posting frequency
(positive in 1 and negative in 3), and total number of
links (higher in cluster 3). We also note that in cluster
2 the variables have much more dispersion, in which
we interpret as a diffused and not-well established
strategies.
4.3 Analysis of the Results
In order to compare these results with the rankings,
we use Table 3, where we include the cluster
assignment (last column) together with the four
ranking lists. We ordered the table with respect to
column ‘cluster’, hence grouping HEIs that belong to
the same cluster.
Table 3: Cluster assignment.
As we can see, in the first cluster, apart from
University of Minas Gerais, all the other are placed in
top positions in the rank. In cluster three, we see HEIs
that are placed in a wide-span positions of the ranking
lists. We can also see that there ae only two HEIs
assigned to cluster two. These HEI are from the
middle of the list (positions 200 and 300 in CWUR).
Therefore, it seems these HEI have publishing
strategies that are not consolidated and with less clear
objectives. We may also say that HEI in cluster 1 have
a tendency to be placed in top positions of the
rankings and in cluster two they may be positioned
anywhere.
5 CONCLUSIONS
In this paper we have shown that there is a small
relation between publishing strategies and top-ranked
Higher Education Institutions. More expressive
sentiments in tweets, higher tweet length, bigger
posting frequency and smaller number embedded
links are characteristics of top ranked HEIs.
To get to these conclusions we identified a set of
HEI for which we retrieved 2500 tweets. We analysed
these tweets in respect to publishing frequency, date
and content. HEI were represented as vectors in a 10-
dimensional space we created, and then grouped
using the k-means clustering algorithm.
As for future work we intend to further analyse the
content to detect topics and check if there is a
connection between this variable and the rank of each
HEI.
ACKNOWLEDGEMENTS
This work is financed by National Funds through the
Portuguese funding agency, FCT – “Fundação
para a Ciência e a Tecnologia”, within project
LA/P/0063/2020.
REFERENCES
Abdi, H., & Williams, L. J. (2010). Principal component
analysis. Wiley interdisciplinary reviews:
computational statistics, 2(4), 433-459.
Aguillo, I., Bar-Ilan, J., Levene, M., & Ortega, J. (2010).
Comparing university rankings. Scientometrics, 85(1),
243-256.
Coelho, T., & Figueira, Á. (2021, December). Analysis of
Top-Ranked HEI Publications’ Strategy on Twitter. In
2021 IEEE International Conference on Big Data (Big
Data) (pp. 5875-5877). IEEE.
Dumpit, D. Z., & Fernandez, C. J. (2017). Analysis of the
use of social media in Higher Education Institutions
(HEIs) using the Technology Acceptance Model.
Do Top Higher Education Institutions’ Social Media Communication Differ Depending on Their Rank?
361

International Journal of Educational Technology in
Higher Education, 14(1), 1-16.
Field, A. P. (2005). Kendall's coefficient of concordance.
Encyclopedia of Statistics in Behavioral Science, 2,
1010-11.
Figueira, Á. (2018a). Uncovering social media content
strategies for worldwide top-ranked universities.
Procedia Computer Science, 138, 663-670.
Figueira, Á. (2018b). A Three-Step Data-Mining Analysis of
Top-Ranked Higher Education Institutions'
Communication on Facebook. In Proceedings of the Sixth
International Conference on Technological Ecosystems
for Enhancing Multiculturality (pp. 923-929).
Gajić, J. (2012). Importance of marketing mix in higher
education institutions. The European Journal of
Applied Economics, 9(1), 29-41.
Hartigan, J. A., & Wong, M. A. (1979). Algorithm AS 136:
A k-means clustering algorithm. Journal of the royal
statistical society. series c (applied statistics), 28(1),
100-108.
Kendall, M. G. (1938). A new measure of rank correlation.
Biometrika, 30(1/2), 81-93.
Linde, Y., Buzo, A., & Gray, R. (1980). An algorithm for
vector quantizer design. IEEE Transactions on
communications, 28(1), 84-95.
Liu, N. C. (2009). The story of academic ranking of world
universities. International Higher Education, (54).
MacQueen, J. (1967). Classification and analysis of
multivariate observations. In 5th Berkeley Symp. Math.
Statist. Probability (pp. 281-297).
Olcay, G. A., & Bulu, M. (2017). Is measuring the
knowledge creation of universities possible?: A review
of university rankings. Technological Forecasting and
Social Change, 123, 153-160.
Scott, A. J., & Symons, M. J. (1971). Clustering methods
based on likelihood ratio criteria. Biometrics, 387-397.
Van Raan, A. F. (2005, June). Challenges in ranking of
universities. In Invited paper for the First International
Conference on World Class Universities, Shanghai Jaio
Tong University, Shanghai (pp. 133-143).
Webber, W., Moffat, A., & Zobel, J. (2010). A similarity
measure for indefinite rankings. ACM Transactions on
Information Systems (TOIS), 28(4), 1-38.
WEBIST 2022 - 18th International Conference on Web Information Systems and Technologies
362
